
 ?Mathematical formulae have been encoded as MathML and are displayed in this HTML version using MathJax in order to improve their display. Uncheck the box to turn MathJax off. This feature requires Javascript. Click on a formula to zoom.
Abstract
Bistatic SAR interferometry is a feasible technique of deriving glacier height changes. Early studies on glacier change in the Qilian Mountains showed that the glacier area declined, terminus retreated, and flow velocity slowed down. In this study, five pairs of X-band bistatic TerraSAR-X/TamDEM-X images from 2014 to 2019 and an iterative D-InSAR method respect to SRTM DEM of 2000 were employed, which improved the reliability and accuracy of glacier height changing observations. From 2000 to 2014, the height of glaciers in the Lenglonglin Mountains decreased by (–0.64 ± 0.06) m year−1. Glaciers in the Gangshika peak and its surrounding region thinned at the rate of (–0.68 ± 0.09) m year−1 from 2014 to 2019. The values observed using remote sensing was in accordance with RTK–GPS measured values. Stable precipitation and increasing temperature since 1990 could be responsible for the quick glacier mass loss.
Introduction
Global and regional climate changes have triggered changes in glacier area, elevation, snow line altitude, and velocity, which in turn have considerably impacted sea level altitude and water resources in arid areas (Gardner et al. Citation2013; Dehecq et al. Citation2019; Wei et al. Citation2021; Yue et al. Citation2021). As the mean yearly precipitation in the north-west arid region of China is lower than 400 mm, glacier and snow-melt in the Qilian Mountains can guarantee water for irrigation, hydraulic power, and drinking (Li et al. Citation2010; Zhang and Kang Citation2021).
It is dangerous and laborious to evaluate glacier storage change by using traditional field measurements of stake or RTK–GPS (Real-Time Kinematic Global Positioning System); furthermore, only small areas can be monitored. Recently, remote sensing has gained popularity for the observation of glacier height change over time through multitemporal surface digital terrain difference (the geodetic method) and its low cost and wide swath coverage, which make it suitable for consistently surveying large areas (Brun et al. Citation2017; Bhattacharya et al. Citation2021). Satellite laser altimetry or optical photogrammetry were used to calculate glacier height changes in most previous studies. The former has a coarse spatial resolution and is easily affected by clouds; the latter has a low contrast on the glacier accumulation zone. Bistatic SAR interferometry is an alternative remote sensing method to optical photogrammetry and altimetry. TanDEM-X (TDX) was launched in 2010 to join its twin satellite TerraSAR-X (TSX), and they operate in the bistatic mode. This observation mode overcomes the temporal decorrelation and atmospheric delay disturbance associated with conventional repeat-pass interferometry. TanDEM-X was successfully applied to detect glacier elevation change (Braun et al. Citation2019; Li et al. Citation2021).
Glaciers in the Lenglongling Mountains (LLM) have been experiencing rapid shrinkage. The mean rate of change in glacier surface elevation for overall LLM was (–0.43 ± 0.03) m year−1 during the 1976–2016 period based on topographic maps and ZY-3 data and geodetic methodology (Cao et al. Citation2019). Based on the comparison of topographic map in 1972 with DEM from RTK–GPS in 2010, the Ningchan No. 1 Glacier has an annual elevation change of −0.76 m year−1 (–0.65 m w.e. year−1). Additionally, a mean annual mass balance of (–0.90 ± 0.5) m w.e. was obtained during the period 2010–2015 using the stake (glaciological) methodology (Cao et al. Citation2017, Citation2019) and −1.16 m year−1 (–0.98 m w.e. year−1) during 2010–2020 (Pan et al. Citation2021). The Ningchan No.1 glacier changes displayed in the digital surface models from unmanned aerial vehicles show a mass balance of (–1.22 ± 0.1) m w.e. year−1 from 2017 to 2020 (Cao et al. Citation2021). When comparing the two DEMs generated from topographic maps and RTK–GPS data, the mean surface elevation decreased by 0.64 m year−1 for nine glaciers in the Ningchan and Shuiguan rivers sources between 1972 and 2010 (Cao et al. Citation2014). The mean annual mass balance of the Shuiguan No. 4 Glacier was −0.51 m w.e. year−1 from 2010 to 2013, based on stake observations (Cao et al. Citation2017).
This study used bistatic image pairs of TerraSAR-X/TanDEM-X with medium perpendicular baselines, aided by the differential SAR interferometry (hereinafter referred to as D-InSAR) method, to research glacier height changes in the LLM during the periods 2000–2014 and 2014–2019. To overcome SAR distortion errors, we eliminate the foreshortening, layover, and shadow regions induced by SAR’s side-looking geometry. The relationship between glacier elevation and climate change was analysed.
Study area and data
Study area
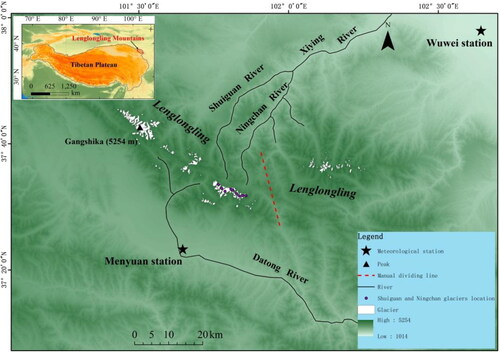
The LLM (), located in the north of the Tibetan Plateau, are approximately 250 km in length, 30–50 km in width, have an altitude of approximately 3000–5254 m, the mean elevation is greater than 4000 m asl and the Gangshika peak (5254.5 m) is the highest point with a gentle southern slope, a steep northern slope, and the area governed by an arid to semi-arid climatic regime (Cao et al. Citation2010; Tian et al. Citation2012). A total of 161 glaciers above 4000 m asl in the LLM were documented in the Second Chinese Glacier Inventory, covering a total area of 58.66 km2. The volume storage is 1.88 km3 as most glaciers are small, 144 of them are smaller than 1 km2 (Liu et al. Citation2015). Glaciers in this area are mainly influenced by the combined effects of the East Asian monsoon and the Westerlies, and are classified as subcontinental-type glaciers (Cao et al. Citation2010; Tian et al. Citation2012). The mean annual air temperature during the period 1980–2010 was 1.17 °C and the mean precipitation was 700–800 mm, as recorded at the Menyuan Meteorological Station (37°23′N, 101°37′E, 2924 m asl); the precipitation mainly concentrated during the May–September period. The glaciers belong to the summer-accumulation-type mountain glacier, and the ablation and accumulation period overlap (Li et al. Citation2010; Cao et al. Citation2014; Liu et al. Citation2015). The glaciers on the southwest-facing slope of the LLM feed the drainage basin of the Datong River—a tributary of the Yellow River. The glaciers dominating the northeast-facing slopes of the LLM feed a few inland drainage basins, such as the XiYing river basin—this river is a tributary of the Shiyang River.
Figure 1. Geographic distribution of the Lenglongling Mountains.
Data
To study glacier elevation changes in the LLM during the periods 2000–2014 and 2014–2019, the X band (3.1 cm) and C band (5.6 cm) SRTM DEM were exploited, aided by Bi-static X band TerraSAR-X/TamDEM-X (TSX/TDX) images (). The void-filled SRTM-C DEM of 30 m resolution was downloaded from the United States Geological Survey (USGS) website (https://www.usgs.gov/); it was taken as glacier elevation on February 2000, and as the reference DEM in differential interferometry. The X band SRTM DEM of 30 m resolution was acquired from DLR (http://eoweb.dlr.de:8080/free_SRTM_X-band_data.html); it was compared with C band SRTM DEM to calculate the C band penetration depth into snow and ice.
Table 1. Specifications of TanDEM-X images used in the study.
TSX/TDX images can minimize temporal decorrelation on glacier surface. In the strip-map mode, they have a resolution of 2–3 m in azimuth and range, and a swath of 30 × 50 km. We acquired five scenes of co-registered Single Look Slant Range Complex; four images acquired around 2014 almost cover the study area. However, only one image in 2019 was applicable, and it covers the Gangshika peak and its surroundings. The effective baseline was 96–163 m. Considering similar acquisition seasons, the penetration depth differences between the two epochs of TanDEM-X DEM were waived. All TSX/TDX acquisitions and SRTM used in this study were observed in the winter, which can avoid seasonal fluctuation of glacier mass balance and/or penetration depth difference.
To discuss glacier area changes in this region, we downloaded two Landsat images of 30 m resolution from the USGS: one was Landsat 5 TM acquired on 14 August 2001; another was Landsat 8 OLI_TIRS acquired on 18 August 2014. They were orthorectified LIT (level 1 terrain corrected) products.
Temperature and precipitation were the two main factors controlling glacier change: annual precipitation determines glacier accumulation in a year, and mean temperature in summer controls glacier yearly ablation. We obtained climatological variables recorded at the Mengyuan Meteorological Station (37°23′, 101°37′, 2882 m) from the National Meteorological Information Center (http:/data.cma.cn), and analysed the variation trend of annual precipitation and mean summer temperature. Due to a lagged and superimposed response of glacier mass balance to temperature, data acquired time began at 1990.
Methods
Deriving glacier elevation change
We followed the D-InSAR approach () to derive glacier elevation changes during 2000–2014 (Zhang and Kang Citation2021). After removing the flat earth and topographic phase evaluated by SRTM DEM from TSX/TDX interferometry, the remaining comprised the topographic residual phase mainly were induced by glacier height changes. When assuming that no height changes occurred in the off-glacier area of the entire TSX/TDX coverage, the phase ramp can be removed by fitting the bi-linear polynomial value on off-glacier areas. We performed the D-InSAR operation iteratively to suppress the phase ramp. After the third iteration, the topographic residual phase was converted to height changes. We removed areas with strong distortions including foreshortening, layover, and shadow where the incidence angle of microwave was less than 18 degrees and greater than 72 degrees (Li and Lin Citation2017). We applied multi-look numbers of 4 and 5 to range and azimuth direction of TSX/TDX, respectively, and an oversample rate of 3 to the DEM (1 arc second). Therefore, the resolution of output geocoded height change maps was 0.33 arc second or ∼10 m. The result was modified with the consideration of penetration depths.
Figure 2. Methodology flow chart.
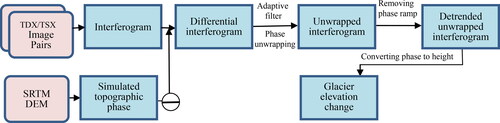
When deriving glacier elevation changes between 2014 and 2019, the TanDEM-X DEM of 2014 were regarded as the reference DEM when performing D-InSAR processing to the TSX/TDX acquisitions observed in 2019. An iterative D-InSAR also was applied. The multi-look numbers and oversample rate were the same as for the procedure of deriving glacier height changes between 2000 and 2014.
Evaluating penetration depth
Penetration differences between C- and X-band radar were estimated by comparing C- and X-band SRTM DEM as they were the only available datasets that observed simultaneously. The height systems were different for C- and X-band SRTM: the former was EGM96 geoid orthometric height; the latter, WGS-84 ellipsoidal height (Marschalk et al. Citation2004). This difference of geoidal surface was adjusted using data from online (UNAVCO Citation2021). Given that glacier height changes between 2014 and 2019 were derived by TanDEM-X DEM, no penetration depth correction has been performed. We binned the penetration depth in every 50 m elevation.
Accuracy estimations
The errors in glacier elevation changes include systematic and penetration depth errors. We assess systematic errors through elevation change in off-glaciers, and adopt the following EquationEqs. (1)(1)
(1) and Equation(2)
(2)
(2) to calculate the systematic error (Bolch et al. Citation2011):
(1)
(1)
(2)
(2)
where e refers to systematic error, SE refers to standard error, and MED stands for mean elevation difference between SRTM and TanDEM-X in off-glacier areas. The SE was determined based on the SD of elevation change (STDVno glac) and square root of the pixel number (n), both in off-glacier areas. The error of the penetration depth difference can be calculated using EquationEq. (3)
(3)
(3) (Li et al. Citation2018).
(3)
(3)
where
is the error of the penetration depth difference, (
) is the root mean square error (RMSE) of the penetration depth difference, and
is the number of effective measurements on glaciers.
is the RMSE of the penetration depth difference, and
is the number of effective measurements off-glaciers. A total error
was calculated using EquationEq. (4)
(4)
(4) .
(4)
(4)
Results and discussion
In the Qilian Mountains, the penetration depth difference between the C- and X-band radars in glacier ice was 1–2 m below the altitude of 4500 m, 2–3 m at altitudes of 4500–4650 m, and 3–3.5 m above the altitude of 4650 m. The region-wide average penetration depth difference was 3.1 m.
Considering the errors from the differencing between TSX/TDX and SRTM-C DEM, the MED is 0.02 m, STDVno glac is 2.27 m, autocorrelation distance is set to be 1000 m, n is 15 412, is 6.4 m, and
is 5 m; we obtain a systematic error of 0.03 m, the penetration depth difference error of 0.77 m, and total error of 0.8 m or 0.06 m year−1. When evaluating the error from two epochs of TSX/TDX SAR images, there are no the errors from penetration depth difference. In off-glacier areas, the MED was 0.39 m, SD of elevation change was 1.44 m, n was 316185, and total error was 0.47 m or 0.09 m year−1.
The glacier height changes map is presented by . Most parts of glacier coverage experienced rapid degradation. A small proportion in the accumulation area shows an increasing of height; the mean elevation of all glaciers decreased by (–0.64 ± 0.06) m year−1 during the period 2000–2014. Presuming ice density is (850 ± 60) kg m−3, the geodetic glacier mass balance was (–0.54 ± 0.06) m w.e. (water equivalent). From 2014 to 2019, the glacier height change for the Gangshika peak and surrounding region was (–0.68 ± 0.09) m year−1.
Figure 3. Map of glacier elevation change in the Lenglongling Mountains during 2000–2014. Maps (a) and (b) presented for glaciers in the western and eastern parts separately from the manual dividing line in .
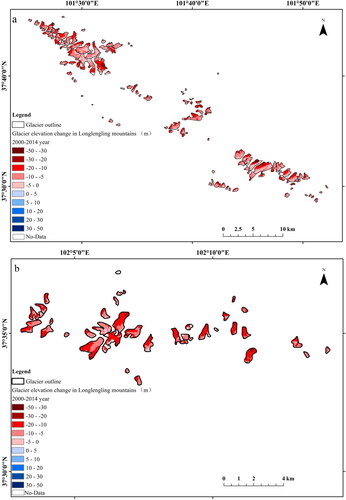
Figure 4. Map of glacier elevation changes in the Gangshika peak and its surroundings in Lenglongling Mountains during 2014–2019.
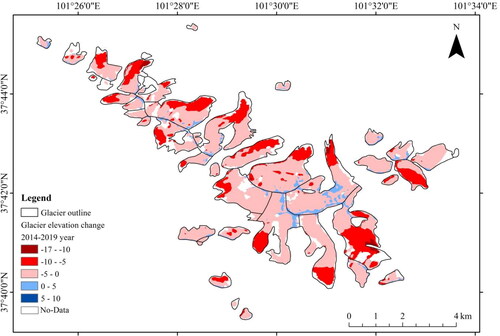
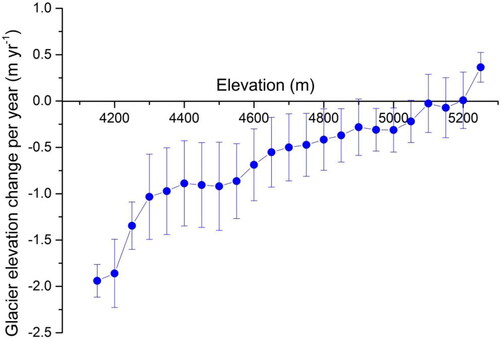
Glacier height changes were related to elevation. We subdivided glacier surface with an elevation bin of 50 m, and took average elevation change values of each bins as values in the bins and the SD error of elevation change as elevation change error. Glacier height change curves as a function of altitude interval are presented in . During 2000–2014 (), below ~4900 m, the glacier downwasting rates decreased nearly linearly with increasing elevation; between 4900 and 5200 m, the glacier height changes values were almost the same, except for the altitude of 5250 m. At 5250 m, glaciers exhibited a positive mass balance. During 2014–2019 (), the height change curve was similar to that during 2000–2014; positive mass balance also appeared at 5250 m.
Figure 5. Glacier elevation changes per year in the Lenglongling Mountains in each elevation bin of 50 m during 2000–2014.
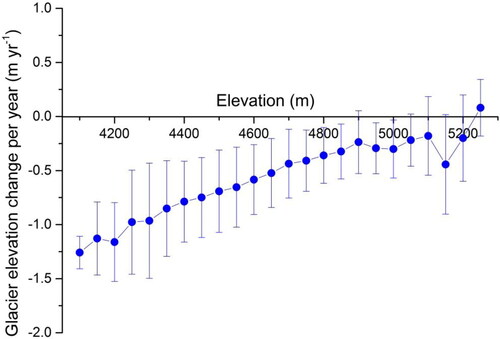
Figure 6. Glacier elevation changes per year in the Gangshika peak and its surroundings in the Lenglongling Mountains in each elevation bin of 50 m during 2014–2019.
Glacier elevation changes for Shuiguan Nos. 1–4 and Ningchan Nos. 1–4 and 6 are presented in , meanwhile, the flow line of these glaciers were displayed; nine glaciers experienced mass losses at the rate of −0.61 m year−1, which is identical to the values obtained by the RTK–GPS measurement during 1972–2010 (Cao et al. Citation2014). The Shuiguan No. 4 Glacier presented an average downwasting rate of −0.58 m year−1, which was similar to the RTK–GPS measured surface lowering rate of −0.56 m year−1 during 1972–2010 (Cao et al. Citation2014). Both the measuring approaches showed that the thinning value decreased with increase of altitude. On 6 August 2019, we investigated the Ningchan No. 3 Glacier surface elevation by RTK–GPS during a field expedition. We compared the measured values with values from STRM–C DEM on corresponding points, and calculated elevation changed during 2000–2019 for those points. We performed a linear–regression analysis between mean annual elevation change values from RTK–GPS and D-InSAR, and identified a strong correlation coefficient of 0.83 (). As presented in , the highest thinning rate of 0.76 m year−1 was recorded for Shuiguan No. 3 Glacier; however, its mean slope (22.4°) was the smallest among the five glaciers. The Ningchan No. 4 Glacier had an annual elevation change of 0.55 m year−1, which was the smallest; however, it had the largest mean slope (24.6°), which suggested a possible weak negative correlation between glacier elevation change and its slope (Cao et al. Citation2014).
Figure 7. Shuiguan and Ningchan glaciers’ elevation changes during 2000–2014.
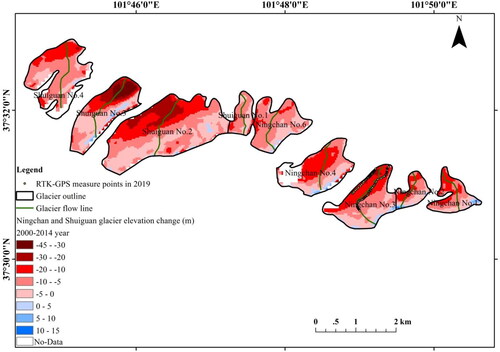
Figure 8. Comparison of the annual average elevation changes for the Ningchan No. 3 Glacier, calculated by the RTK–GPS and differential interferogram.
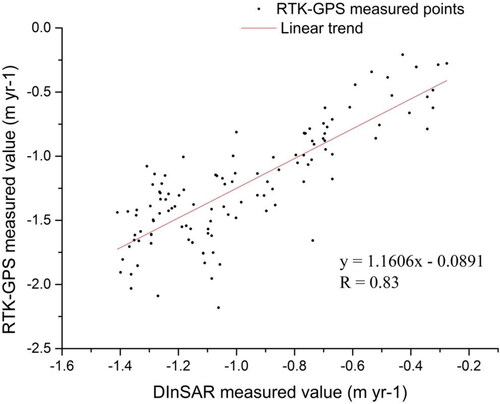
Table 2. Glaciers’ parameters and elevation changes in the Ningchan and Shuiguan rivers’ headwater.
For the locations of nine glaciers in the LLM, see .
Remote sensing observation revealed that glacier coverage in the LLM was 60.77 km2 in 2001 and 53.52 km2 in 2014, and glacier area declined by 13.5% during 2001–2014 and annual average loss rate was 1.04% year−1. Early studies show that glacier area in the LLM retreated by 0.98% year−1 (Cao et al. Citation2010), which is smaller than our results and represents an increase in glacier area loss rate in recent years. The glacier area in the Heihe Watershed in the middle Qilian Mountains decreased by 0.62% year−1 during 2000–2010, and that in the Daxue Mountains in the western Qilian Mountains decreased by 0.56% year−1 during 2000–2010. The glacier area in the east Qilian Mountains shows the largest rate of shrinkage—larger than in the middle and west parts; glacier area changes have a similar spatial heterogenous pattern with elevation change.
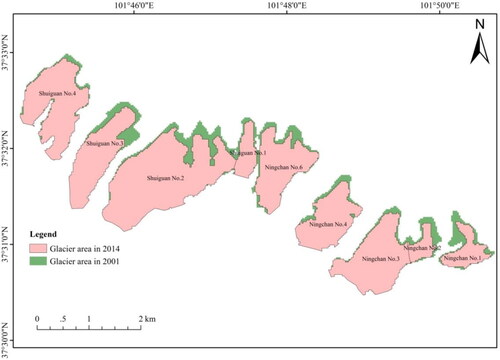
When examining the typical glacier area change shown in , the Ningchan Nos. 3–4 and Shuiguan Nos. 2–4 glacier area decreased by 5.2, 8.2, 8.2, 18.1, and 5.6%, respectively, during 2001–2014. The Shuiguan No. 3 Glacier area indicated the biggest declining rate; its elevation lowering rate was also the largest.
Figure 9. The typical glacier area change during 2001–2014 in Lenglongling Mountains.
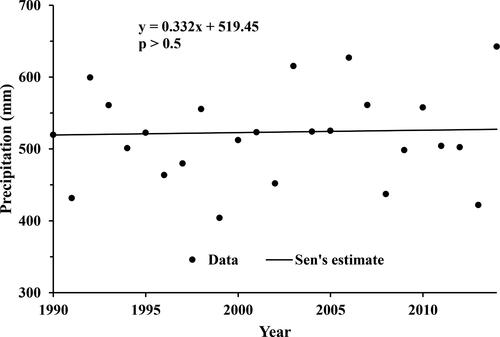
Based on the precipitation and temperature data from the Menyuan Meteorological Station, which was near the study area, we adopted the Mann–Kendall statistical approach (Mann Citation1945; Kendall Citation1975) and Sen’s slope estimator (Sen Citation1968) to analyse the climate change trends with the significance (). Temperature showed a consistent and remarkable increasing during 1990–2014: the increasing rate was 0.084 °C year−1 (p < 0.01); increasing temperature was the main factor of glacier height reduction. Precipitation in this area was dominated by the East Asian monsoon. Precipitation had a small fluctuating amplitude during 1990–2014; the annual precipitation registered a slight increase of 0.33 mm year−1 (p > 0.5), which cannot compensate the ice-loss induced by temperature rise. Each glacier had a difference value in elevation lowering, which reflects the accumulation and ablation conditions in different glacier catchment, maybe caused by glacier geomorphology such as slope, aspect, etc. and local meteorological variables.
Figure 10. Changing trend of mean summer temperature during 1990–2014 recorded at the Menyuan Meteorological Station in eastern Qilian Mountains.
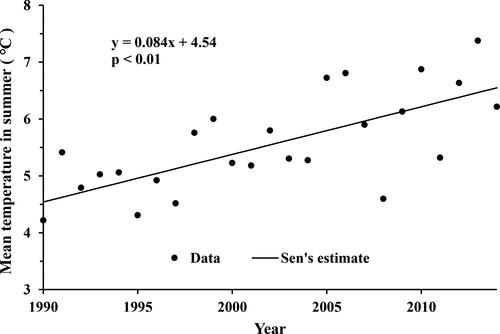
Figure 11. Changing trend of annual precipitation during 1990–2014 recorded at the Menyuan Meteorological Station in eastern Qilian Mountains.
The glaciers of the Daxue Mountains (including Laohugou No. 12 Glacier) in the west Qilian Mountains thinned at the rate of (–0.20 ± 0.07) m w.e. year−1 (Sun et al. Citation2018). Climate data of this area showed an increasing trend for temperature since the 1950s, although precipitation too had a slight increase. The mass balance of the Qiyi Glacier in the middle Qilian Mountains during 2005–2010 was −0.50 m w.e. year−1 (Yao et al. Citation2012). The snow line altitude slightly increased during 1990–2010, and summer temperature and annual precipitation show an increasing trend (Guo et al. Citation2015). Precipitation had no obvious change trend in the east Qilian Mountains during 1990–2014; temperature had a prominent increasing trend, leading to glacier elevation change at the rate of (–0.54 ± 0.06) m w.e. year−1; and elevation thinned at (0.52 ± 0.06) m w.e. year−1 for the nine glaciers in the Ningchan and Shuiguan rivers’ catchments. The thinning rate of the Laohugou No. 12 Glacier in the west Qilian Mountains was smaller than that of the Qiyi Glacier in the middle Qilian Mountains, and Qiyi Glacier’s retreat rate was smaller than those of glaciers in the Ningchan and Shuiguan rivers’ catchments. The Menyuan Meterological Station (east Qilian Mountains) recorded annual mean temperature increase rate of 0.084 °C year−1 during 1990–2014. The Yeniugou, Tuole, Qilian, and Sunan Meterological Stations (middle Qilian Mountains) recorded annual mean temperature increase rate 0.065 °C year−1 during 1990–2010 (Bie et al. Citation2013); 0.037 °C year−1 was recorded in the Laohugou Watershed (west Qilian Mountains) during 1957–2013 (Qin et al. Citation2015). Temperature increase rate in the eastern part was greater than that in the middle and western parts. The annual precipitation increase rate was 0.33 mm year−1 in the eastern part (Mengyuan Meterological Station records), 1.26 mm year−1 in the middle part (the Heihe Watershed records) (Wang et al. Citation2011), and 1.22 mm year−1 in the western part (the Subei Meteorological Station records) (Wang et al. Citation2016). The spatial difference of temperature and precipitation responsible for glacier recession rate in the eastern part was bigger than that in the middle and western parts.
The patterns of glacier height changes were almost identical before and after 2014; the iterative D-InSAR with the TerraSAR-X/TanDEM-X images can provide geodetic glacier mass balance information at sub-decadal and decadal scales.
Conclusions
In this study, TerraSAR-X/TanDEM-X images of high resolution and iteratively D-InSAR were used to calculate glacier elevation change in the LLM at the decadal and sub-decadal timescales. The results showed that glaciers thinned by (–0.64 ± 0.06) m year−1 during 2000–2014 in the whole LLM and (–0.68 ± 0.09) m year−1 during 2014–2019 for the Gangshika peak and its surroundings. With increase in elevation, the lowering value of elevation decreased, and glacier elevation increased at the elevation bin of 5250 m. To validate the above results, we carried on a field expedition to Nichan No.3 Glacier using RTK–GPS; the value of annual average elevation change from field measurements have a strong relationship with values from D-InSAR at the corresponding points, and a correlation coefficient of 0.83 was found between them. Glacier thinning values have weak relationships with the mean slope. Glacier area decreased by 13.5% during 2001–2014; the average annual decreasing rate was 1.04% year−1, which is greater than that in the middle and west parts. The heterogeneity of area change was consistent with that of elevation change. Climate data in this area revealed that since 1990, precipitation showed no obvious change, temperature displayed a continuous and pronounced increase, glacier recession has mainly been driven by climate change, and glacier downwasting rate in the LLM (east Qilian Mountains) was greater than that in the middle and west Qilian Mountains.
Acknowledgments
The TerraSAR-X/TanDEM-X data were obtained under a proposal submitted to the German Aerospace Centre (DLR) named Glacier Elevation Change in the Pamirs and Tibet Plateau (proposal ID:NTI_BIST3395).
Disclosure statement
No potential conflict of interest was reported by the authors.
Additional information
Funding
References
- Bhattacharya A, Bolch T, Mukherjee K, King O, Menounos B, Kapitsa V, Neckel N, Yang W, Yao T. 2021. High Mountain Asian glacier response to climate revealed by multi-temporal satellite observations since the 1960s. Nat Commun. 12(1):4133.
- Bie Q, Qiang W, Wang C, He L, Zhao C. 2013. Monitoring the glacier variation in the upper reaches of the Heihe River based on remote sensing in 1960–2010. J Glaciol Geocryol. 35(3):574–582 (in Chinese).
- Bolch T, Pieczonka T, Benn DI. 2011. Multi-decadal mass loss of glaciers in the Everest area (Nepal Himalaya) derived from stereo imagery. Cryosphere. 5(2):349–358.
- Braun MH, Malz P, Sommer C, Farías-Barahona D, Sauter T, Casassa G, Soruco A, Skvarca P, Seehaus TC. 2019. Constraining glacier elevation and mass changes in South America. Nat Clim Change. 9(2):130–136.
- Brun F, Berthier E, Wagnon P, Kääb A, Treichler DA. 2017. A spatially resolved estimate of High Mountain Asia glacier mass balances from 2000 to 2016. Nat Geosci. 10(9):668–673.
- Cao B, Pan B, Gao H, Jiang S, Wen Y, Shangguan D. 2010. Glacier variation in the Lenglongling range of Eastern Qilian Mountains from 1972 to 2007. J Glaciol Geocryol. 32(2):242–248 (in Chinese).
- Cao B, Pan B, Wen Z, Guan W, Li K. 2019. Changes in glacier mass in the Lenglongling Mountains from 1972 to 2016 based on remote sensing data and modeling. J Hydrol. 578:124010.
- Cao B, Pan BT, Cai MY, Wang J. 2017. An investigation on changes in glacier mass balance and hypsometry for a small mountainous glacier in the northeastern Tibetan plateau. J Mt Sci. 14(8):1624–1632.
- Cao B, Pan BT, Guan WJ, Wang J, Wen ZL. 2017. Changes in ice volume of the Ningchan No.1 Glacier, China, from 1972 to 2014, as derived from in situ measurements. J Glaciol. 63(242):1025–1033.
- Cao B, Pan BT, Wang J, Shangguan DH, Wen ZL, Qi WT, Cui H, Lu YY. 2014. Changes in the glacier extent and surface elevation along the Ningchan and Shuiguan river source, eastern Qilian Mountains, China. Quat Res. 81(3):531–537.
- Cao B, Guan WJ, Li KJ, Pan BT, Sun XD. 2021. High-resolution monitoring of glacier mass balance and dynamics with unmanned aerial vehicles on the Ningchan No. 1 glacier in the Qilian Mountains, China. Remote Sens. 13(14):2735.
- Dehecq A, Gourmelen N, Gardner AS, Brun F, Goldberg D, Nienow PW, Berthier E, Vincent C, Wagnon P, Trouvé E. 2019. Twenty-first century glacier slowdown driven by mass loss in High Mountain Asia. Nat Geosci. 12(1):22–27.
- Gardner AS, Moholdt G, Cogley JG, Bert W, Anthony AA, Wahr J, Berthier E, Hock R, Pfeffer WT, Kaser G, et al. 2013. A reconciled estimate of glacier contributions to sea level rise: 2003 to 2009. Science. 340(6134):852–857.
- Guo ZM, Wang NL, Wu HB, Wu YW, Wu XJ, Li QL. 2015. Variations in Firn line altitude and Firn zone area on Qiyi Glacier, Qilian Mountains, over the period of 1990 to 2011. Arctic Antarc Alpine Res. 47(2):293–300.
- Kendall SB. 1975. Enhancement of conditioned reinforcement by uncertainty. J Exp Anal Behav. 24(3):311–314.
- Li G, Li Y, Lin H, Ye Q, Jiang L. 2021. Two periods of geodetic glacier mass balance at Eastern Nyainqentanglha derived from multi-platform bistatic SAR interferometry. Int J Appl Earth Obs Geoinform. 104:102541.
- Li G, Lin H. 2017. Recent decadal glacier mass balances over the Western Nyainqentanglha Mountains and the increase in their melting contribution to NamCo Lake measured by differential bistatic SAR interferometry. Glob Planet Change. 149:177–190.
- Li G, Lin H, Ye QH. 2018. Heterogeneous decadal glacier downwasting at the Mt. Everest (Qomolangma) from 2000 to ~2012 based on multi-baseline bistatic SAR interferometry. Remote Sens Environ. 206:336–349.
- Li J, Liu SY, Shangguan DH, Zhang YS. 2010. Identification of ice elevation change of the Shuiguan River No. 4 glacier in the Qilian Mountains, China. J Mt Sci. 7(4):375–379.
- Liu S, Yao X, Guo W, Xu J, Shangguan D, Wei J, Bao W, Wu L. 2015. The contemporary glaciers in China based on the Second Chinese Glacier Inventory. Acta Geogr Sin. 70(1):3–16 (in Chinese).
- Mann HB. 1945. Nonparametric tests against trend. Econometrica. 13(3):245–259.
- Marschalk U, Roth A, Eineder M, Suchandt S. 2004. Comparison of DEMs derived from SRTM/X-and C-Band. IEEE Int Geosci Remote Sens Symp. 7:4531–4534.
- Pan B, Cao B, Guan W. 2021. Changes of Ningchan no. 1 glacier in Lenglongling, Eastern Qilian Mountains from 2010 to 2020 based on observation. J Glaciol Geocryol. 43(3):864–873 (in Chinese with English Abstract).
- Qin X, Chen J, Wang S, Sun W, Du W, Liu Y. 2015. Reconstruction of surface air temperature in a glaciated region in the Western Qilian Mountains, Tibetan plateau, 1957–2013 and its variation characteristics. Quat Int. 371:22–30.
- Sen PK. 1968. Estimates of the regression coefficient based on Kendall’s tau. J Am Stat Assoc. 63(324):1379–1389.
- Sun Y, Jiang L, Liu L, Sun Q, Wang H, Hsu H. 2018. Mapping glacier elevations and their changes in the western Qilian Mountains, Northern Tibetan plateau, by bistatic InSAR. IEEE J Sel Top Appl Earth Obs Remote Sens. 11(1):68–78.
- Tian H, Yang T, Liu Q. 2012. Climate change and glacier retreat in Ganggexiaoheli, middle Qilian Mountains using remote sensing data, 1976–2010. J Arid Land Resour Environ. 26(7):41–46 (in Chinese).
- UNAVCO 2021. http://www.unavco.org/community_science/science-support/geoid/geoid.html.
- Wang P, Li Z, Gao W, Yan D, Bai J, Li K, Wang L. 2011. Glacier changes in the Heihe river basin over the past 50 years in the context of climate change. Resour Sci. 33(3):41–46 (in Chinese).
- Wang P, Li Z, Yu G, Li H, Wang W, Huai B, Zhou P, Jin S, Wang L, Zhang H. 2016. Glacier shrinkage in the Daxue and Danghenan ranges of the Western Qilian Mountains, China, from 1957 to 2010. Environ Earth Sci. 75:127.
- Wei J, Liu S, Wang X, Zhang Y, Jiang Z, Wu K, Zhang Z, Zhang T. 2021. Longbasaba Glacier recession and contribution to its proglacial lake volume between 1988 and 2018. J Glaciol. 67(263):473–484.
- Yao T, Thompson L, Yang W, Yu W, Gao Y, Guo X, Yang X, Duan K, Zhao H, Xu B, et al. 2012. Different glacier status with atmospheric circulations in Tibetan plateau and surroundings. Nature Clim Change. 2(9):663–667.
- Yue X, Li Z, Zhao J, Li H, Wang P, Wang L. 2021. Changes in the end-of-summer snow line altitude of summer-accumulation-type glaciers in the Eastern Tien Shan Mountains from 1994 to 2016. Remote Sens. 13(6):1080.
- Zhang Q, Kang S. 2021. Glacier elevation change in the Western Qilian Mountains as observed by TerraSAR-X/TanDEM-X images. Geocarto Int. 36(12):1365–1377.