
Abstract
Glacial ice contains information on paleoclimate, but typically is less than 1 Myrs old because glaciers continuously flow and melt. A recently discovered buried ice mass in Antarctica is dated to 3-5 Myrs and highlights the potential for long preservation of ancient ice under a layer of debris. Only two such ice masses are so far known in Antarctica. Given the significant scientific potential and lack of systematic mapping, we set out to locate all buried ice masses in Transantarctic Mountains (TAM). We visually analyzed >8,000 high-resolution satellite images covering much of the TAM. We searched for the polygonal patterned ground that signifies ice in the ground and once detected the corresponding digital elevation model was inspected for presence of a convex landform. When both features coincide, they indicate the presence of a buried ice body. We identified 22 new sites that are likely to conceal massive buried ice masses.
1. Introduction and motivation
Buried ice masses, such as rock glaciers or debris covered glaciers are known to exist and have been documented on major mountain ranges across the globe (Hassinger and Mayewski Citation1983; Martin and Whalley Citation1987; Clark et al. Citation1998). In the alpine setting, they are typically formed by rockfalls directly on the existing glacier or by enrichment of englacial debris on the surface by melting of the debris rich ice in the ablation area. It has been well documented that a thin layer of dirt would enhance the melting of the glacier ice, although recent research by Muhammad et al. (Citation2020) contradicts this in the lower altitudes. However, a debris layer thicker than a few cm would protect the ice from melting (Swithinbank Citation1950). The actual thickness separating these opposite effects has been determined to be between 10 and 25 mm (Ashwell and Hannell Citation1966), whereas Ostrem (Citation1959) showed that once the debris layer was thicker than about 1 cm it hindered the melting and up to ∼30 cm debris-thickness the melting-rate of the underlying ice decreased monotonically (the maximum dirt depth of the experiment was ∼30 cm).
Number of researchers have mapped rock glaciers in the field (e.g. Capps Citation1910; Ray Citation1940), and by remotely-sensed data (areal photos and existing maps) (e.g. Humlum Citation1988), and with various remote sensing algorithms (typically developed for a given region) (Jason Citation2001; Brenning Citation2009) and by combining remote sensing analyses with field verification (Rangecroft et al. Citation2014).
In Antarctica, in the Dry Valleys region 32 mainly small rock glaciers were mapped and have been described by Hassinger and Mayewski (Citation1983). However, most of these small rock glaciers located at the lower parts of the Wright and Taylor Valleys postdate the local marine high stand at LGM and thus are likely <∼20 ka old. Only two large and old buried ice bodies have been studied in detail in Antarctica, one located in Beacon Valley in Dry Valleys region (Sugden et al. Citation1995; Schafer et al. Citation2000; Marchant et al. Citation2002) and the other in Ong Valley in Miller Range (Bibby et al. Citation2016; Bergelin et al. Citation2022; ). Both of these buried ice masses occupy an alpine valley that was filled by an inflowing lobe of the continental ice sheet during its high stand. Specifically, this applies to the lower parts of Beacon Valley ice and all of the Ong Valley ice (). The debris covering these ice masses today is generally understood to have accumulated over a long period of time, when the originally thicker ice masses stagnated and sublimated in place and slowly exhuming englacial debris at the surface which led to an accumulation of a layer of debris that is ∼0.6 meters thick today (Bibby et al. Citation2016; Bergelin et al. Citation2022).
Figure 1. Example of debris-covered valley with permafrost polygons, they are seen as the brown debris mounds with the white snow/ice around circling them next to each other, circled in orange is an example of one of these polygons.
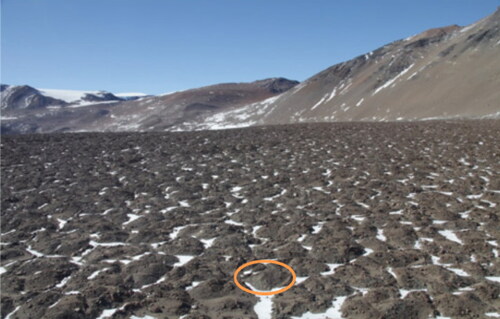
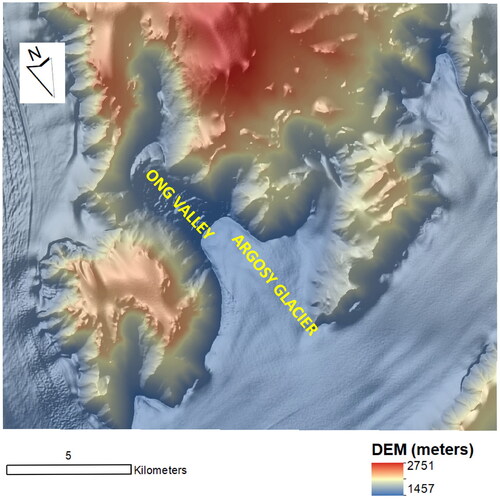
Figure 2. Digital Elevation Model (DEM) (1 m resolution) of the Ong Valley. The Argosy Glacier is labelled at the SE of the Ong Valley.
Prior research has shown that buried ice masses in Antarctica can harbor some of the oldest ice on Earth (Schafer et al. Citation2000; Bibby et al. Citation2016; Bergelin et al. Citation2022). Although, they don’t contain a continuous series of annual ice layers from today to the oldest age like the glaciers do that are still actively being formed today. However, they are still valuable repositories of paleo-climate proxies from the period of time that little is known about.
To date, no systematic effort has been made to map the buried ice bodies in the southern Transantarctic Mountains. Given that rock glaciers are found on most of the world’s major mountain chains and in Arctic, and that this far only one large buried ice mass has been documented outside of the Dry Valleys region there is a high likelihood that more buried ice bodies are to be found in Antarctica. Our mapping effort is motivated by the significant scientific value that such potentially ancient ice bodies may hold. For these reasons we set out to map all buried large ice bodies in the Transantarctic Mountains (TAM) between Northern Victoria Land and Pensacola Mountains (). We conducted our search by visually inspecting satellite imagery for the patterned ground landforms on valley floors that signify subsurface ice. Once we found the patterned ground we used a digital elevation model of the terrain to see if the patterned ground was on the surface of a convex landform that by itself may signify buried massive ice. Once the site satisfied both of these criteria we determined that the site contained massive buried ice.
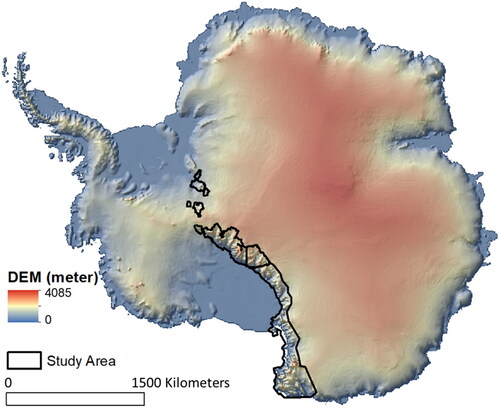
Figure 3. Locations of the Transarctic mountains (study area, black polygons) in the Antarctica. The background colored map (blue to red) is the Digital Elevation Model (DEM) with hillshade on top (70% transparency) at 7900 m resolution.
2. The origin of massive buried ice bodies in Antarctica
Rock glaciers and debris covered glaciers often form either by direct rockslides from adjacent rocky slopes on top of an active glacier which becomes buried and thermally insulated from atmosphere and direct insolation, or they form by freezing of the surface or groundwater that inundates talus slopes or other accumulations of rock debris (Clark et al. Citation1998). In Antarctica, much of the continental ice sheet and the glaciers contain minimal to non-existent supraglacial debris due to the lack of source slopes for rock falls. Exceptions to this are the few known buried massive ice bodies - such as is found in lower Beacon Valley under the Granite drift - which is thought to be a remnant of a stagnant glacier ice that has slowly sublimated over long periods of time (Schafer et al. Citation2000).
The debris today covering the buried ice masses in Antarctica originates from underneath the ice, as subglacial debris becomes encased in overriding ice. As the ice deforms and transits across the terrain it entraps the regolith from the bed, which then becomes englacial debris. When the glacier flows into a dead-end valley and stagnates, it will start to sublimate. While the ice surface is slowly wasted away, the englacial mineral matter (suspended in the ice) is slowly exhumed at the ice surface (Bibby et al. Citation2016; Bergelin et al. Citation2022). As this process continues, the debris layer at the surface grows thicker, begins to shield and thermally insulate the ice, and restricts the vapor loss from the underlying ice (Putkonen et al. Citation2003; Hagedorn et al. Citation2007; Hagedorn et al. Citation2010; Liu et al. Citation2015). The increased shielding and possible recharge events are the main reasons why the ancient glacier ice may have survived in Beacon Valley for 0.5-8 Myrs and 4-5 Myrs in Ong Valley (Sugden et al. Citation1995; Schafer et al. Citation2000; Bibby et al. Citation2016; Bergelin et al. Citation2022). Commonly, the debris layer above the glacier ice is capped by a desert pavement, indicating that this debris has eroded at least to some extent. Thinning of the debris cover due to erosion allows for sublimation of the underlying ice to continue, and perhaps a balance is achieved between the long-term regolith erosion and ice sublimation rates (Bibby et al. Citation2016; Bergelin et al. Citation2022).
Although all of the above processes and scenarios can and do take place elsewhere on Earth, the environmental conditions in Antarctica are unique as it is a cold desert. No consistently running water or rain is observed today, and therefore the active layer (the surficial layer of the ground that annually fluctuates from below freezing to above freezing temperatures) of the permafrost in the summer is dry, thin, and is a thermally good insulator unlike the active layer that is found in the Arctic that is typically wet in the summer and an effective thermal conductor (Putkonen & Roe Citation2003; Hallet et al. Citation2004). This further helps to retain the buried ice under the dry and thermally insulating layer of regolith in Antarctica.
3. Methods
Remote sensing methods have been previously employed to study the changes in the spatial coverage of the debris on the previously mapped glaciers by Herreid and Pellicciotti (Citation2020). Their remote sensing study covered all of the Earth’s land area except Antarctica. Although widely studied in mid-latitudes and Arctic, the field research on buried ice bodies in Antarctica has been limited due to the historical lack of high-resolution remote sensing data and overall inaccessibility that has limited the number and scope of field studies.
Recently, new remote sensing imagery of Antarctica has become available (PGC Citation2018a). The imagery has variable spatial and spectral resolution depending on the sensors. The available DEM coverage has a nominal spatial resolution of 1 m (Polar Geospatial Center, REMA viewer).
In the following sections, we describe the new datasets (Satellite imagery, Digital Elevation Model) and our new method to detect buried ice in our field area by using remotely sensed data combined with ground truthing at known buried massive ice sites.
3.1. Satellite imagery
The satellite imagery used in this research was accessed through PGC. The main platform for the imagery was DigitalGlobe constellation that includes satellites and sensors such as GeoEye-1 (450-920nm), IKONOS (400-820nm), WorldView-1 (400-900nm), WorldView-2 (400-1040nm), WorldView-3 (397-2245nm), WorldView-4 (450-920nm), and Quickbird 2 (452-1053nm) (PGC Citation2018a). For collection purposes, PGC has used WorldView-1, Worldview-2, and World-View-3 from 1999 until the present, and various images from GeoEye-1 from 2009-2017, most of which were collected in 2015-2016 during the Austral summer season (PGC Citation2018a).
The main product that was used for our analyses was the high-resolution multispectral imagery (based on several sensors mentioned above) that have sub-meter resolution (0.32-0.5 m), which allows for visual detection of the permafrost polygons on valley floors that have no exposed glacier ice.
The total number of the multispectral images used in this study was 8,632 covering 3.4 million km2. These images were collected during 2003-2019 with various overlapping sections to limit obstruction from snow and cloud cover. The multispectral imagery contains bands 1-8 (380-2,290 nm). A second set of imagery contained 1,053 mosaicked, cloud-free satellite images with Bands 1-4 (380-700 nm).
3.2. Digital elevation model (DEM)
Our study utilized the Reference Elevation Model of Antarctica (REMA) available through PGC (https://livingatlas2.arcgis.com/antarcticdemexplorer/). These data are extracted from Digital Globe satellite imagery at a sub-meter resolution. Satellite altimetry measurements from Cryosat-2 and ICESat were used to vertically register each DEM in the database with less than one meter of uncertainty (PGC Citation2018a). REMA covers approximately 98% of the Antarctic surface; however, there are missing data near South Pole (PGC Citation2018a). Retrieved DEM consists of mosaic tiles that have been altered to lessen edge artifacts by co-registering DEM tiles, blending, and feathering for accurate extraction of a given area from the database.
3.3. Methodology for detecting buried ice
We developed a novel method (a set of search criteria) to determine if a given TAM valley has buried ice using high-resolution multispectral optical satellite imagery, high-resolution Digital Elevation Model (DEM) and existing field data from the Ong Valley.
We apply the following search criteria to each snow free valley:
Criterion #1. Presence or absence of patterned ground polygons in multi-spectral imagery (Bockheim et al. Citation2009)(). The patterned ground polygons indicate the presence of ice either currently or in the past. The polygons may develop either over a body of massive ice (such as has been documented in the mid-section of Ong Valley), or they form because of the presence of interstitial ice (the ice filling the pore spaces in regolith), or the polygons are simply inactive remnants, where all the former ice has already been sublimated. To distinguish between those cases, and positively confirm the presence of the massive ice, we then apply the second search criterion.
Criterion #2. The glacially carved valleys such as are found in TAM and other formerly or currently glaciated areas of the Earth have conspicuous U-shaped cross profiles (Harbor et al. Citation1988)(, panel f and h). The U-shaped cross-profile comes to full view only after the deglaciation, and due to the low rate of regolith transport on hillslopes the exposed valley floors collect only small amount of sediment even over million-year exposure (Putkonen et al. Citation2008; Putkonen et al. Citation2008). Therefore, if the valley still harbors ice (either exposed or buried) the bedrock cross-profile will have a distinct convex bulge in the part that otherwise would be the lowest part of the cross-section (, panel f and g). For these reasons, a convex or flat section in the middle of the valley signifies fulfillment of criterion #2. This can be tested by making valley cross-profiles from high-resolution (1-m) DEM.
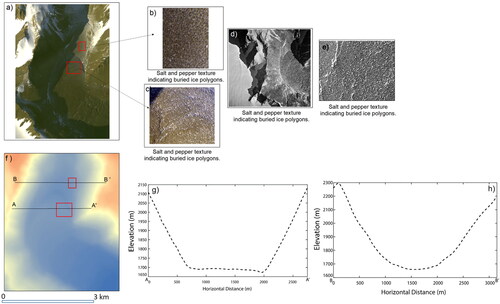
Figure 4. Demonstration of the buried-ice and ice free area detection in the Ong Valley: a) high-resolution satellite imagery of the Ong Valley (false color RGB composite of band 4 (NIR), band 3 (R) and band 1 (B), b) a subset of Fig. 4a showing salt and pepper texture (upper box in Fig. 4a), c) a subset of Fig. 4a showing salt and pepper (lower box in Fig. 4a.), d) a high resolution digital areal photo by USGS, e) a subset of Fig. 4d showing salt and pepper texture, f) DEM (1 m resolution) of the Ong valley, g) an elevation profile along AA’ line shown in Fig. 4f, and h) an elevation profile along BB’ line shown in Fig. 4f.
Therefore, if a valley has patterned ground polygons (Criterion 1) and a convex or flat profile in the middle of the U-shaped valley cross profile (Criterion 2), we hypothesize that the valley contains a buried ice mass.
These two criteria were applied and tested in two TAM valleys known to harbor large amount of buried ice based on previous field expeditions (Beacon Valley and Ong Valley). Both valleys have well-developed patterned ground polygons and distinct convex or flat cross-sectional profiles. However, the upper section of the Ong valley fails to satisfy criterion 2 despite satisfying criterion 1 thus, indicating that no buried ice exists in upper part of the Ong Valley (verified by the field excavations). Upon the successful testing of the criteria #1 and #2 in identifying known buried massive ice sites, we applied the same search criteria to the other valleys in the entire TAM.
Once the valleys that likely contain buried ice were located, we analyzed two additional geomorphic attributes related to each valley to gain further insights into the possible physical reasons why some valleys harbor ice today and some are ice-free. These variables were the aspect of the given valley and the elevation of ice mass above the sea level.
Even though our analysis revealed 22 previously unknown sites with geomorphic and topographic features indicating the potential for containing buried ice, the absolute proof requires a field visit and excavation through the debris cover which is beyond this project. However, our findings have a general interest in determining the prevalence of buried ice bodies in TAM. Our results are of particular scientific interest as they are essential in locating possible new ancient ice masses that may harbor some of the oldest ice on Earth. This is the first study to apply field-based criteria combined with remote sensing tools to map buried ice masses in Antarctica.
3.3.1. Remote sensing of buried ice bodies
Based on our prior research on buried ice bodies in Antarctica, we developed the following criteria to search them with remote sensing methods. We visually analyzed >8000 high resolution satellite images covering the Transantarctic Mountains from Victoria Land to Pensacola Mountains (a distance along the TAM of ∼3000 km) (Shanks Citation2021). The imagery came from the Digital globe constellation that includes several satellites and sensors.
To determine the prevalence of buried ice bodies in TAM we used multispectral imagery that has a sub-meter resolution (0.32-0.5 m) which allowed for permafrost polygon detection (salt-pepper texture) () . Satellite imagery using the false color composite of band 4 (NIR), band 3 (Red) and band 1 (Blue) were used for final visual inspection.
On those images we inspected the exposed land areas for polygonal patterned ground which is known to occur only when regolith either covers ice or the regolith is cemented by ice (ice cementation refers to the regolith that contains interstitial ice, but not necessarily massive ice). Permafrost polygons are formed by thermally induced expansion and contraction of the ice and regolith which causes cracking in the frozen, ice cemented soil and induces the formation of patterned ground in the overlying regolith (Bockheim et al. Citation2009)(). Once we discovered the polygonal surface pattern the corresponding Reference Elevation Model for Antarctica (REMA), a digital elevation model, was inspected. The DEM was used to determine if the patterned ground covers a massive ice body or if it is formed on ice cemented soil.
When a massive ice body is present in a U-shaped glacial valley it forms a conspicuous convex or flat shape on the bottom of the otherwise U-shaped valley cross profile (). In other words, it appears as a flat or bulging landform in the valley floor. Based on our experiences with other buried ice bodies and ice cemented soil in Antarctica, and Arctic, we have never encountered a landform having both of those characteristics and not be hiding buried massive ice. Based on the above listed analyses, we identified 24 individual field sites that all fill both the above-mentioned criteria.
3.3.2. Testing method in Ong valley
Ong Valley is a known location of a buried ice mass that has been verified through fieldwork, and the age of the ice has been determined through cosmogenic exposure dating (Bibby et al. Citation2016; Bergelin et al. Citation2022). Because the valley has been well-characterized, it was used as the basis for ground truthing for this study. Features of Ong valley were assessed in order to determine the best key attributes for further buried ice exploration throughout the TAM:
Visual observation of images
Use of sub-meter resolution imagery containing three spectral bands (NIR, Red and Blue) (e.g. ) and high resolution digital aerial photos by USGS (e.g. ).
detection of permafrost patterned ground polygons (5-10 m diameter) ( and )
Examination of glacial valley floor (bulges)convex topography ()
Possible presence of lateral and end moraines ()
Extraction of Digital Elevation Model (DEM) data from the Reference Elevation Model of Antarctica (REMA) for further analysis with 2-meter spatial resolution ().
Differentiation between buried ice and ice-free valleys required both visual and DEM analyses. Therefore, the combination of visual analysis of satellite imagery, and extraction of DEM data (followed by associated spatial analyses in ArcGIS), was deemed to be the best overall method for detecting potential buried ice sites. We went through the same exercise with all the valleys throughout TAM to detect valleys potentially containing buried ice. In the following section we demonstrate the selection of lines for topographic profiles.
3.3.3. Profile development
The DEMs used for our study were taken from the REMA database, with a total of 47 individual sites collected. The DEM had Antarctica Polar Stereograph projection, with sub-meter to 8-meter resolution. This resolution was required for accurate visualization of topographic attributes (convex valley floor cross profile). However, 12 sites required DEM strips (2-meter resolution) requested from PGC to cover the missing area around the South Pole (PGC Citation2018b).
The extracted DEM were then placed in the ArcGIS database with the satellite imagery for further analysis. Topography is indistinguishable from DEM in ArcGIS; therefore, modification of the DEM was required. DEM was then converted to a Hillshade model using the 3 D Analyst toolbox for clear visual interpretation of valley topography. Hillshade is a 3 D surface representation using relative sun position for shading (Environmental Systems Research Institute - ESRI) (ESRI, 2011). The Hillshade tool allowed for the most accurate manual profile placement to extract the valley cross-profiles.
Interpolation of profiles was executed using ArcGIS 3 D Analyst, using the interpolate line tool to make profile graphs. Secondary profiles were taken perpendicular (cross sections of the valley) to the original profile of convex topography mid-valley.
3.4. Elevation and aspect of the valleys
Within the study area, we analysed all the valleys for aspect and elevation. The aspect of the valley is defined as the general downhill compass direction of the main floor of the valley immediately up valley from the valley mouth. Therefore, an elongated and straight valley that slopes down towards North, and has the valley mouth at the lower end, is said to have a northern aspect. The aspects were measured and recorded at the ArcGIS platform. The elevation of a given valley was measured in the ArcGIS and determined at the highest elevation of the detected buried ice.
4. Results
We located 47 snow free, debris covered valleys in our field area by visually inspecting valleys from the high-resolution satellite imagery. These valleys were further studied to determine the presence of potential buried ice by analysing the transverse profiles of the valleys ( and ). The analyses revealed 24 potential buried ice masses and 23 valleys that were found to be ice free ().
Figure 5. An example showing the impacts of azimuth angles (North facing vs West facing) on the occurrence on buried-ice and ice-free valley. Top panel shows the buried ice occurrence in a west facing valley using satellite image (a), 1 m resolution DEM (b) and elevation-profile along AA’ line (c) while the bottom panel shows the ice-free ares in a north facing valley using satellite image (d), 1 m resolution DEM (e) and elevation-profile along AA’ line (f).
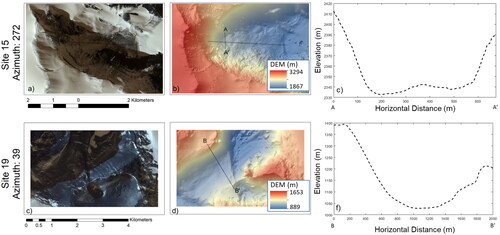
Figure 6. Locations of the detected buried ice sites: (A) Locations of the Transarctic Mountains, (B) Locations of detected potential buried ice sites using the methods demonstrated in and are shown in black triangles within the Transarctic Mountains.
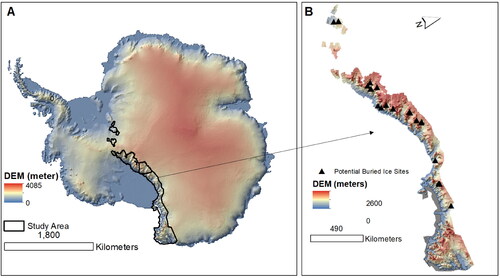
The sites that we identified to potentially contain buried ice also include the two known buried ice sites, Ong Valley and Beacon Valley. Using the USGS maps (USGS, 2020), names for all sites were associated and are shown in .
Table 1. Sites with potential buried ice, including two previously known sites: Beacon Valley and Ong Valley.
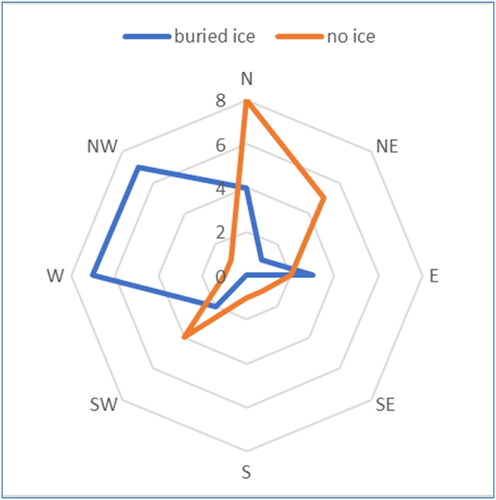
shows the aspects for all of the 47 valleys in the study area. Eighty-seven point two percent of the aspects fall between Southwest and Northeast heading with an average aspect for all valleys of 335 degrees (NNW heading). shows a rose diagram of the aspects of the ice-free valleys and separately for the valleys with potential buried ice. The single largest group of ice-free valleys are found on a Northern heading, while the valleys with potential buried ice are predominantly found on Western or Northwestern heading.
Figure 7. Aspects of all the valleys that were studied.
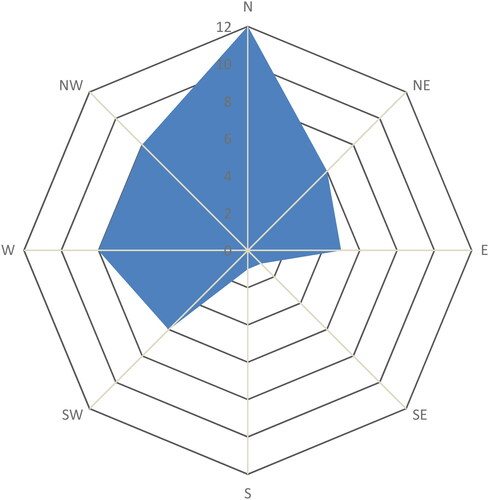
Figure 8. Aspects of the valleys that are ice free and valleys that potentially contain buried ice.
The relation between valley aspect and the elevation of the valley shows a weak correlation (r2 = 0.24). Low altitude valleys (<500 masl) are slightly more likely to have a Northeastern heading, and the high-altitude valleys (∼2,000 masl) are slightly more likely to have a Northwestern heading. It is also noted that the low altitude valleys (<500 masl) are all ice free.
5. Discussion
After developing the methodology to locate the sites that potentially harbor buried ice bodies in Antarctica we analysed the imagery and DEM covering 3.4 million km2 of the northern and central Transantarctic Mountains. Based on our analyses, we found 24 valleys with a high likelihood of containing massive buried ice (including two previously documented sites). The final determination of whether the valleys indeed have buried ice requires a field site visit.
The high number of potential buried ice sites that we discovered is not necessarily surprising as the anecdotal and experiential evidence has existed of field sites where massive ice is either partially covered (for example Koenig Valley in McMurdo Dry Valleys region), or valley floor regolith showing clear signs of slow deformation (for example Moraine Canyon, Amundsen Glacier region). However, neither of these sites are on our final list as they have large sections of exposed ice. In Antarctica, exposed ice sublimates at a relatively high rate, as measured at Taylor glacier to be 0.18 m/year (Robinson Citation1984). Therefore, the two examples above are not real buried ice masses, and the ice must be relatively young.
In order to elucidate the effect of irradiation on the preservation of the buried ice masses the mean aspects of both valleys with buried ice and no ice were calculated separately. The averages reveal a 19.8° difference, where the ice free valleys on average have more northern aspect (345.5°) than the valleys with buried ice (326.7°). As the full mass and energy balances of the buried ice systems over long periods of time are currently poorly understood, it is difficult to speculate if the small difference in the average aspects is meaningful or determining factor. The analysis may also be biased as the majority of all the valleys that were analysed are found generally on a NW heading between SW and NE. The general directional bias towards North-Northwest is likely controlled by the configuration of the East and West Antarctic ice sheets, the general trend of the Transantarctic Mountains, the trend of the major glaciers cutting across the TAM, and the significant elevation difference between the East Antarctic ice sheet and the Ross Ice Shelf on the opposite sides of the TAM.
It is well known that the altitude of a given valley directly affects the average temperature in that valley, and our analysis shows that at the lowest altitudes (<500 masl) none of the analysed valleys have buried ice and all the highest altitude valleys (>2000 masl) have buried ice. But this result may also be biased as the lowest altitude valleys have generally more northern aspect (300-60°) and the highest valleys have more of the NW aspect (241-328°). The most likely explanation appears to be that the existence of the buried ice in a given valley is to some degree controlled by the combined effects of the aspect and the altitude.
Traditionally rock-glaciers are detected by their visual appearance of fresh transverse ridges, lobate fronts, leading edges at angle of repose, and in-situ observations of massive and/or interstitial ice (Capps Citation1910; Potter Citation1972). In the midlatitudes and Arctic they have been found by geologists visiting the field areas multiple times since the early twentieth century. However, in Antarctica much of the land area has never been visited by geologists and thus, very limited on-site experience exists of possible buried ice sites there. In fact, the only mapping of rock-glaciers in Antarctica was limited to the Dry Valleys region. For these reasons, published information existed of only spatially small rock glaciers in the Dry Valleys region, and two additional massive buried ice sites in Antarctica. Our new remote sensing method allowed us to analyse most of the Victoria Land and southern TAM for possible evidence of buried massive ice sites. We located 22 previously unknown sites that have a high likelihood of harboring buried ice. As one such buried ice site has already been shown to harbor some of the oldest ice on Earth (Bibby et al. Citation2016; Bergelin et al. Citation2022), our 22 new sites open up an opportunity to date them and possibly find more sites with ancient ice which is a critical and unique source of climate proxies for studying past climates on Earth.
6. Conclusions
Based on the prior research and our field experience, we developed a methodology to remotely map the locations of potentially buried ice masses in Transantarctic mountains. After visually analysing >8,000 satellite images and related Digital elevation Model we found 24 field sites that have a high likelihood of containing buried massive ice. Of these, two were previously known sites, and 22 are previously unknown sites, and thus, they will require ground truthing for final proof of the existence of the massive ice.
Further analyses of the field area topography revealed that the average aspect of all studied valleys is 335 degrees (NNW heading), while all the aspects span between east and southwest. The buried ice was found mainly in valleys with a western or north-western aspect, and on Northern and north-eastern aspects most valleys were ice free. The buried ice was only found in valleys that are at or above 700 masl and all the valleys above 2000 masl had buried ice.
The newly available remote sensing assets for Antarctic research, namely access to high resolution airphotos and satellite imagery combined with the Digital Elevation Model of Antarctica (REMA) allowed for detection of new sites with high potential for buried ice. These sites make attractive future targets for verification of the existence of the ice and search for ancient ice. The importance and potential of these 22 new sites was highlighted recently at one such site, in Ong Valley, Antarctica where the buried ice was dated to be 3-5 Myrs old and is currently being analysed for multiple paleoproxies to improve and extend our understanding of the climate on Earth during a time period of which very little direct information exists elsewhere (Bergelin et al. Citation2022).
Acknowledgements
We are grateful to M. Shanks for the analyses and help she provided for this project.
Disclosure statement
No potential conflict of interest was reported by the authors.
Additional information
Funding
References
- Ashwell IY, Hannell FG. 1966. Experiments on a snow-patch in the mountains of Sweden. J Glaciol. 6(43):135–144.
- Bergelin M, Putkonen J, Balco G, Morgan D, Corbett LB, Bierman PR. 2022. Cosmogenic nuclide dating of two stacked ice masses: Ong Valley, Antarctica. The Cryosphere. 16(7):2793–2817.
- Bibby T, Putkonen J, Morgan D, Balco G, Shuster D. 2016. Million year old ice found under meter thick debris layer in Antarctica. Geophys Res Lett. 43(13):6995–7001.
- Bockheim J, Kurz M, Soule S, Burke A. 2009. Genesis of active sand-filled polygons in lower and central Beacon Valley, Antarctica. Permafrost Periglac Process. 20(3):295–308.
- Brenning A. 2009. Benchmarking classifiers to optimally integrate terrain analysis and multispectral remote sensing in automatic rock glacier detection. Remote Sens Environ. 113(1):239–247.
- Capps S. 1910. Rock glaciers in Alaska. J Geol. 18(4):359–375.
- Clark D, Steig E, Potter N, Gillespie A. 1998. Genetic variability of rock glaciers. Geogr Ann Ser a-Phys Geogr. 80(3–4):175–182.
- Hagedorn B, Sletten R, Hallet B. 2007. Sublimation and ice condensation in hyperarid soils: modeling results using field data from Victoria Valley, Antarctica. J Geophys Res. 112(F3)
- Hagedorn B, Sletten R, Hallet B, McTigue D, Steig E. 2010. Ground ice recharge via brine transport in frozen soils of Victoria Valley, Antarctica: insights from modeling delta O-18 and delta D profiles. Geochim Cosmochim Acta. 74(2):435–448.
- Hallet B, Putkonen J, Sletten R, Potter N. Jr. 2004. Permafrost process research in the United States since 1960. In: Gillespie AR, Porter SC, Atwater BF, editors. The Quaternary period in the United States. San Francisco: Elsevier; p. 584.
- Harbor J, Hallet B, Raymond C. 1988. A numerical-model of landform development by glacial erosion. Nature. 333(6171):347–349.
- Hassinger J, Mayewski P. 1983. Morphology and dynamics of the rock glaciers in Southern Victoria Land, Antarctica. Arct Alp Res. 15(3):351–368.
- Herreid S, Pellicciotti F. 2020. The state of rock debris covering Earth’s glaciers (vol 51, pg 717, 2020). Nat Geosci. 13(10):711–711.
- Humlum O. 1988. Rock glacier appearance level and rock glacier initiation line altitude – a methodological approach to the study of rock glaciers. Arct Alp Res. 20(2):160–178.
- Jason J. 2001. Rock glacier mapping: A method utilizing enhanced TM data and GIS modeling techniques. Geocarto Int. 16(3):5–15.
- Liu L, Sletten R, Hagedorn B, Hallet B, Mckay C, Stone J. 2015. An enhanced model of the contemporary and long-term (200ka) sublimation of the massive subsurface ice in Beacon Valley, Antarctica. J Geophys Res Earth Surf. 120(8):1596–1610.
- Marchant DR, Lewis AR, Phillips WM, Moore EJ, Souchez RA, Denton GH, Sugden DE, Potter N, Jr, Landis GP. 2002. Formation of patterned ground and sublimation till over Miocene glacier ice in Beacon Valley, southern Victoria Land, Antarctica. Geol Soc Am Bull. 114(6):718–730.
- Martin H, Whalley W. 1987. Rock glaciers.1. Rock glacier morphology – classification and distribution. Prog Phys Geogr. 11(2):260–282.
- Muhammad S, Lide T, Shaukat A, Yasir L, Muhammad A, Wazir Muhammad A, Goheer Muhammad S, Iqtidar H, Liu S. 2020. Thin debris layers do not enhance melting of the Karakoram glaciers. Sci Total Environ. 746:141119.
- Ostrem G. 1959. Ice melting under a thin layer of moraine, and the existence of ice cores in moraine ridges. Geogr Ann. 41(4):228–230.
- PGC. 2018a. Web page: polar Geospatial Center University of Minnesota; [accessed 2018].
- PGC. 2018b. PGC public information. Web page: polar Geospatial Center University of Minnesota; [accessed 2018].
- Potter N. 1972. Ice-cored rock glacier, Galena creek, northern Absaroka Mountains, Wyoming. Geol Soc Am Bull. 83(10):3025.2.0.CO;2]
- Putkonen J, Balco G, Morgan D. 2008. Slow regolith degradation without creep determined by cosmogenic nuclide measurements in Arena Valley, Antarctica. Quat Res. 69(2):242–249.
- Putkonen J, Roe G. 2003. Rain-on-snow events impact soil temperatures and affect ungulate survival. Geophysical Research Letters, 30(4):1188, doi:10.1029/2002GL016326.
- Putkonen J, Sletten RS, Hallet B. 2003. Atmosphere/ice energy exchange through thin debris cover in Beacon Valley, Antarctica. Proceedings of the 8th International Conference on Permafrost, International Permafrost Association; 2003; Zurich, Switzerland.
- Rangecroft S, Harrison S, Anderson K, Magrath J, Castel A, Pacheco P. 2014. A first rock glacier inventory for the Bolivian Andes. Permafr Periglac Process. 25(4):333–343.
- Ray LL. 1940. Glacial chronology of the southern rocky mountains. Bull Geol Soc Am. 51:1651–1918.
- Robinson P. 1984. Ice dynamics and thermal regime of Taylor Glacier, South Victoria Land, Antarctica. J Glaciol. 30(105):153–160.
- Schafer JM, Baur H, Denton GH, Ivy-Ochs S, Marchant DR, Schluchter C, Wieler R. 2000. The oldets ice on Earth in Beacon Valley, Antarctica: new evidence from surface exposure dating. Earth Planet Sci Lett. 179(1):91–99.
- Shanks MN. 2021. Mapping of debris covered ice masses; Transantarctic Mountains, Antarctica. Grand Forks, ND: University of North Dakota.
- Sugden DE, Marchant DR, Potter N, Souchez RA, Denton GH, Swisher Iii CC, Tison J-L. 1995. Preservation of Miocene glacier ice in East Antarctica. Nature. 376(6539):412–414.
- Swithinbank C. 1950. The origin of dirt cones on glaciers. J Glaciol. 1(08):461–465.