
 ?Mathematical formulae have been encoded as MathML and are displayed in this HTML version using MathJax in order to improve their display. Uncheck the box to turn MathJax off. This feature requires Javascript. Click on a formula to zoom.
Abstract
One of the specific features of porphyry copper (Cu) mineralization is the distinct occurrence of hydrothermal alteration zones, which can be mapped by processing various satellite images. Among free multispectral images, Landsat 8 OLI and ASTER data are known to be efficient in mapping different geological features, such as alteration zones and tectonic lineaments. This study aims to show the potential of these data types in mapping porphyry Cu mineralization by proposing a framework for employing and integrating different image processing methods. These methods include principal component analysis (PCA), spectral angle mapper (SAM), and matched filtering (MF) employed on these satellite images to map target al.teration zones. Moreover, PCA and directional filtering are applied to the ASTER dataset to enhance and map structural features. The results are evaluated and then combined to provide a potential map of Cu mineralization in the Chahargonbad area, located within the Urumieh-Dokhtar magmatic belt (UDMB) in Kerman province, Iran. The prediction-area plot and normalized density, which are data-driven methods, are used to assign the relative weight of each layer and evaluate them. Finally, using the calculated weights, data-driven multi-index overlay (DMIO) and fuzzy ordered weighted averaging (FOWA) methods are applied to combine the evidential layers. The potential mineralization maps created by the DMIO and FOWA provide a prediction rate of 80% and 82%, respectively. Furthermore, the accuracy of the integrated maps is investigated using the area under the curve (AUC) of the receiver operating characteristic (ROC) curves. The AUC scores obtained from the ROC curves of DMIO and FOWA methods are 0.85 and 0.88, respectively, representing powerful positive spatial relationships with mineralization areas. Based on the results, the proposed framework can be applied to provide a potential map of porphyry Cu mineralization, particularly in arid regions, with reasonable accuracy.
1. Introduction
Remote sensing has established a beneficial aid during the early phases of mineral exploration in alteration mineral mapping for mineral prospectivity mapping purposes. Therefore the application of novel and valid methods in integrating various remote sensing evidential layers in various types of mineral exploration studies is crucial (Zhang et al. Citation2016; Wang et al. Citation2017; Shirmard et al. Citation2020; Frutuoso et al. Citation2021).
Porphyry Cu deposits are created from hydrothermal fluids that form from a voluminous magma chamber several kilometers below the deposit. Because of their immense volume, porphyry ore bodies can be economical from copper concentrations as low as 0.15% copper and are currently the largest source of copper ore; they also have monetary amounts of by-products such as molybdenum, silver, and gold. In some mines, those metals are the primary product (Sillitoe Citation2010). Thus, an efficient methodology using appropriate data should be applied to detect this mineralization.
In the past few decades, many studies have been published on using a range of satellite data and applying various data processing methods to map the features associated with porphyry Cu mineralization, such as lithological units, alteration zones, tectonic features, and individual minerals (Pournamdari et al. Citation2014; Pour and Hashim Citation2015a, Citation2015b; Pour et al. Citation2016; Citation2018a, Citation2018b, Citation2018c; Bolouki et al. Citation2019; Shirmard et al. Citation2022). Also, different types of ore deposits, like volcanogenic massive sulfide, porphyry copper (Cu) and gold, epithermal gold, iron-oxide-copper-gold (IOCG), and podiform chromite have been successfully detected by processing satellite data in green areas, particularly metallogenic provinces (Gabr et al. Citation2015; Botwe et al. Citation2018; Pour et al. Citation2018a, Citation2018b, Citation2018c; Zoheir et al. Citation2019; Cardoso-Fernandes et al. Citation2020; Shirmard et al. Citation2020; Frutuoso et al. Citation2021).
Hydrothermal alteration zones are significant indicators of mineralization in hydrothermal systems, particularly porphyry and epithermal deposits. Mapping altered zones of such deposits that usually show a typical pattern, can contribute to the speedy and cost-effective identification of promising areas (Wu et al. Citation2019; Köhler et al. Citation2021). Hydrothermal alteration types that generally occur in porphyry Cu deposits are argillic, phyllic, propylitic, and potassic (Wu et al. Citation2019). The supergene alteration zone occurs above the porphyry Cu mineralization by constructing a widespread iron oxide and hydroxide mineralization called gossan (Sabins Citation1999; Riquelme et al. Citation2018; Perelló et al. Citation2020). This alteration pattern and the placement of target mineralization enable exploration geologists to use satellite images for mapping potential zones. Geological characteristics such as lineaments and faults are the significant tectonic events that control mineralizations and drainage patterns in the study area. Therefore, mapping the lineaments that contain an exhibition of features including various geological substances (faults, shear zones, joint patterns, bedding, and intrusive structures), not lineaments that display the underlying geological structure (aligned water systems and valleys, topographical alignments, vegetation distinctions, and aligned natural springs) is considered one of the essential remote sensing criteria in mineral exploration studies (Manuel et al. Citation2017; Farahbakhsh et al. Citation2020).
The most common employed spaceborne data for mapping alteration zones are Landsat 5 thematic mapper (TM), Landsat 7 enhanced thematic mapper plus (ETM+), Landsat 8 operational land imager (OLI), advanced land imager (ALI), and advanced spaceborne thermal emission and reflection radiometer (ASTER) due to their availability and relatively high spatial resolution (Pour and Hashim Citation2015a; Zhang et al. Citation2016). These satellite images have been widely used to recognize hydroxyl-bearing and iron oxide minerals in the reconnoitering steps of porphyry Cu exploration (Chavez et al. Citation1991; Yésou et al. Citation1993; Wu et al. Citation2019). False color combination (FCC), band ratios (BR) (Pour and Hashim Citation2015b; Moradpour et al. Citation2022), principal component analysis (PCA) (Bolouki et al. Citation2019; Feng et al. Citation2019; Pour et al. Citation2019), spectral angle mapper (SAM) (Mehdizadeh Tehrani et al. Citation1981; Wu et al. Citation2019), matched filtering (MF), minimum noise fraction (MNF), mixture-tuned matched filtering (MTMF), (Pour et al. Citation2013, Pour and Hashim Citation2015b), and linear spectral unmixing (LSU) (Pour et al. Citation2013), are from the most successful image processing techniques used during the past few decades for mapping hydrothermal alteration zones of porphyry Cu deposits. In recent years, machine learning methods have appeared as practical tools for solving various geoscience problems (Harvey and Fotopoulos Citation2016; Lary et al. Citation2016; Lee et al. Citation2017; Bachri et al. Citation2020; Chakouri et al. Citation2020). Machine learning is a subcategory of artificial intelligence that has been deemed trustworthy since it can efficiently and accurately classify remote sensing imagery (Maxwell et al. Citation2018). Machine learning techniques can assist the process of a wide range of remote sensing datasets and specify the association between components such as the reflectance continuum and target characteristics. Integrating machine learning with mentioned techniques can aid analyze remote sensing data (Varouchakis et al. Citation2021). These techniques have been usually applied to recognize particular alteration zones or minerals, but occasionally in delineating the intensity of a particular mineralization, evidence of mineralization enrichment, and ore body location. It is noteworthy that hydrothermal alteration maps can be misleading when indicator alteration minerals exist in different alteration zones (Wu et al. Citation2019).
Directional and Laplacian filters can subsequently be applied on grayscale images obtained from the standard PCA method to enhance tectonic lineament. The directional filter is applied using 3 × 3 or 5 × 5 kernels in the directions with azimuths of 0°, 45°, 90°, and 135°. The directional filter improves the edges striking N-S, NE–SW, E–W, and NW–SE. The Laplacian filter utilizes 3 × 3 or 5 × 5 kernels with a value of 4 for the center pixel and − 1 for the N–S and E–W pixels (Farahbakhsh et al. Citation2020; Ahmadi and Pekkan Citation2021).
A variety of knowledge- and data-driven methods have been developed in the past few decades for integrating different exploration layers for creating prospectivity maps of target mineralization (Yousefi and Carranza, Citation2016). In this study, two integration methods are applied and compared to combine remote sensing layers. The data-driven index overlay method (DMIO) is an extracted method from the index overlay (IO) method that was proposed for knowledge-driven mineral prospectivity mapping by Bonham-Carter (Citation1994). In the IO method, each evidential map’s evidence classes is given weights according to the specialist judgment, and every evidential layer is assigned a weight, whereas, in the DMIO method, the weights are determined using known mineral occurrences. The other method is the fuzzy ordered weighted averaging (FOWA) operator, one of the most effective multi-criteria decision-making methods (Malczewski Citation2006). This method has the ability to model uncertainties and risks in aggregating group criteria and rarely applied for creating mineral prospectivity maps (Abedi et al. Citation2015; Yousefi and Carranza Citation2015a, Citation2015b).
This study proposes a framework for integrating different image processing methods. Its final aim is to outline and prioritize prospective areas for exploring undiscovered porphyry Cu mineralization in the study area via constructing a geological remote sensing exploration model for MPM through alteration and geological anomaly detection. The proposed framework is applied to Landsat 8 OLI and ASTER data to distinguish target hydrothermal alteration and structural zones related to the porphyry Cu mineralization in the Chahargonbad area, southeast of Iran. The results can guide through detecting alteration types related to the target mineralization in poorly mapped or unmapped regions in the study area and establishing a robust and straightforward remote sensing-based approach for porphyry Cu mineralization prospectivity mapping. The concentration–area (C–A) fractal model (Cheng et al. Citation1994), prediction–area (P–A) plot, and normalized density method (Yousefi and Carranza Citation2015a, Citation2015b) are applied to classify, evaluate, and assign weights to remote sensing layers and create a data-driven integrated map. The prospectivity maps resulted by applying DMIO and FOWA methods are used to identify the areas associated with porphyry Cu mineralization and the results are compared. In addition to the P-A plots, the prospectivity maps are validated by receiver operating characteristic (ROC) curves. Only a few studies focused on applying FOWA in mineral prospectivity mapping, and the way of assigning weights to the criteria applied in this study has not been used. Therefore, the procedure presented in this study in obtaining the final model of MPM using remote sensing data is novel and efficient, and since the use of the applied methodology can lead to the reliable identification of mineralization areas, it can be used in future studies and other areas.
2. Geographical and geological settings
The study area is located in Central Iran’s southern part of the volcanic-sedimentary belt (Urumieh-Dokhtar magmatic belt (UDMB)). The geographical position of the study area is in latitude 29°׳30 to 30° and longitude 56° to ׳30° 56. The study area is 2600 square kilometers and is covered by a quadrangle map of Chahargonbad at a scale of 1:100k prepared by the Iranian Geological Survey and Mineral Exploration Organization (GSI) (Khan-Nazer et al. Citation1995). The study area is situated in the mountainous areas, and its lowest altitude is 2077 meters, and its highest altitude is 3017 meters above sea level. The area’s topography is relatively high, and its altitude is 2400 meters above sea level. There is small vegetation within the region.
The UDMB is one of the main Cu mineralization potential areas in Iran, which is part of the colliding Alpine-Himalayan orogenic belt, starting from western Europe, passing through Turkey and then Iran, and continuing to western Pakistan. The UDMB is located in the southern margin of Central Iran with a northwest-southeast (NW–SE) trend and length of approximately 400 km and 40-50 km wide (Berberian et al. Citation1982; Zarasvandi et al. Citation2005; Khaleghi and Ranjbar Citation2011; Hosseini et al. Citation2017; Kamali et al. Citation2018). The Cu deposits discovered along this belt are mostly located in the Cenozoic magmatic arc of Kerman. Many of them show the characteristics of porphyry-type deposits.
The Chahargonbad area is located in a mountainous region in the UDMB, northeast of Sirjan, in the Kerman province, Iran (). The Eocene volcano-sedimentary rocks are the most extensive outcrops in the Chahargonbad. The oldest geological unit is exposed as a small outcrop of metamorphic deposits in the southwest of the target area. Quaternary alluviums are mostly dispersed in the northeastern part of the Chahargonbad which are the youngest geological units. Among the most critical structural phenomena in the region are faults and folds. The folds in the region exist as a set of anticlines and synclines with a northwest-southeast trend. Two faults separate northern and southern geological parts of the study area. The northern part consists of Eocene-Pliocene volcanic-sedimentary rocks and is structurally part of the Urmia-Dokhtar volcanic belt (Dehj-Sardouieh belt). In the southern part, there is a horst-like structure made of mafic and ultramafic rocks with radiolarite deposits and pelagic limestones and represents the oceanic crustal facies. Also, in the late Miocene, tectonic movements caused the folding of rock masses with an NW- SE trend in the target region (Khan-Nazer et al. Citation1995).
Figure 1. (a) Study area located within the Urumieh-Dokhtar magmatic belt in Iran; (b) Simplified geological map of the study area with known Porphyry Cu occurrences (Khan-Nazer et al. Citation1995).
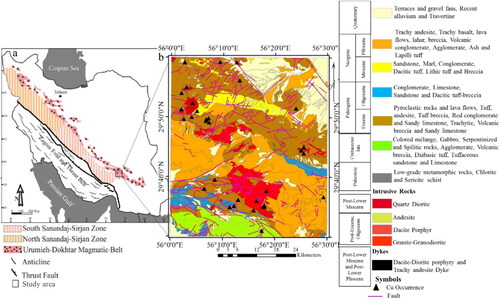
Copper mineralization has occurred in most parts of the Chahargonbad district. This mineralization generally consists of copper veins. In addition to copper, there are mineral indicators such as travertine and zeolite in this range. The other economic minerals include chalcopyrite, marcasite, native gold, pyrite, and tetrahedrite. The porphyry Cu deposits in the target area lie in the central-southern section of the UDMB, 60 km to the southeast of the world-class Sarcheshmeh, and the average copper concentration values are 1/1%. Intrusive and volcanic units with Eocene, Oligocene, Miocene, and Pliocene ages in the Chahargonbad area have been identified as the host rocks of porphyry copper mineralization. The 1:100k simplified reproduced geological map of the target study area (Khan-Nazer et al. Citation1995) is shown in .
3. Materials and methods
3.1. Remote sensing data
As mentioned earlier, two types of satellite images, including Landsat 8 OLI and ASTER, are employed to produce maps of hydrothermal alteration zones and lineaments in the study area. The spatial resolution of the two sensors mounted on Landsat 8, i.e. OLI and TIRS (thermal infrared sensor), is from 15 to 100 m (m). The summarized characteristics of this remote sensing data are described in (Pour and Hashim Citation2015b). Two cloud-free level 1 T images of Landsat 8 (path/row 160/39 and path/row160/40) acquired on 15 May 2013 were obtained from the EarthExplorer (earthexplorer.usgs.gov). Bands 1, 9, and two long-wavelength thermal bands of 10 and 11 are not used in this study. OLI data are converted to the surface reflectance by applying the image-base atmospheric correction (Montanaro et al. Citation2014).
Table 1. Characteristics of Landsat 8 and ASTER remote sensing data that are used for MPM in the study.
The ASTER data features are shown in (Shirmard et al. 2021). TIR bands of ASTER data are primarily used to indicate the vegetation and various geological materials for regional lithological mapping and not considered in this study. Two cloud-free level 1 T ASTER scenes acquired in April 2015, were downloaded and stitched. For converting to surface reflectance, the atmospheric correction applied to eliminate atmospheric effects from the ASTER VNIR and SWIR data.
3.2. Image processing
3.2.1. Principal component analysis
In satellite image processing, PCA is a strong statistical method applied for image enhancement. This approach is almost one of the first methods in analyzing and the best-known technique in multivariate analysis. PCA determines the eigenvectors of a covariance or correlation matrix and the obtained components are usually more interpretable than the original data. This method can be used for the multivariate data processing of high dimensional remote sensing images to highlight spectral responses of particular minerals generated by hydrothermal alterations (Crósta et al. Citation2003; Cardoso-Fernandes et al. Citation2018). By employing pixel values in original images and the components of the eigenvectors, principal components for each image are calculated as follows:
(1)
(1)
Pk is the desired pixel value of the kth principal component, DN(i) is the ith band desired pixel value, and aik is the load element value acquired from the eigenvector of the kth component in the ith band. Therefore, an image that illustrates the variability in the direction of that vector could be obtained for each principal component or corresponding vector (Loughlin Citation1991). This study used the standard PCA to process ASTER and OLI imagery to identify hydrothermal alteration zones.
3.2.2. Spectral angle mapper
SAM is a classification technique that allows accelerated alteration mapping by determining the spectral similarity between the spectrums of an image and reference reflectance spectra (Pour and Hashim Citation2011). SAM is an efficient way to compare the spectrum of images to a specific or standard (library) spectrum. The spectral angle between the two vectors is calculated by converting spectra to vectors in a space with dimensions of the number of bands. The degree of similarity between the image spectrum (t) and the reference spectrum (r) is calculated using EquationEq. 2(2)
(2) .
(2)
(2)
nb is the band number, ti is the measured spectrum, and ri is the reference spectrum (Malekzadeh, 2009; Yohas et al. 1992). Alterations of phyllic, argillic, propylitic, and oxide zones could be distinguished from the porphyry Cu mineralization areas considered in this study. Sericite (a fine-grained variety of muscovite and illite) is the dominant alteration mineral in the phyllic zone. In phyllic and propylitic alterations have lower amounts of sericite and higher amounts of chlorite. Chlorite, associated with various amounts of illite, epidote, and calcites, is widespread in propylitic alteration. Kaolinite exists as a dominant alteration mineral in the argillic zone. Hematite, goethite, and jarosite, essential indicators of an oxide zone, are observed in oxide-rich areas associated with the porphyry Cu mineralization (Pour and Hashim Citation2011). Therefore, the spectral graphs of a set of mentioned minerals, which are related to validating the hydrothermal alternation zones, in the US geological survey (USGS) spectral library are used as reference spectral data that are available within the ENVI software package.
3.2.3. Matched filtering
The MF method is one of the spectral classification techniques that optimizes the linear filter in order to maximize the ratio of signal-to-noise and was initially identified as a North filter (Boardman et al. 1995; Chen Citation2011). MF depends on the correlating obtained signal (a vector) with a filter (another vector) that maximizes the improved signal parallel to the signal (Turin Citation1960; Boardman et al. 1995; Chen Citation2011). The output of this process is an image in which the pixels provide a score against the background distribution group (Kruse et al. Citation2003; Asadzadeh and Filho Citation2015). The MF method uses a user-defined endmember to increase the response of known endmember and prevent context response. Five major endmembers were determined from the MF images: muscovite/illite for phyllic, kaolinite/montmorillonite for argillic, chlorite/epidote for propylitic alterations, unaltered units in volcanic rocks, and green vegetation. There are some overlapping in the occurrence of associated minerals (Honarmand et al. Citation2011). This method is a fast tool for identifying specific materials based on matching the end member of the spectral reflection curve with the image. The MF scores have a range between 0 and 1.0 define the sub-pixel fractions per chosen end-member. The most suitable fit to the target mineralization is achieved where MF scores of pixels is close to 1 and lower infeasibility values (Boardman et al. 1995). The principal benefit of this approach is a better classification of features that are scattered in the image and are integrated into other classes in the usual classification methods.
3.2.4. Lineament mapping
In mineralization areas, mapping fractures can be essential for mineral exploration since they can operate as a channel for transferring mineral-bearing fluids (Wang and Xiao Citation2018). Faults, folds, shear zones, and lineament structures concentrate magma or transfer it toward shallow crust parts. Studying lineaments and faults connected with porphyry copper mineralizations can be crucial for defining the precise location of porphyry deposits (Brookhian et al. Citation2020). Amongst the prevailing optical remote sensing data widely utilized for lineament detection are ASTER and Sentinel 2. Furthermore, Synthetic-aperture radar (SAR), Interferometric synthetic aperture radar (InSAR), Shuttle Radar Topography Mission (SRTM) derived Digital Elevation Model (DEM), and Sentinel 1 are the usual radar remotely sensed data that are mainly used for the identification of geological lineaments (Ahmadi and Pekkan Citation2021). Since this study aims to extract the geological features associated with porphyry Cu mineralization using satellite data, only these data were used to obtain mineralization-related lineaments. Remote Sensing approach is more applicable when used with other lineament or edge enhancement and filtering methods, such as directional filters. Directional filtering usually results in efficient maps since fractures and faults are generally distributed in specific directions. Different studies have been carried out on the use of directional filters for extracting tectonic lineaments and different methods such as directional (Sobel) and non-directional (Laplacian) filters have been applied to a variety of datasets. They mostly report that directional filters provide more accurate results (Tripathi et al. Citation2000; Ahmadi and Pekkan Citation2021).
In this study, the standard PCA is performed on the ASTER dataset and the first principal component which has the maximum variance, is used to extract tectonic lineaments. First, the sharpen edge filter is applied to the selected component and then, four directional filters containing NW–SE, NE–SW, E–W, and N–S using a 5 × 5 kernel size are applied, and the lineaments are identified and mapped manually in the ArcMap software package in order to avoid man-made elements for instance road webs, railroads, and electrical or telecommunications webs. The SRTM digital elevation model (DEM) was utilized to recognize rivers and eliminate any redundant abnormal lineaments irrelevant to the mineralization (Sabins Citation1999; Lillesand and Kiefer Citation2008; Farahbakhsh et al. Citation2020).
3.3. Layer selection and data integration
The situation of known mineral occurrences in the target study area is applied to validate the result of applying each method on satellite images. Yousefi and Carranza (Citation2016, Yousefi and Carranza Citation2015a, Yousefi and Carranza Citation2015b), Parsa et al. Citation2016, Forson et al. Citation2020 proposed the C–A model (Cheng et al. Citation1994) and P–A plot for classifying, evaluating, and weighing evidential layers to reduce the effect of subjectivity. In this study, we use a method developed by Yousefi et al. (Citation2012, Citation2013), Parsa et al. (Citation2016), to plot the percentage of known mineralization occurrences and occupied areas affiliated to the classes of each evidential maps versus corresponding transformed values applying a sigmoidal function for calculating the prediction rate. Based on the prediction rate of each map, the alteration maps showing the highest prediction rate are selected. The prediction rates of different alteration layers obtained from different satellite data and processing methods are presented in .
Table 2. Prediction rates of different image processing methods applied to various remote sensing datasets.
The P–A plots is able to specify the relative importance of evidential maps in terms of their relationship with target mineralization. Furthermore, using the corresponding values on the right and left axes of these plots, evidential layers can be weighed. A normalized density can be obtained by calculating the ratio of prediction rate to the corresponding occupied area (EquationEq. 3(3)
(3) ) (Yousefi and Carranza Citation2015b).
(3)
(3)
Where Nd in the above equation is the normalized density, Pr is the prediction rate, and Oa is the corresponding occupied area extracted from the P–A plot intersection point. The normalized density is used for calculating the objective weight of each map (WE) according to EquationEq. 4(4)
(4) (Yousefi and Carranza Citation2015b, Parsa et al. Citation2016).
(4)
(4)
Where, WE is the final weight of each evidential layer calculated using the P-A plot. In order to create a prospectivity map, the weighted evidential maps, containing argillic, phyllic, propylitic, and iron oxide alterations and lineaments are combined (Bonham-Carter Citation1994; Malczewski Citation2006; Carranza Citation2009; Yousefi and Carranza Citation2015b; Vu et al. Citation2019). We use the index-overlay process applied by Yousefi and Carranza Citation2015a, and the modified weighted linear combination (WLC) technique while including a linguistic fuzzy quantifier (FOWA) to create a prospectivity map with a variety of decision scenarios or strategies.
One of the usual techniques for data fusion and integrating different evidential maps is a knowledge-driven approach called multiclass index overlay (Bonham-Carter Citation1994; Nykänen Citation2008; Moradi et al. Citation2015). Using this technique, evidential maps can be classified and discretized into a number of random classes, weighed subjectively, and then integrated. However, in this study, the weights of evidential layers are assigned according to their efficiency in identifying known mineral occurrences based on the percentage of known porphyry Cu mineralization and the percentage of the occupied area on the P–A plot (Yousefi and Carranza Citation2015a, Parsa et al. Citation2016). The modified index-overlay function called DMIO is presented in EquationEq. 5(5)
(5) .
(5)
(5)
Where, DMIO is the score calculated for each pixel of a layer; Wi denotes the weight of the evidential layer i obtained by applying the P–A plot and the normalized density (EquationEqs. 4(4)
(4) and Equation5
(5)
(5) ). The Tvi is the value of each pixel in each evidential layer that is transformed (Yousefi and Carranza Citation2015a).
The other method applied here to obtain a mineral prospectivity map is FOWA proposed by Mitchell and Estrakh (Citation1997). Yager and Filev (Citation1998) extended the OWA operator in the fuzzy space which is called the fuzzy ordered weighted averaging (FOWA) operator. There are three basic fuzzy operators: a) intersection, b) union, and c) averaging operator. Yeager (1988) presented an integration method based on OWA operators, combining three mentioned hybrid functions (Malczewski Citation1999). In this study, the FOWA method used by Abedi et al. (Citation2015), has been applied to integrate mentioned evidential layers and create a prospectivity map. According to their study, this method is applied for different values of α (a variable in the FOWA algorithm). The FOWA operator presents a broad diversity of decision procedures by defining a proper value of α. For parameter α = 1, Q(r) (EquationEq.6(6)
(6) ) is equivalent to r, and consequently, it is directed to as the individuality quantifier. While α leads to zero, the quantifier Q(r) equals its extreme case of at least one, corresponding to the MAX operator. As α leads to infinity, the quantifier Q(r) equals its maximum, corresponding to the MIN operator (Abedi et al. Citation2015).
(6)
(6)
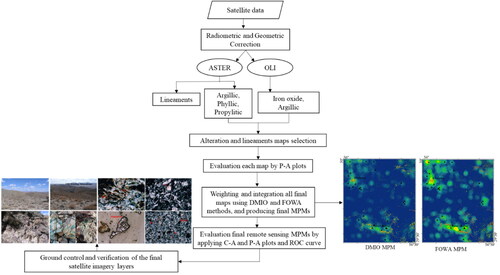
3.4. Framework
In this study, we propose a framework () to generate a porphyry Cu prospectivity map by integrating the evidential layers obtained by processing remote sensing data, i.e. OLI and ASTER that containe argillic, phyllic, propylitic, and iron oxide alteration and tectonic lineament layers. These are known as key features for highlighting porphyry Cu potential areas in the study area. As mentioned before, the P–A plot and normalized density technique (Yousefi and Carranza Citation2015a, Citationb; Ghaeminejad et al. Citation2020) are applied to evaluate and weigh the evidential maps, and eventually, the layers are combined and the prospectivity map of porphyry Cu mineralization is created using the DMIO and FOWA integration methods (). The final prospectivity maps are evaluated using the P-A and ROC plots and the efficiency of each method in producing a valid and accurate map is assessed.
Figure 2. Proposed framework for creating remote sensing evidential layers and data integration.
4. Results
4.1. Evidential layers
We applied PCA, SAM, and MF methods to the ASTER data for producing maps of argillic, phyllic, and propylitic alteration zones. These three spectral methods were also employed to the OLI data for mapping argillic and iron oxide alteration zones. Moreover, we used the ASTER dataset in order to create a tectonic lineament map. presents the prediction rate determined for all evidential layers generated using the remote sensing datasets. In , each layer obtained from each method with its prediction rate is presented in order to select the best alteration layer and assigning the weight.
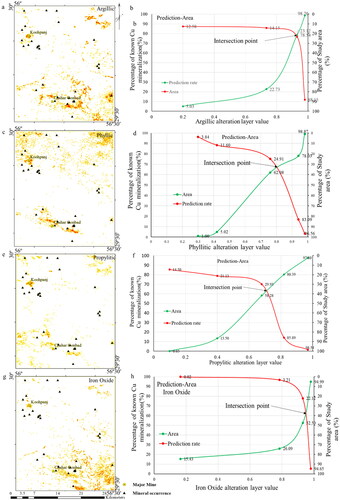
shows mapped argillic, phyllic, propylitic, and iron oxide alteration areas with the highest prediction rate according to . Also, their P-A plots are illustrated in the that indicates two curves of prediction rate of known mineralization occurrences and the curve of the percentage of occupied areas, that each of them is a criterion to assess each map. The intersection point in these plots exhibits a higher value on the left axis compared to the similar layers obtained by other methods.
Figure 3. (a) Continuous map of argillic alteration zones obtained by processing the OLI dataset using the MF method; (b) prediction–area plot of argillic alteration zones; (c) continuous map of phyllic alteration zones obtained from processing the ASTER dataset using the PCA method; (d) prediction–area plot of phyllic alteration zones; (e) continuous map of propylitic alteration zones obtained by processing the ASTER dataset using the MF method; (f) prediction–area plot of propylitic alteration zones; (g) continuous map of iron oxide alteration zones obtained by processing the OLI dataset using the SAM method; (h) prediction–area plot of iron oxide alteration zones.
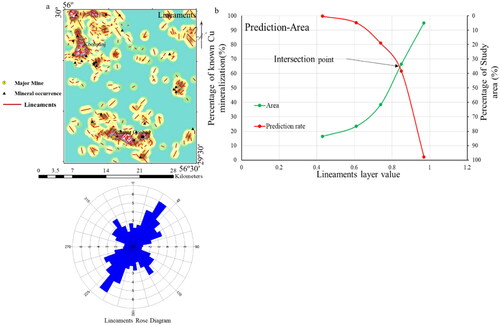
The density map of the lineaments obtained using the ASTER data is shown in , and the major trend of the lineaments is determined by the rose diagram which is northeast-southwest (NE–SW). Similar to the alteration maps, this layer is also evaluated using the P-A plot, which is created to determine the prediction rate of this map ().
Figure 4. (a) Lineaments overlaid the line density map and the corresponding rose diagram obtained by processing remote sensing data. (b) Prediction–area plot of the lineament density map.
The P-A plots generated for each remote sensing evidential layer are investigated, and the required parameters are recorded for calculating the weight of each layer. illustrates the parameters for weighing the evidential maps obtained from EquationEqs. 3(3)
(3) and Equation4
(4)
(4) .
Table 3. Extracted parameters from the intersection points of the P–A plots for each evidential layer.
4.2. Data integration and evaluation
There are 28 known porphyry Cu mineral occurrences in the target study area that are used to create the P–A plots and validate and evaluate the performance of the applied integration methods by overlaying the locations of these known mineral deposits on the discretized prospectivity maps. The prospectivity maps were generated using the selected evidential layers and DMIO and FOWA integration methods. The prospectivity map created by the DMIO method is presented in (Yousefi and Carranza Citation2015a). also shows the map created by applying FOWA method for α = 0. Altering the parameter α, we can obtain various types of quantifiers and related operators between the two maximum states of all and at least one of the quantifiers. As mentioned, the value of α in the OWA method is a controller that determines the role of the combination operator on a continuum between the extremes of MIN and MAX. By considering arbitrary values for α between zero and large numbers, we can obtain different maps from the FOWA method and select the best one based on the prediction rates.
Figure 5. (a) Map of objective multi-index overlay prospectivity (DMIO) scores generated by combining selected remote sensing evidential layers using the EquationEq. (5)(5)
(5) ; (b) concentration-area model, log-log plots for multi-index overlay prospectivity map; (c) classified multi-index overlay prospectivity map; (d) prediction-area plot of the multi-index overlay prospectivity map.
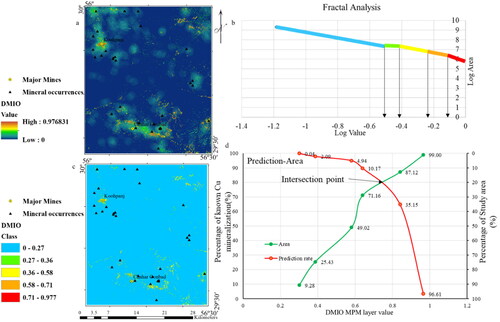
Figure 6. (a) Fuzzy ordered weighted averaging (FOWAα=0) prospectivity map generated by combining selected remote sensing evidential layers; (b) concentration-area model, log-log plots for fuzzy ordered weighted averaging prospectivity map; (c) classified fuzzy ordered weighted averaging prospectivity map; (d) prediction-area plot for the fuzzy ordered weighted averaging prospectivity map.
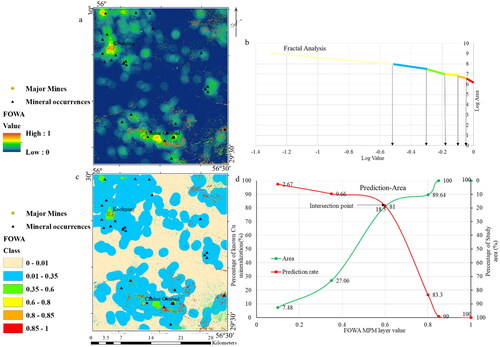
Based on Yousefi and Carranza (Citation2015a) and Parsa et al. (Citation2016), we applied the C–A fractal analysis for classifying the prospectivity maps obtained by the DMIO and FOWA methods. Cheng et al. (Citation1994) applied this method to define threshold values in a prospectivity map for the first time. The obtained prospectivity map using the multi-index overlay is classified by the plot presented in and shown in . The P–A model of this map is shown in . The DMIO prospectivity map () can predict 80% of known mineral occurrences in 20% of the study area based on the intersection point in the P-A plot (). The C-A and P-A plots are also created for the map generated by the FOWA method using different α values. Based on the prediction rate of each map, the prospectivity map created using α = 0 has the highest prediction rate. It is able to predict 82% of the known porphyry Cu mineral occurrences in 18% of the target area (). Consequently, based on EquationEq. 3(3)
(3) , the normalized density (Nd) values of 4 and 4.56 are obtained for DMIO and FOWAα=0 models, respectively. presents the parameters obtained from the C-A and P-A plots of each method and also the results of applying different values of α. Based on the results of the P-A plots, the prospectivity map with the highest prediction rate is determined.
Table 4. Extracted parameters from the intersection point of P–A and C-A plots using the DMIO and FOWA (different alpha values) methods.
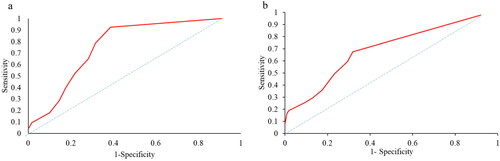
Besides the P-A plots for evaluating the prospectivity maps, receiver operating characteristic (ROC) curves were also applied for the assessment of DMIO and FOWA methods (). The area under curve (AUC) of ROC indicates the predictive value of the map by describing its ability to accurately estimate the mineralization areas and the absence of the desired mineralization event (fragile priority areas and weak porphyry Cu mineralization potential areas). AUC values range from 0.5 to 1. Qualitative-quantitative correlation of AUC and evaluation of estimates is as (1-0.9 excellent, 0.9-0.8 good, 0.8-0.7 acceptable, 0.7-0.6 average and 0.6-0.5 weak). The closer the surface of the curve is to one, the better the accuracy of the potential mapping method (Nykänen et al. Citation2015).
Figure 7. ROC curves of (a) FOWA and (b) DMIO prospectivity models.
5. Discussion
The P–A plots and normalized density method were applied to evaluate the capability of remote sensing data processing methods of PCA, SAM, and MF for creating argillic, phyllic, propylitic, and iron oxide alteration and lineament maps, which are known as significant features for mapping prospective areas of porphyry Cu mineralization. Input layers to the proposed framework need to be rasterized using a similar pixel size and transformed by a suitable logistic function to the range of [0, 1] (Yousefi and Carranza Citation2015a). Logistic-based weighting techniques can transform continuous values into the exact space, and there is no requirement to determine various empirical or generic (linear or nonlinear) functions (Bonham-Carter Citation1994; Carranza Citation2009). In knowledge-driven prospectivity mapping methods, discretization and classifying continuous spatial data and assigning a weight to each class (Carranza and Hale Citation2002; Carranza Citation2009; Yousefi and Carranza, Citation2016) create a systemic bias in the weighting of evidential layers. In this study the layers were not discretized, and we avoided bias using continuous values. We integrated weighted evidential layers using the DMIO and FOWA functions and a data-driven approach, resulting in various prospectivity maps with different prediction rates for target mineralization.
Based on , the prediction rate relevant to the P–A plot of the prospectivity map obtained from the FOWA with α = 0 is slightly higher than the prediction rate of the DMIO model. The FOWA prospectivity map could predict 82% of mineral occurrences, while the DMIO model predicted 80%. Using EquationEq. 3(3)
(3) , the normalized density values of 4.56 and 4 were determined for the FOWA and DMIO models. The ROC curve is able to estimate the accuracy of the models quantitatively, and it is known as one of the most efficient methods in providing deterministic properties, probabilistic identification, and prediction capability of prospectivity maps. According to the area under the ROC curves, the prediction accuracy of both maps obtained from the FOWA (AUC = 0.88) and DMIO (AUC = 0.84) methods is good, and both methods are efficient in providing a prospectivity map of porphyry Cu mineralization in the study area using remote sensing data.
Field observations help evaluate potential areas in mineral prospectivity maps (e.g. Yousefi and Carranza Citation2015b; Sun et al. Citation2019; Brandmeier et al. Citation2020). For this purpose, several samples were taken from those areas showing a high score after evaluating the final results of the C-A fractal models and P-A plots and detecting the prediction rates. These areas are associated with the porphyritic quartz diorite and andesitic tuff rock units, which are in closely related to the porphyry Cu mineralization. The proximity of gossans and malachite, sericite, and chlorite mineralization areas to fractures/fault junctions in the study area can be considered an indicator (). The accuracy of the prospectivity maps was confirmed by the sample studies and their microscopic thin sections (). Different mapped hydrothermal alteration areas show strong spatial association with the sample locations. Comparing alteration zones detected using the applied techniques and overlaying on the geological map of the study area for investigating geological features also confirmed the obtained results. The applied methods showed high efficiency for mapping porphyry Cu mineralization. Consequently, the proposed framework for creating a porphyry Cu potential map can provide an accurate result and minimize systematic errors through field investigations in arid regions.
Figure 8. Images showing different parts of the study area; (a) an overview of the study area showing hydrothermal alteration zones, (b) a hydroxyl-bearing alteration zone, (c) iron oxides mixed with other altered rocks, and (d) outcrops of the malachite mineralization.
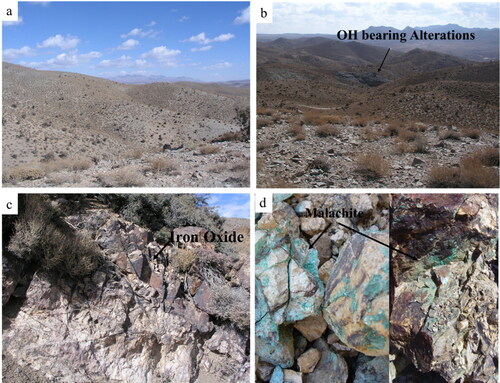
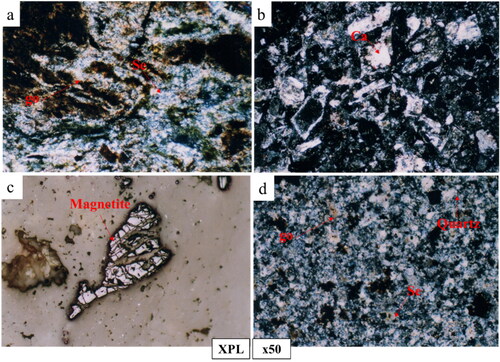
Figure 9. Microscopic images of the rock samples; (a) sericite and malachite sheet crystals with goethite, (b) calcified feldspar indicating the effect of calcium ion-rich hydrothermal solutions with micro-epidote and chlorite crystals, (c) broken magnetite mineralization with a cataclastic form, and (d) phyllic alteration showing fine-grained quartz crystals with fine sericite and goethite (in XPL light and ×50 magnification).
6. Conclusion
In the present study, two mineral prospectivity mapping methods, i.e. FOWA and DMIO were used to delineate potential areas of porphyry Cu mineralization by integrating hydrothermal alteration and lineament maps obtained by Landsat 8 OLI and ASTER satellite data in the Chahargonbad area. However, the principal contribution of this study is applying different remote sensing data processing methods and proposing a framework for integrating evidential layers. The deficiencies in a particular data or technique were handled using OLI and ASTER satellite images and processing techniques because they let us compare and select the best results.
We mapped phyllic and propylitic alteration zones using the ASTER dataset by applying PCA and MF methods and argillic and iron oxide alteration maps were generated by the OLI dataset and applying MF and SAM methods. These alteration layers and the lineament map were integrated to generate a predictive map of porphyry Cu mineralization. The layers were first transformed with a sigmoidal function to a new space with a range from 0 to 1, and then the layers were weighted based on the P-A plot. The prospectivity maps relevant to the mineralization type were created and evaluated by the P–A plot and ROC curve to identify which MPM has been more successful in prospecting desirable areas. According to the results, the potential mineralization areas of porphyry Cu are in good agreement with the previously mapped prospective regions of porphyry copper mineralization in the target area. The benefits of the proposed framework for combining remote sensing evidential layers are clarity and easy mathematics and statistics, which help cross-examine the information with other numerical geodatabases.
In conclusion, remote sensing data can efficiently map hydrothermal alteration areas and structural features linked with porphyry Cu mineralization and play a critical role in decreasing the area of the exploration operation. This study showed the efficiency of statistical methods of FOWA and DMIO for combining the evidential layers created by satellite images to generate a reliable prospectivity map. Furthermore, the integration analysis methodology using multiple remote sensing data, GIS technology, and DMIO and FOWA modeling can be applied elsewhere. Compared with geological maps and known porphyry Cu occurrences in the study area, the derived mineralization potential areas are associated with obtained hydrothermal alteration areas. Therefore, combining remotely-sensed geological factors and integrating multiple remotely-sensed alteration factors with the DMIO and FOWA methods provide a helpful methodology to extract exploration targets in the study area.
The obtained prospectivity model can provide significant implications to explore for other ore deposits related to the hydrothermal mineral system in other regions. Also, if the focus of subsequent exploration activities, field surveys, and large-scale exploration operations is done in identified areas, spending time and money in areas without potential mineralization will be avoided. The mining companies can consider the proposed framework an efficient tool for mineral prospectivity mapping before carrying out high-priced further studies in potential mineralization areas.
There are some limitations in applying the proposed framework in areas with a small number of known mineralization occurrences. Also, in this study, other exploration data types such as geochemistry and geophysics were not used, which can be one of the drawbacks of the performed modeling. Therefore, it is proposed to use other data typed and integration methods in future studies in MPM and compare the obtained results.
Appendix A. Supplementary data
Data are available on reasonable request to the corresponding author via email address “[email protected]".
Acknowledgments
The authors gratefully acknowledge the support provided by the School of Mining Engineering, College of Engineering, University of Tehran. We also express our sincere thanks to the National Iranian Copper Industries Company (NICICo) for providing requested data. Dr. Ehsan Farahbakhsh who edited and reviewed an earlier version of this manuscript, is also appreciated.
Disclosure statement
No potential conflict of interest was reported by the authors.
References
- Abedi M, Norouzi GH, Fathianpour N. 2015. Mineral potential mapping in Central Iran using fuzzy ordered weighted averaging method. Geophys Prospect. 63(2):461–477.
- Ahmadi H, Pekkan E. 2021. Fault-based geological lineaments extraction using remote sensing and GIS-A review. Geosciences. 11(5):183.
- Asadzadeh S, Filho C. 2015. Review and categorization of spectral processing methods. Anais XVII Brazilian Symposium on Remote Sensing - SBSR, João Pessoa-PB, Brazil, April 25-29, 2015, INPE, 1247–1254.
- Bachri I, Hakdaoui M, Raji M, Benbouziane A. 2020. Geological mapping using random forests applied to remote sensing data: a demonstration study from Msaidira-Souk Al Had, Sidi Ifni inlier (Western Anti-Atlas, Morocco). in: IEEE International conference of Moroccan Geomatics (Morgeo), IEEE. pp. 1–5.
- Banerjee K, Jain MK, Jeyaseelan AT, Panda S. 2019. Landsat 8 OLI data for identification of hydrothermal alteration zone in Singhbhum Shear Zone using successive band depth difference technique – a new image processing approach. Current Sci. 116(10):1639–1647.
- Berberian F, Muir ID, Pankhurst R, Berberian M. 1982. Late cretaceous and early miocene Andean type plutonic activity in northern Makran and Central Iran. JGS. 139(5):605–614.
- Bolouki SM, Ramazi HR, Maghsoudi A, Pour AB, Sohrabi G. 2019. A remote sensing-based application of bayesian networks for epithermal gold potential mapping in Ahar-Arasbaran Area, NW Iran. Remote Sens. 12(1):105.
- Bonham-Carter GF. 1994. Geographic information systems for geoscientists: modelling with GIS. New York, Pergamon: Elsevier; p. 398.
- Botwe T, Osei Jnr AK, Kwaw EM, Omitogun AA. 2018. Hydrothermal alteration mapping using remote sensing and GIS at the Prestea concession of Golden Star Bogoso/Prestea Ltd, Ghana. Int J Engin Sci Comput. 8(1):15898–15902.
- Brandmeier M, Cabrera Zamora IG, Nykänen V, Middleton M. 2020. Boosting for mineral prospectivity modeling: a new GIS toolbox. Nat Resour Res. 29(1):71–88.
- Brookhian M, Golkar Hamzee Yazd HR, Tavousi M. 2020. 3D modeling of faults and stability analysis of Dardvey mine in Sangan iron skarn complex, Iran. SN Appl Sci. 2(12):2098.
- Cardoso-Fernandes J, Lima A, Teodoro AC. 2018. Potential of Sentinel-2 data in the detection of lithium (Li)-bearing pegmatites: a study case. Proc. SPIE 10790, Earth Resources and Environmental Remote Sensing/GIS Applications IX, 107900T (9 October 2018),
- Cardoso-Fernandes J, Teodoro AC, Lima A, Roda-Robles E. 2020. Semi-automatization of support vector machines to map lithium (Li) bearing pegmatites. Remote Sens. 12(14):2319.
- Carranza EJM, Hale M. 2002. Where are porphyry copper deposits spatially localized? A case study in Benguet Province, Philippines. Nat Resource Res. 11(1):45–59.
- Carranza EJM. 2009. Controls on mineral deposit occurrence inferred from analysis of their spatial pattern and spatial association with geological features. Ore Geol. Rev. 35(3–4):383–400.
- Chakouri M, El Harti A, Lhissou R, El Hachimi J, Jellouli A. 2020. Geological and mineralogical mapping in Moroccan central jebilet using multispectral and hyperspectral satellite data and machine learning. IJATCSE. 9(4):5772–5783.
- Chavez PS, Sides SC, Anderson JA. 1991. Comparison of three different methods to merge multiresolution and multispectral data: landsat TM and SPOT panchromatic. Photogramm Eng Remote Sens. 57:295–303.
- Chen Q. 2011. Matched filtering techniques. In: Le Moigne J, Netanyahu N, Eastman R, editors. Image registration for remote sensing. Cambridge: Cambridge University Press; p. 112–130.
- Cheng Q, Agterberg FP, Ballantyne SB. 1994. The separation of geochemical anomalies from background by fractal methods. J Geochem Explor. 51(2):109–130.
- Crósta AP, Souza Filho CR, Azevedo F, Brodie C. 2003. Targeting key alteration minerals in epithermal deposits in Patagonia, Argentina, using ASTER imagery and principal component analysis. Int J Remote Sens. 24(21):4233–4240.
- Farahbakhsh E, Chandra R, Olierook HKH, Scalzo R, Clark C, Reddy SM, Müller RD. 2020. Computer vision-based framework for extracting tectonic lineaments from optical remote sensing data. Int J Remote Sens. 41(5):1760–1787.
- Feng YZ, Xiao B, Li RC, Deng CZ, Han JS, Wu C, Li GH, Shi HL, Lai, C, K. 2019. Alteration mapping with short wavelength infrared (SWIR) spectroscopy on Xiaokelehe porphyry Cu-Mo deposit in the Great Xing’an Range, NE China: metallogenic and exploration implications. Ore Geol Rev. 112:103062.
- Forson ED, Menyeh A, Wemegah DD, Danuor SK, Adjovu I, Appiah I. 2020. Mesothermal gold prospectivity mapping of the southern Kibi-Winneba belt of Ghana based on Fuzzy analytical hierarchy process, concentration-area (C-A) fractal model and prediction-area (P-A) plot. J Appl Geophys. 174:103971.
- Frutuoso R, Lima A, Teodoro AC. 2021. Application of remote sensing data in gold exploration: targeting hydrothermal alteration using Landsat 8 imagery in northern Portugal. Arab J Geosci. 14(6):459.
- Gabr SS, Hassan SM, Sadek MF. 2015. Prospecting for new gold-bearing alteration zones at El-Hoteib area, South Eastern Desert, Egypt, using remote sensing data analysis. Ore Geol Rev. 71:1–13.
- Ghaeminejad H, Abedi M, Afzal P, Zaynali F, Yousefi M. 2020. A fractal-based outranking approach for integrating geochemical, geological, and geophysical data. Bollettino di Geofisica Teorica ed Applicatapp. 61(4):555–588.
- Guha S, Govil H, Tripathi M, Besoya M. 2018. Evaluation Crosta technique for alteration mineral in Malanjkhand copper mines, India, The International Archives of the Photogrammetry, Remote Sensing and Spatial Information Sciences, Volume XLII-5, ISPRS TC V Mid-term Symposium. Int Arch Photogramm Remote Sens Spatial Inf Sci. XLII-5”,:251–254. November 2018, Dehradun, India.
- Harvey A, Fotopoulos G. 2016. Geological mapping using machine learning algorithms. Int Arch Photogramm Remote Sens Spatial Inf Sci. XLI-B8:423–430. 5194/isprsarchives-XLI-B8-423-2016
- Honarmand M, Ranjbar H, Shahabpour J. 2011. Application of spectral analysis in mapping hydrothermal alteration of the Northwestern Part of the Kerman Cenozoic Magmatic Arc. Iran. J Sci Islamic Republic of Iran. 22(3):221–238.
- Hosseini MR, Ghaderi M, Alirezaei S, Sun W. 2017. Geological characteristics and geochronology of the Takht-e-Gonbad copper deposit, SE Iran: a variant of porphyry type deposits. Ore Geol Rev. 86:440–458.
- Kamali AA, Moayyed M, Amel N, Hosseinzadeh MR, Mohammadiha K, Santos JF, Brenna M. 2018. Post-mineralization, cogenetic magmatism at the Sungun Cu-Mo porphyry deposit (Northwest Iran): protracted melting and extraction in an arc system. Minerals. 8(12):588.
- Khaleghi M, Ranjbar H. 2011. Alteration mapping for exploration of porphyry copper mineralization in the Sarduiyeh Area, Kerman Province, Iran. Using ASTER SWIR Data. Australian J Basic Appl Sci. 5(8):61–69.
- Khan-Nazer NH, Emami MH, Ghaforie M. 1995. Geological map of Chahargonbad. Geological Survey of Iran Publication, Tehran, Iran. (1: 100,000).
- Köhler M, Hanelli D, Schaefer S, Barth A, Knobloch A, Hielscher P, Cardoso-Fernandes J, Lima A, Teodoro AC. 2021. Lithium potential mapping using artificial neural networks: a case study from Central Portugal. Minerals. 11(10):1046.
- Kruse FA, Boardman JW, Huntington JF. 2003. Comparison of airborne hyperspectral data and EO-1 Hyperion for mineral mapping. IEEE Trans Geosci Remote Sensing. 41(6):1388–1400.
- Lary DJ, Alavi AH, Gandomi AH, Walker AL. 2016. Machine learning in geosciences and remote sensing. Geosci Front. 7(1):3–10.
- Lee J, Jang H, Yang J, Yu K. 2017. Machine learning classification of buildings for map generalization. IJGI. 6(10):309.
- Lillesand TM, Kiefer RW. 2008. Remote sensing and image interpretation. New York: John Wiley and Sons; p. 756.
- Loughlin WP. 1991. Principal component analysis for alteration mapping. Photogramm Eng Remote Sens. 57:1163–1169.
- Malczewski J. 1999. GIS and multicriteria decision analysis. New York: John Wiley & Sons.
- Malczewski J. 2006. Ordered weighted averaging with fuzzy quantifiers: GIS-based multicriteria evaluation for land-use suitability analysis. Int J Appl Earth Observ Geoinform. 8(4):270–277.
- Manuel R, Brito MDG, Chichorro M, Rosa C. 2017. Remote sensing for mineral exploration in Central Portugal. Minerals. 7(10):184.
- Maxwell AE, Warner TA, Fang F. 2018. Implementation of machine learning classification in remote sensing: an applied review. Int J Remote Sens. 39(9):2784–2817. 2018.1433343
- Mehdizadeh Tehrani S, Fotoohi V, Naaimi Ghasabian N. 1981. Remote sensing investigation in Anar, Shahrebabak, Dehaj and Rafsanjan- I geological sheet (1: 100000 scale), Urumieh Dokhtar project. Geological survey of Iran, open report.
- Mitchell HB, Estrakh DD. 1997. A modified OWA operator and its use in lossless DPCM image compression. Int J Unc Fuzz Knowl Based Syst. 05(04):429–436.
- Montanaro M, Lunsford A, Tesfaye Z, Wenny B, Reuter D. 2014. Radiometric calibration methodology of the Landsat 8 thermal infrared sensor. Remote Sens. 6(9):8803–8821.
- Moradi M, Basiri S, Kananian A, Kabiri K. 2015. Fuzzy logic modeling for hydrothermal gold mineralization mapping using geochemical, geological, ASTER imageries and other geo-data, a case study in Central Alborz, Iran. Earth Sci Inform. 8(1):197–205.
- Moradpour H, Rostami Paydar G, Pour AB, Valizadeh Kamran K, Feizizadeh B, Muslim AM, Shawkat Hossain M. 2022. Landsat-7 and ASTER remote sensing satellite imagery for identification of iron skarn mineralization in metamorphic regions. Geocarto Int. 37(7):1971–1998.
- Ni C, Zhang S, Chen Z, Yan Y, Li Y. 2017. Mapping the spatial distribution and characteristics of lineaments using fractal and multifractal models: A case study from Northeastern Yunnan Province. Sci Rep. 7(1):10511.
- Nykänen V, Lahti I, Niiranen T, Korhonen K. 2015. Receiver operating characteristics (ROC) as validation tool for prospectivity models — A magmatic Ni–Cu case study from the Central Lapland Greenstone Belt, Northern Finland. Ore Geol Rev. 71:853–860.
- Nykänen V. 2008. Spatial data analysis as a tool for mineral prospectivity mapping. Espoo: Geol Surv Finland. 27:92.
- Parsa M, Maghsoudi A, Yousefi M, Sadeghi M. 2016. Prospectivity modeling of porphyry–Cu deposits by identification and integration of efficient mono-elemental geochemical signatures. J. Afr. Earth Sci. 114:228–241.
- Perelló J, Sillitoe RH, Creaser RA. 2020. Mesoproterozoic porphyry copper mineralization at Mamainse Point, Ontario, Canada in the context of Midcontinent rift metallogeny. Ore Geol Rev. 127:103831.
- Pour AB, Park TS, Park Y, Hong JK, Zoheir B, Pradhan B, Ayoobi I, Hashim M. 2018c. Application of multi-sensor satellite data for exploration of Zn-Pb sulfide mineralization in the Franklinian Basin, North Greenland. Remote Sens. 10(8):1186.
- Pour AB, Park Y, Crispini L, L¨aufer A, Hong JK, Park T-YS, Zoheir B, Pradhan B, Muslim AM, Hossain MS, et al. 2019. Mapping listvenite occurrences in the damage zones of Northern Victoria Land, Antarctica using ASTER satellite remote sensing data. Remote Sens. 11(12):1408.
- Pour AB, Park Y, Park TS, Hong JK, Hashim M, Woo J, Ayoobi I. 2018a. Evaluation of ICA and CEM algorithms with Landsat-8/ASTER data for geological mapping in inaccessible regions. Geocarto Int. 34(7):785–816. 10.1080/10106049.2018.1434684
- Pour AB, Park Y, Park TS, Hong JK, Hashim M, Woo J, Ayoobi I. 2018b. Regional geology mapping using satellite-based remote sensing approach in Northern Victoria Land, Antarctica. Polar Sci. 16:23–46. 10.1016/j.polar.2018.02.004
- Pour BA, Hashim M, Makoundi C, Zaw K. 2016. Structural mapping of the Bentong-Raub suture zone using PALSAR Remote Sensing Data, Peninsular Malaysia: implications for sediment-hosted/orogenic gold mineral systems exploration. Resour Geol. 66(4):368–385.
- Pour BA, Hashim M, van Genderen J. 2013. Detection of hydrothermal alteration zones in a tropical region using satellite remote sensing data: Bau gold field, Sarawak, Malaysia. Ore Geol. Rev. 54:181–196.
- Pour BA, Hashim M. 2011. Identification of hydrothermal alteration minerals for exploring of porphyry copper deposit using ASTER data, SE Iran. J Asian Earth Sci. 42(6):1309–1323.
- Pour BA, Hashim M. 2015a. Integrating PALSAR and ASTER data for mineral deposits exploration in tropical environments: a case study from Central Belt, Peninsular Malaysia. Int J Image and Data Fusion. 6(2):170–188.
- Pour BA, Hashim M. 2015b. Hydrothermal alteration mapping from Landsat-8 data, Sar Cheshmeh copper mining district, south-eastern Islamic Republic of Iran. J Taibah Univ Sci. 9(2):155–166.
- Pournamdari M, Hashim M, Pour AB. 2014. Spectral transformation of ASTER and Landsat TM bands for lithological mapping of Soghan ophiolite complex, south Iran. Adv Space Res. 54(4):694–709.
- Riquelme R, Tapia M, Campos E, Mpodozis C, Carretier S, Gonzalez R, Munoz S, Fernandez-Mort A, Sanchez C, Marquardt C. 2018. Supergene and exotic Cu mineralization occur during periods of landscape stability in the Centinela Mining District, Atacama Desert. Basin Res. 30(3):395–425.
- Sabins FF. 1999. Remote sensing for mineral exploration. Ore Geol. Rev. 14(3-4):157–183.
- Safari M, Pour BA, Maghsoudi A, Hashim M. 2017. Targeting hydrothermal alteration utilizing Landsat-8 and ASTER data in Shahre-E-Babak, IRAN. Int Arch Photogramm Remote Sens Spatial Inf Sci. XLII-4/W5:153–157. Volume XLII-4/W5, GGT 2017, 4 October 2017, Kuala Lumpur, Malaysia.
- Shirmard H, Farahbakhsh E, Muller D, Chandra R. 2022. A review of machine learning in processing remote sensing data for mineral exploration. Remote Sens Environ. 268(2–3):112750.
- Shirmard H, Farahbakhsh E, Pour BA, Muslim AM, Müller RD, Chandra R. 2020. Integration of selective dimensionality reduction techniques for mineral exploration using ASTER satellite data. Remote Sens. 12(8):1261.
- Sillitoe RH. 2010. Porphyry copper systems. Econ Geol. 105(1):3–41.
- Sun T, Chen F, Zhong L, Liu W, Wang Y. 2019. GIS-based mineral prospectivity mapping using machine learning methods: A case study from Tongling ore district, eastern China. Ore Geol Rev. 109:26–49.
- Tripathi NK, Gokhale KVGK, Siddiqui MU. 2000. Directional morphological image transforms for lineament extraction from remotely sensed images. Int J Remote Sens. 21(17):3281–3292.
- Turin GL. 1960. An introduction to matched filters. IEEE Trans Inform Theory. 6(3):311–329.
- Varouchakis EA, Kamińska-Chuchmała A, Kowalik G, Spanoudaki K, Graña M. 2021. Combining geostatistics and remote sensing data to improve spatiotemporal analysis of precipitation. Sensors. 21(9):3132.
- Vu TD, Ni C, Li WC, Truong MH. 2019. Modified index-overlay method to assess spatial–temporal variations of groundwater vulnerability and groundwater contamination risk in areas with variable activities of agriculture developments. Water. 11(12):2492.
- Wang G, Du W, Carranza EJM. 2017. Remote sensing and GIS prospectivity mapping for magmatic-hydrothermal base- and precious-metal deposits in the Honghai district, China. J. African Earth Sci. 128:97–115.
- Wang YY, Xiao Y. 2018. Fluid-controlled element transport and mineralization in subduction zones. Solid Earth Sci. 3(4):87–104.
- Wu M, Zhou K, Wang Q, Wang J. 2019. Mapping hydrothermal zoning pattern of porphyry Cu deposit using absorption feature parameters calculated from ASTER data. Remote Sens J. 11(14):1729.
- Yager RR, Filev D. 1998. Operations for granular computing: mixing words and numbers. in Proceedings of the IEEE International Conference on Fuzzy Systems, p. 123–128. Anchorage, Alaska, USA.
- Yésou H, Besnus Y, Rolet J. 1993. Extraction of spectral information from Landsat TM data and merger with SPOT panchromatic imagery–A contribution to the study of geological structures. ISPRS J Photogramm Remote Sens. 48(5):23–36.
- Yousefi M, Carranza EJM, Kamkar-Rouhani A. 2013. Weighted drainage catchment basin mapping of stream sediment geochemical anomalies for mineral potential mapping. J Geochem Explor. 128:88–96.
- Yousefi M, Carranza EJM. 2015a. Fuzzification of continuous-value spatial evidence for mineral prospectivity mapping. Comput Geosci. 74:97–109.
- Yousefi M, Carranza EJM. 2015b. Prediction-area (P-A) plot and C-A fractal analysis to classify and evaluate evidential maps for mineral prospectivity modeling. Comput Geosci. 79:69–81.
- Yousefi M, Carranza EJM. 2016. Data-driven index overlay and Boolean logic mineral prospectivity modeling in greenfields exploration. Nat Resour Res. 25(1):3–18.
- Yousefi M, Carranza, EJM. 2016. Union score and fuzzy logic mineral prospectivity mapping using discretized and continuous spatial evidence values. J Afri Earth Sci. 128:1–14.
- Yousefi M, Kamkar-Rouhani A, Carranza E, J, M. 2012. Geochemical mineralization probability index (GMPI): a new approach to generate enhanced stream sediment geochemical evidential map for increasing probability of success in mineral potential mapping. J Geochem Explor. 115:24–35.
- Zarasvandi A, Liaghat S, Zentilli M. 2005. Porphyry copper deposits of the Urumieh-Dokhtar magmatic arc, Iran. In: Porter TM (ed) Super porphyry copper & gold deposits: a global perspective. PGC, Adelaide. 2:441–452.
- Zhang T, Yi G, Li H, Wang Z, Tang J, Zhong K, Li Y, Wang Q, Bie X. 2016. Integrating data of ASTER and Landsat-8 OLI (AO) for hydrothermal alteration mineral mapping in duolong porphyry Cu-Au deposit, Tibetan Plateau, China. Remote Sens. 8(11):890.
- Zoheir B, Emam A, Wahed MA, Soliman N. 2019. Multispectral and radar data for the setting of gold mineralization in the South Eastern Desert, Egypt. Remote Sens. 11(12):1450.