
 ?Mathematical formulae have been encoded as MathML and are displayed in this HTML version using MathJax in order to improve their display. Uncheck the box to turn MathJax off. This feature requires Javascript. Click on a formula to zoom.
Abstract
Water stress is an everyday issue in developing countries and especially in Foumban, a municipality located in the West Region of Cameroon between longitudes 10°40’-11°10’E and latitudes 05°30’-05°55’N. The failure of the water distribution system in the Municipality of Foumban (MoF) led the citizens as well as the municipal authorities to exploit groundwater. Unfortunately, an extensive hydrogeophysical field campaign, with incidental cost, is required because the groundwater potential is not priorly assessed. The main objective of this article is to demarcate groundwater potential zones of MoF. For this, six thematic layers contributing to groundwater occurrences are combined using analytical hierarchy process (AHP) on a GIS environment to produce a sound groundwater potential map. This map is classified into three zones: low potential for 39.06%, acceptable potential for 27.27% and high potential for 33.68% of the study area. This may help to increase the rate of productive wells (by focusing hydrogeophysical investigation on areas with high groundwater potential) using little financial resources.
1. Introduction
Water efficiency, water productivity and waste water re-use for domestic and productive activities are the main challenges related to water resource management in developed countries. Yet, developing countries’ main challenges still include the exploration as well as the sustainable exploitation of groundwater resources. Exploration of groundwater resources generally requires important funding because of the lack of prior investigation demarcating areas with high groundwater potential. As a result, number of hydrogeophysical campaigns are conducted on inadequate sites resulting on noncompliant results and lost of time and money (Perilli et al. Citation2021). Consequently, a lot of water infrastructures are implemented without hydrogeophysical investigation, leading to unproductive boreholes, boreholes with low yield and temporary productivity. The situation is the same in Cameroon and especially in the Municipality of Foumban (MoF) that gives room to this study. In this region, public and private actors, including international NGOs, have been drilling boreholes for households, schools, health centres or other public offices. But the deficiency of abovementioned prior investigations leads to hundreds unproductive boreholes. A large number of other punctually productive boreholes dry up seasonally or definitively (Perilli et al. Citation2021). Yet, remote sensing (RS) is an alternative low-cost and effective tool to assess groundwater potential priorly to any exploration project (Aliabad et al. Citation2018; Achu et al. Citation2020; Ahmad et al. Citation2020; Hamdani and Baali Citation2020; Gyeltshen et al. Citation2020; Karimi and Zeinivand Citation2021).
It is important to delineate areas with high groundwater potential. This is possible by using a combined multi-criteria analysis (MCA), geographic information system (GIS) and remote sensing (RS) approach. RS and GIS techniques are said to be quick and simple for investigating groundwater potential zone whatever the geological settings, and are widely used through the world. Dinesh Kumar et al. (Citation2007) combined remote sensing and Geographic Information System (GIS) to delineate the groundwater-potential zones of the Muvattupuzha river basin in India. Results depicted that approximatively 50% of the area categorized as very good or good potential zones. Achu et al. (Citation2020) mapped groundwater potential zones and identified appropriate site-specific recharge mechanisms in the context of tropical basins. Ahmad et al. (Citation2020) processed and mapped groundwater potential zones of the Ethiopian Beshilo River basin on a GIS environment. Jesiya and Gopinath (Citation2019) combined Fuzzy based Agnatical Hierarchy Process with GIS to address the response of various hydrogeological indicators towards attenuation of pollutant to subsurface hydrological regime in southern India. It was found that 71% of urban and 22% of peri-urban zones of the study area are (highly) vulnerable. One year later, they applied fuzzy based multi-criteria decision making (MCDM)-geospatial framework (GIS-Fuzzy-AHP) to assess groundwater potential of the same region. They pointed out four main zones and depicted that 10% of the peri-urban and 34% of the urban zones of the region have a very good potential (Jesiya and Gopinath Citation2020). Gyeltshen et al. (Citation2020) combined geospatial technology and geophysical approach to assess groundwater potential zones in Dehradun. Aykut (Citation2021) used GIS and analytic hierarchy process (AHP) to determine groundwater potential zones in Edirne-Kalkansogut. Karimi and Zeinivand (Citation2021) used GIS techniques to integrate thematic layers and runoff map of a spatially distributed model to identify potential rainwater harvesting suitability. Ifediegwu (Citation2022) assessed groundwater potential zones in Latifia district using AHP and GIS techniques. Bhadran et al. (Citation2022) used GIS-Fuzzy-Analytical Hierarchy Process (FAHP) to evaluate the groundwater potential of the Karuvannur River Basin in the southern part of India. Globally, the aquifer potential of this region was acceptable.
The combined use of GIS and RS for groundwater exploration is valuable in developing countries because of its relative low-cost compared to geophysical technologies which are said to be time-consuming and costly (Kwami et al. Citation2019; Harish and Haseena Citation2020). RS and GIS technologies have the advantage of investigating large areas with little financial resources and quickly (Ifediegwu Citation2022). An adequate processing of several spatial parameters such as slope, drainage density, land use/land cover (LULC), lineament density, topographic wetness index (TWI) and rainfall on a GIS environment in combination with a MCD method such as AHP enables delineating groundwater potential zones (Aliabad et al. Citation2018; Hamdani and Baali Citation2020; Aykut Citation2021; Karimi and Zeinivand Citation2021). The main output of such a processing is a sound map of areas with high probability of locating important quantity of groundwater, which is very useful for planners, stakeholders, decisionmakers and municipal authorities. The present investigation mainly aims at using AHP on a GIS environment to demarcate groundwater potential zones of MoF for a sustainable management of (ground)water resources in this region. For this, six layers (slope, drainage density, LULC, lineament density, TWI and rainfall) will be used. It stands as the first and unique scientific contribution to the sustainable management of groundwater resources in this municipality. Hence, the outcome will support planners, stakeholders, decisionmakers and municipal authorities in their ‘Municipal Strategy Document (MSD)’ by providing them with thematic maps useful to improve borehole productivity by identifying the priority areas where to concentrate the geological and hydrogeological investigation during groundwater exploration. Citizens will also be able to enjoy boreholes with high yield using little financial resources.
2. Materials and methods
2.1. A brief description of the study area
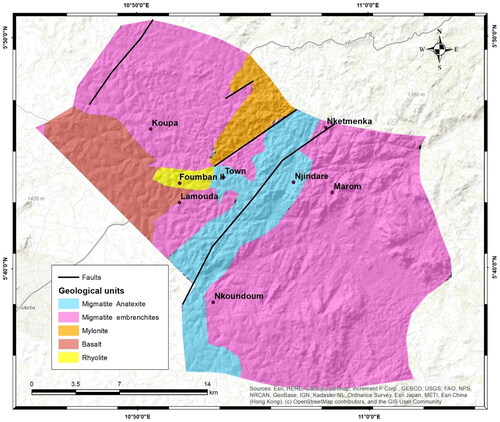
MoF, the previous capital of the Bamun Kingdom, is the main city of the Noun Division, sited in the West Region of Cameroon (). Located at 360 km north-east of the capital Yaoundé, this area belonging to the Bamun Plateau extends between 720 and 1300 m.a.s.l of altitude, longitudes 10°40′-11°10’E and latitudes 05°30′-05°55’N. With its 33 villages, MoF has a population density of 383 inhabitants per square kilometre. The entire area is characterized by highlands (273.33 km2) in the northern and southwestern parts, and by pediments (81.80 km2) and lowlands (97.06 km2) in the central and eastern parts (). It is dissected by a deep V-shaped valley (118.06 km2). The drainage network of streams feeds the Nchi River that is a left tributary of the Mbam River (Mfonka et al. Citation2021; Arétouyap et al. Citation2017, Citation2019, Citation2022). The tropical climate with a mean annual rainfall of 1533 mm and monthly temperatures varying from 17.3 to 20.7 °C includes a rainy season which starts in Mid-March and ends in October, and a dry season which expands from November to Mid-March. The land cover is mainly represented by forest, shrub savannah and savannah vegetation. In the last decades, the length of rain season has shortened, rainfall can be very extreme and the tropical forest is constantly being replaced by savannah/agricultural land or bare soil/built-up area. The area belonging to the so-called Foumban-Banyo shear zone is represented by a Proterozoic crystalline basement, mainly made up of metamorphic and plutonic rocks including migmatite embrechites, a mylonitic band and migmatites anatexite. These rocks are overlaid and/or intruded by tertiary basalt lava and rhyolite dikes. All these units, and therefore mountains, plateaus and lowlands, are usually draped by a thick lateritic soil overlying 30 to 60 or even 80 m thick of saprolite (). As a result, two aquifer groups are prospected in the region: a shallow unconfined aquifer hosted within the saprolite and the underlying saprorocks, and a deeper aquifer hosted by the fractured crystalline basement (Mfonka et al. Citation2021).
Figure 1. The study area, MoF, presented by its drainage map.
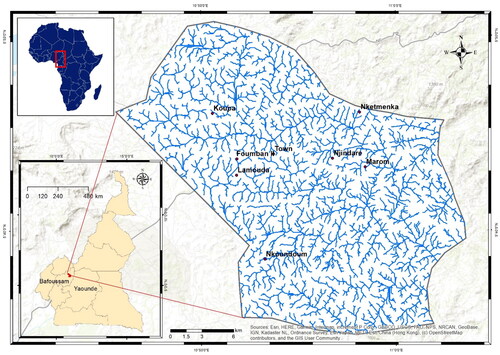
Figure 2. The geomorphological map of MoF.
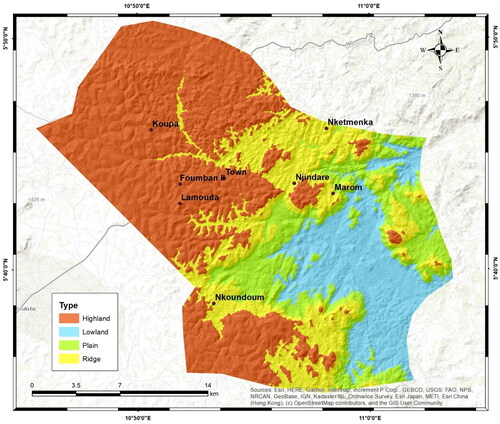
Figure 3. The geological map of MoF.
2.2. Parameters affecting groundwater potential
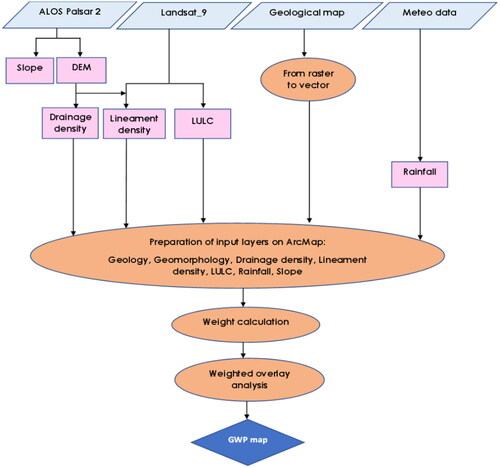
There is no underground flowing river. Groundwater results mainly from two phenomena: storage (governed by geology or soil characteristics, landform, TWI, drainage and lineament densities) and recharge or water infiltration which is controlled by LULC and precipitation (Shao et al. Citation2020; Ifediegwu Citation2022). Abovementioned parameters are then required for groundwater modelling. This investigation produced, combined and processed six thematic layers (slope, drainage density, LULC, lineament density, TWI and rainfall) on a GIS environment to map groundwater potential. The software used is ArcGIS 10.8 where all layers and maps were displayed in UTM Projection Zone 32, Datum WGS84. Vectors layers obtained as rasters are converted to polygons. The approach is summarised in .
Figure 4. Flowchart for GWP investigation.
2.3. Database and processing on GIS environment
The main database used in this study is made up of a geology map amended and adapted from Tchakounté et al. (Citation2017), meteorological data (WorldClim 2.1, January 2020) downloaded from http://worldclim.org, Landsat_9 (LC91860562022062LGN00, acquired on March 3, 2022) for LULC, and ALOS Palsar 2 (AP_05643_FBS_F0100_RT1) for slope map. Rainfall data downloaded from were compliant with ground data collected from the two existing rain gauges. The six parameters used for groundwater potential elaboration are derived from those raw data using ArcGIS 10.8.
For line features extraction, the ALOS Palsar raster was enhanced by conducting a principal component analysis (Aretouyap et al. Citation2020). The output was then used for automated lineament extraction using the LINE module in PCI Geomatica software. Additional literature on lineament processing can be found in Aretouyap et al. (Citation2020) and Poufone et al. (Citation2022).
The slope and geomorphology maps are generated from the digital elevation model of ALOS Palsar 2 with a 12.5 m spatial resolution. The same scene was used to produce the drainage map, then the drainage density map in ArcGIS 10.8 (Jesiya and Gopinath Citation2020; Aretouyap et al. Citation2022).
The LULC map results from supervised classification of a composite band made of bands 1–7 of the Landsat_9 scene described above.
Rainfall map is subset according the study area geometry from the WorldClim 2.1 database (January 2020) downloaded from http://worldclim.org. Then, Thiessen approach was used to analyse the extracted data in ArcGIS 10.8.
All those maps were converted into raster format and received proper weights according to the relevance of their contribution to groundwater occurrence. Those weights were used for AHP.
2.4. Multi-criteria decision assessment utilizing AHP
From the pairwise comparison between various criteria, AHP developed by Saaty (Citation1990) help take complex decision. In this study, criteria selected for assessing groundwater potential are slope, drainage density, LULC, lineament density, TWI and rainfall. First, a pairwise comparison matrix (EquationEquation 1(1)
(1) ) is used to transform the thorny decision-making procedure between those criteria in a simple and single level. Key criteria are compared using Saaty’s 1–9 significance scale ().
(1)
(1)
The elements of this judgement matrix
Table 1. Constant rating scale of Saaty’s AHP.
Then, normalised weights are calculated using the criteria geometric mean (EquationEquation 2(2)
(2) ).
(2)
(2)
In this equation, Gi and Wn represent respectively the geometric mean of the ith row and the Eigen vector of the judgment. Finally, EquationEquation 3(3)
(3) is used to assess the consistency of the normalised criteria weights. Consistency ratio (CR) derived from this equation should be lower than 0.10 for the weights to be deemed consistent. Otherwise, the pairwise comparisons must be revisited.
(3)
(3)
CI, determined by EquationEquation 4(4)
(4) , is the consistency index and RI, displayed in , is the random consistency index (Saaty Citation1990).
(4)
(4)
Table 2. The RI ratio of the distinct values of n.
λmax, derived from EquationEquation 5(5)
(5) , is the maximum eigenvalue of the judgment matrix.
(5)
(5)
The pairwise comparison matrix and normalised weight values of all key criteria are presented in . CR values are compliant (less than 0.1).
Table 3. Normalised weights of different factors for pairwise comparison.
2.5. Criteria standardisation and groundwater potential zones mapping
It is imperative to standardise data in order to summarise all decision criteria to a common scale of measurement (Yıldırım Citation2021). In this study, the rating values range from 1 to 5 (very low, low, moderate, high and very high) as presented in . Then, the groundwater potential index (GPI) is calculated using the weighted linear combination aggregation method for n criteria (Malczewski Citation1999; EquationEquation 6(6)
(6) ).
(6)
(6)
where n is the number of criteria, wi and ri represent respectively the relative weight and the standardised rating of criterion i.
Table 4. The six parameters used for GWP assessment ranked in descending order.
3. Results
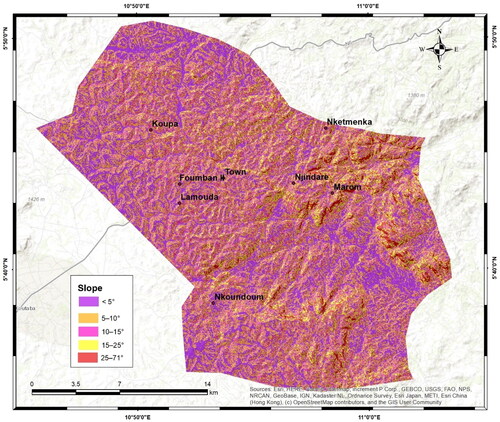
3.1. Slope
In this study, slope is split into five classes: < 5° (very potential), 5–10° (high potential), 10–15° (moderate potential), 15–25° (poor potential) and 25–71° (very poor potential) as displayed in . Those classes cover respectively 11.71%, 23.89%, 46.24%, 12.45% and 6.29% of the Foumban subdivision. Based on these features, slope is the first criterion contributing to groundwater potential with a normalized weight of 0.4082.
Figure 5. Distribution and extension of the slope classes of the study area.
3.2. Drainage density
In this study, drainage density is the second more important criterion with a normalized weight of 0.2041. It is classified into five categories (): very low, low, moderate, high and very high, covering respectively 12.41% (71.49 km2), 26.93% (155.20 km2), 29.34% (169.10 km2), 22.72% (130.95 km2) and 8.60% (49.55 km2).
Figure 6. Distribution and extension of the drainage classes of the study area.

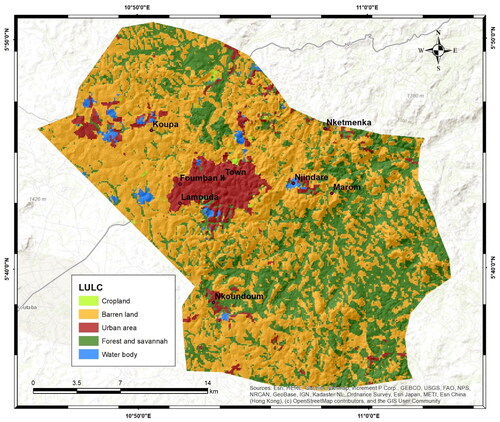
3.3. Land use/land cover
In this study, LULC has a normalised weight of 0.1361 and is ranked third out of six selected criterium. It is classified into five categories (): cropland (less than 1% of the subdivision), barren land (59.11% of the subdivision), forest and savannah (32.31% of the subdivision), urban and periurban area (7.41% of the subdivision) and water body (1.26% of the subdivision). Consequently, barren land and both urban and peri-urban areas promote runoff, and the remain areas infiltration or storing of surface water.
Figure 7. Distribution and extension of the LULC classes of the study area.
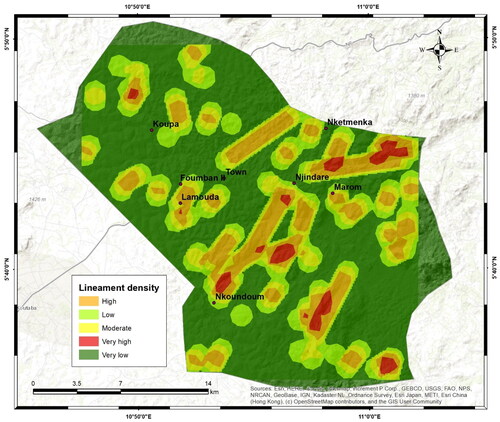
3.4. Lineament density
In this study, lineament density is the fourth important criterion in the groundwater potential assessment. Its pattern is classified in five groups (). The most important class is ‘very low’, covering 328.49 km2 (57%). ‘Very high’ is dotted throughout the region, covering 13.96 km2 (2.42%), successively surrounded by ‘high’ (74.7 km2), ‘moderate’ (77.87 km2) and ‘low’ (80.36 km2). Large part of the Foumban subdivision is characterised by a very coarse (57% − 328.49 km2) or coarse (13,94% − 80.36 km2) lineament density. Consequently, for the 70% of the investigated area, infiltration is poorly promoted by tectonic structures. On the contrary, infiltration is promoted in the NE-SW part of the study area with high (74.7 km2) or very high (2.42% − 13.96 km2) lineament density.
Figure 8. Distribution and extension of the lineament density classes of the study area.
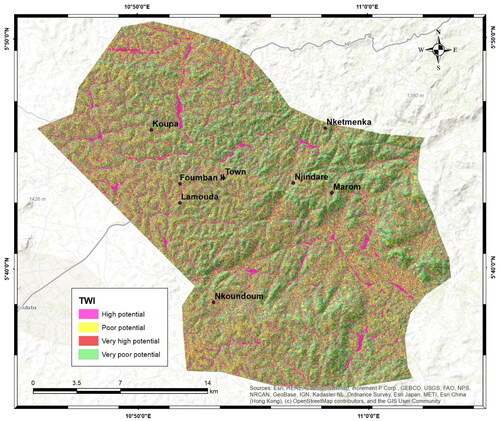
3.5. Topographic wetness index (TWI)
TWI values range from 1.70 to 24.13 in MoF. TWI is the fifth most important criterion with a weight of 0.0816. it is classified in four groups: very poor potential (1.70–5.48), poor potential (5.48–7.50), high potential (7.50–10.93) and very high potential (10.93–24.13). The areas with very low TWI values are dominant ().
Figure 9. Distribution and extension of the topographic wetness index of the study area.
3.6. Rainfall
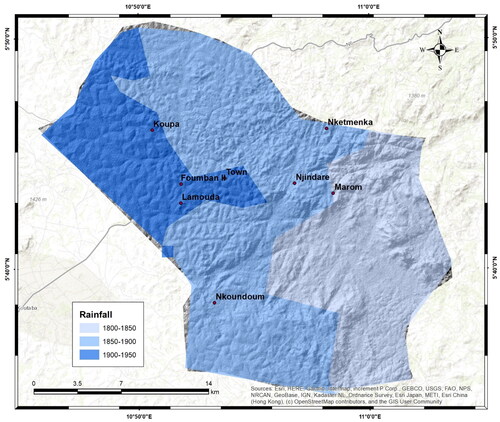
In terms of relative weighting, rainfall is the sixth criterion, with a normalized weight of 0.06. Actually, rainfall is a paramount contributing parameter to the groundwater occurrence. But it is misclassified in this study because of the LULC pattern and geological setting that do not allow judicious vertical penetration of surface water. Yet, important pluviometry is synonym of high groundwater potential (Harish and Haseena Citation2020). The mean annual rainfall of Foumban ranges between 1800 and 1950 mm, divided into three classes ().
Figure 10. Distribution and extension of the rainfall classes of the study area.
3.7. Groundwater potential zones
All layers selected to assess groundwater potential were individually rated and multiplied by AHP-derived criteria weights. Results are summed up to generate the groundwater potential distribution map (). Hence, the groundwater potential index values are computed and range from 0.79 to 6.30, then organised into three classes: poor, acceptable and high potential. A comparison of the groundwater potential map with other thematic maps reveals that poor-potential zones include low-rainfall areas (southeast), high-drainage density areas and low-lineament density, while high and acceptable potential zones are dotted throughout the study area. Roles of LULC and TWI are highlighted. The geological setting also has a significant influence on groundwater potential. High-groundwater potential zones include areas covered by mylonite, rhyolite and old basalt. Quantitatively, poor potential-zones cover 225.12 km2, acceptable-potential zones 157.14 km2 and high-potential zones194.12 km2 in the whole MoF.
Figure 11. Thematic map of the groundwater potential zones distribution in MoF.
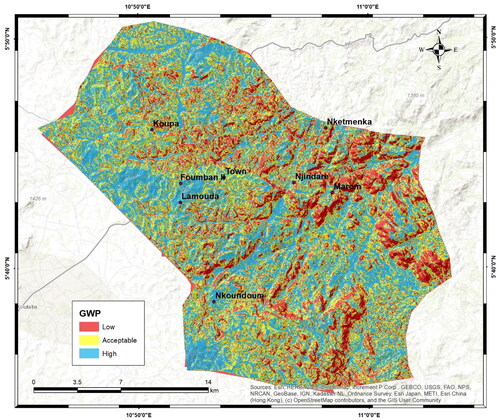
For a sustainable management of water resources, it is very important to locate and demarcate groundwater potential zones. It assists decision-makers, planners and policymakers in ensuring that the groundwater resource is protected from both quantity and quality influences. This work aimed among others at identifying the target areas where to concentrate the geological and hydrogeological field surveys in order to select the profiles along which to first carry out the geoelectric surveys and then choose the most suitable sites for drilling wells for increasing water supply in the subdivision of Foumban. The poor potential-zones account for 39.06%, acceptable-potential zones for 27.27% and high-potential zones for 33.68% of the study area.
During the field survey conducted for groundwater potential map validation, existing unproductive (dried-up or too deep) wells are effectively located in low- groundwater potential zones. Productive wells and boreholes are also found in high- groundwater potential zones. Unfortunately, those boreholes and wells were drilled without preliminary hydrogeophysical investigation to record key parameters such as charge and discharge rate, transmissivity, hydraulic conductivity, porosity, etc. As a result, it is not possible to establish a strong relationship between the groundwater potential distribution with those hydro-parameters. Palliative investigations will be carried out soon. Furthermore, this study is the pioneer one in the region. There are no previous results for comparison. However, the spatial distribution of groundwater potential is compliant with various contributing layers.
4. Discussion
In most municipalities in Cameroon and in other French-speaking countries, groundwater exploration does not rely on prior appropriate investigations. Therefore, the positive drilling rate is low and there is an important number of boreholes that dry up in a very short time. The processing of satellite images by RS is very useful to improve this rate because it first of all allows to identify the priority areas where to concentrate the hydrogeological and geoelectric surveys. It makes easy the identification of the adequate drilling sites, and reduce costs and duration of aquifer exploration. This paper explains how municipalities of developing countries can both improve groundwater exploration and increase groundwater supply at local scale, by demarcating groundwater potential zones. RS and AHP are combined on a GIS environment to elaborate groundwater potential map from six thematic layers. Those thematic layers play an important role in groundwater occurrence. Up to 33.68% of the study area is characterized by a good groundwater potential, meaning that infiltration of surface water and in turn aquifer recharge are promoted there. Zones with moderate groundwater potential represent 27.27% of the study area are characterized by relatively lower infiltration and storage capacity. This capacity is lower in 39.06% of the study area where groundwater potential is poor.
Taking into account the characteristic of the rainy seasons and the frequent occurrence of very heavy rainstorms, slope play a key role on the runoff/infiltration rate (Zghibi et al. Citation2020). Slope is an important parameter of groundwater occurrence. It governs the surface water runoff and regulates the amount of water infiltrated. Indeed, runoff velocity is proportional to the area slope. As a result, surface water stagnates for a long time in low-slope areas, increasing the rate of infiltration to recharge aquifers. Our results are similar to Satapathy and Syed (Citation2015). Approximately like slope, drainage density provides key information on the capacity of surface water to infiltrate. Contrary to the lineament density, high drainage density implies low permeability and runoff promotion, and low drainage density means hampered runoff. Shao et al. (Citation2020) linked permeability of the underlying rocks to the drainage density. High drainage density means important runoff velocity and low permeability. Hence, high-drainage density areas have poor contribution to the groundwater potential while low-drainage density areas have important contribution (Rajaveni et al. Citation2017). LULC determines the main characteristics of an area cover, including wetness and vegetation. Hence, it regulates some phenomena (e.g. surface water infiltration, runoff, evapotranspiration, condensation) and significantly impacts groundwater recharge and storage (Albhaisi et al. Citation2013; Ifediegwu Citation2022). The framework of the lineaments represents all the geological discontinuities and in particular, they are the topographical witness of the fractures and faults. Consequently, areas with high lineament density promote water infiltration, the amount of infiltrated water is reduced in areas with low lineament density (Lentswe and Molwalefhe Citation2020; Tolche Citation2021). In the groundwater potential assessment, lineaments are considered in terms of their density. Water circulation/infiltration is more important in areas with high lineament density, leading to a higher groundwater potential.
Other potential contributing parameters not considered in the groundwater potential elaboration are geological setting and geomorphology of the region. In fact, the geological setting is involved in the mechanism of groundwater occurrence as it plays an important role in surface water infiltration and groundwater storage. In fact, rock nature and quality have a great influence on groundwater occurrence. For example, porous and permeable rocks may give room to high groundwater potential (Shaban et al. Citation2006; Allafta et al. Citation2020). The five main geological units are mylonite, rhyolite, basalt, migmatite anatexite and migmatite embrenchites. Their respective areas are 22.64 km2 (3.93%), 6.79 km2 (1.18), 52.19 km2 (9.06%), 472.11 km2 (81.92%) and 79.82 km2 (13.85%) (). The local geomorphology is made up of four different classes (): lowlands covering 16.84% of the study area, plains covering 14.19% of the study area, ridges (20.49%) and highlands (47.43%). Highlands (273.33 km2) expand on the northern and southwestern parts of the region, lowlands (97.06 km2) expand on the southeast, while ridges (118.06 km2) and plains (81.80 km2) are distributed between those abovementioned features. These parameters are not considered when elaborating the groundwater potential map for two main reasons: their respective factors have approximatively the same contribution to groundwater potential, and they are also reflected some other parameters such as slope and lineament density.
An analysis of the spatial distribution of the groundwater potential map in comparison with the six thematic map depicts strong correlations. Areas with high groundwater potential matches with gentle steep or flat terrain (slope < 15°), low drainage density, high lineament density, important rainfall and higher TWI. Those areas also covered by water body and cropland or vegetation. Although there is no previous similar investigation in the region for results comparison, nevertheless, the findings of this paper are analogous to those obtained in other tropical regions with same physical characteristics (Albhaisi et al. Citation2013; Rajaveni et al. Citation2017; Satapathy and Syed Citation2015; Aliabad et al. Citation2018; Achu et al. Citation2020; Jesiya and Gopinath Citation2019, Citation2020; Ahmad et al. Citation2020; Gyeltshen et al. Citation2020; Hamdani and Baali Citation2020; Aykut Citation2021; Karimi and Zeinivand Citation2021; Bhadran et al. 2022; Ifediegwu Citation2022).
This article also stands as a strategic support to hundreds of municipalities with ineffective Communal Development Plans (CDPs) which clearly present the problems and needs of the communities are well documented, identify the expected socio-economic objectives of the municipality and elaborate required budget. But those CDPs fail because of the absence of territorial data and thematic maps, the inadequate management of renewable natural resources including water, and the absence of recommendations on the most suitable crops with respect to the total annual rainfall. Consequently, there are no adequate plans for the development of agroforestry production and no adequate strategy to mitigate the impacts of climate change. A suitable exploitation of thematic maps developed in this paper can boldly contribute to make those CDPs more reliable and effective.
5. Conclusion
This article investigated the groundwater potential of the Municipality of Foumban using an integrated GIS- AHP approach. Six thematic layers namely slope, drainage density, land use/land cover, lineament density, topographic wetness index and rainfall were selected, weighted using pairwise comparison and combined on a GIS environment. In this investigation, slope is considered as the first criterion contributing to groundwater potential with a normalized weight of 0.4082. Drainage density is the second more important criterion with a normalized weight of 0.2041. LULC has a normalised weight of 0.1361 and is ranked third out of six selected criterium. Lineament density is the fourth important criterion in the groundwater potential assessment. TWI values range from 1.70 to 24.13 in MoF with a weight of 0.0816. Rainfall is the sixth criterion, with a normalized weight of 0.06. The groundwater potential map of the Municipality of Foumban is classified into three zones (poor, acceptable and high potential), covering respectively 225.12 km2 (39.06%), 157.14 km2 (27.27%) and 194.12 km2 (33.68%). This map is compliant with the spatial distribution of thematic layers used and with the field survey caried out for validation, making it reliable. This result may help local authorities and policymakers to develop and implement their water resource management in the context of sustainable development.
Acknowledgements
The authors are very thankful to the three anonymous Reviewers and the Editor, Dr. Rundquist, who considerably improved the quality of this article. Dr. Balkiss Ndoumchembou is thanked for her collaboration.
Disclosure statement
No potential conflict of interest was reported by the authors.
References
- Achu AL, Reghunath R, Thomas J. 2020. Mapping of groundwater recharge potential zones and identification of suitable site-specific recharge mechanisms in a tropical river basin. Earth Syst Environ. 4(1):131–145.
- Ahmad I, Dar MA, Andualem TG, Teka AH. 2020. GIS-based multicriteria evaluation of groundwater potential of the Beshilo River basin Ethiopia. J Afr Earth Sci. 164:103747.
- Albhaisi M, Brendonck L, Batelaan O. 2013. Predicted impacts of land use change on groundwater recharge of the upper Berg catchment, South Africa. Water SA. 39(2):211–220.
- Aliabad FA, Shojaei S, Zare M, Ekhtesasi MR. 2018. Assessment of the fuzzy ARTMAP neural network method performance in geological mapping using satellite images and Boolean logic. Int J Environ Sci Technol. 16(7):3829–3838.
- Allafta H, Opp C, Patra S. 2020. Identification of groundwater potential zones using remote sensing and GIS techniques: a case study of the Shatt Al-Arab Basin. Remote Sens. 13(1):112.
- Aretouyap Z, Billa L, Jones M, Richter G. 2020. Geospatial and statistical interpretation of lineaments: salinity intrusion in the Kribi-Campo coastland of Cameroon. Adv Space Res. 66(4):844–853.
- Aretouyap Z, Domra Kana J, Ghomsi FEK, Chamba Nana MF. 2022. Evaluating ecotourism assets in the Cameroonian cities hosting the 33rd edition of the Africa Cup of Nations. Spat Inf Res. 30(3):385–397.
- Arétouyap Z,Bisso D,Méli’i JL,Njandjock Nouck P,Njoya A,Asfahani J. 2019. Hydraulic parameters evaluation of the Pan-African aquifer by applying an alternative geoelectrical approach based on vertical electrical soundings. GeofInt. 58(2):113–126.
- Arétouyap Z,Nouayou R,Assatse WT,Asfahani J. 2017. Aquifer porosity in the Pan-African semi-arid context. Environ Earth Sci. 76(3):1–8.
- Aykut T. 2021. Determination of groundwater potential zones using geographical information systems (GIS) and analytic hierarchy process (AHP) between Edirne-Kalkansogut (northwestern Turkey). Groundw Sustain Dev. 12:100545.
- Bhadran A,Girishbai D,Jesiya NP,Gopinath G,Krishnan RG,Vijesh VK. 2022. A GIS based Fuzzy-AHP for delineating groundwater potential zones in tropical river basin, southern part of India. Geosyst Geoenviron. 1(4):100093.
- Dinesh Kumar PK,Gopinath G,Seralathan P. 2007. Application of remote sensing and GIS for the demarcation of groundwater potential zones of a river basin in Kerala, southwest coast of India. Int. J. Remote Sens. 28:5583–5601.
- Gyeltshen S, Tran TV, Gunda GKT, Kannaujiya S, Chatterjee RS, Champatiray PK. 2020. Groundwater potential zones using a combination of geospatial technology and geophysical approach: case study in Dehradun, India. Hydrol Sci J. 65(2):169–182.
- Hamdani N, Baali A. 2020. Characterization of groundwater potential zones using analytic hierarchy process and integrated geomatic techniques in Central Middle Atlas (Morocco). Appl Geomat. 12(3):323–335.
- Harish B, Haseena M. 2020. Identification of ground water recharge potential zones by using remote sensing and geographic information system. Int J Sci Rep. 7(1):33–38.
- Ifediegwu SI. 2022. Assessment of groundwater potential zones using GIS and AHP techniques: a case study of the Lafia district, Nasarawa State, Nigeria. Appl Water Sci. 12(1):10.
- Jesiya NP,Gopinath G. 2019. Groundwater suitability zonation with synchronized GIS and MCDM approach for urban and peri-urban phreatic aquifer ensemble of southern India. Urban Water J. 15(8):801–811.
- Jesiya NP,Gopinath G. 2020. A fuzzy based MCDM–GIS framework to evaluate groundwater potential index for sustainable groundwater management- A case study in an urban-periurban ensemble, southern India. Groundwater Sustain Dev. 11:100466.
- Karimi H, Zeinivand H. 2021. Integrating runoff map of a spatially distributed model and thematic layers for identifying potential rainwater harvesting suitability sites using GIS techniques. Geocarto Int. 36(3):320–339.
- Kwami IA, Ishaku JM, Mukkafa S, Haruna AI, Ankidawa BA. 2019. Delineation of aquifer potential zones using hydraulic parameters in Gombe and environs. North-Eastern Nigeria. Heliyon. 5(7):e01927.
- Lentswe GB, Molwalefhe L. 2020. Delineation of potential groundwater recharge zones using analytic hierarchy process-guided GIS in the semi-arid Motloutse watershed, eastern Botswana. J Hydrol Reg Stud. 28:100674.
- Malczewski J. 1999. GIS and multicriteria decision analysis. Hoboken, NJ: John Wiley & Sons.
- Mfonka Z, Kpoumié A, Ngouh AN, Mouncherou OF, Nsangou D, Rakotondrabe F, Takounjou AF, Zammouri M, Ngoupayou JRN, Ndjigui PD. 2021. Water quality assessment in the Bamoun Plateau, Western Cameroon: hydrogeochemical modelling and multivariate statistical analysis approach. J Water Resour Prot. 13(02):112–138.
- Perilli N, Gorelli S, Albalawneh A. 2021. The ground water potential of a key junction zone between the Afar Rift Floor and Western Afar Margin of Ethiopia. In: Ksibi, M, editor. Recent Advances in Environmental Science from the Euro-Mediterranean and Surrounding Regions (2nd Edition). EMCEI 2019. Vol. 5. Cham: Springer; p. 1781–1785.
- Poufone YP, Meli’i JL, Aretouyap Z, Gweth MMA, Nguemhe Fils SC, Nshagali Biringanine G, Oyoa V, Perilli N, Njandjock Nouck P. 2022. Possible pathways of seawater intrusion along the Mount Cameroon coastal area using remote sensing and GIS techniques. Adv Space Res. 69(5):2047–2060.
- Rajaveni S, Brindha K, Elango L. 2017. Geological and geomorphological controls on groundwater occurrence in a hard rock region. Appl Water Sci. 7(3):1377–1389.
- Saaty TL. 1990. How to make a decision: the analytic hierarchy process. Eur J Oper Res. 48(1):9–26.
- Satapathy I, Syed TH. 2015. Characterization of groundwater potential and artificial recharge sites in Bokaro District, Jharkhand (India), using remote sensing and GIS-based techniques. Environ Earth Sci. 74(5):4215–4232.
- Shaban A, Khawlie M, Abdallah C. 2006. Use of remote sensing and GIS to determine recharge potential zone: the case of Occidental Lebanon. Hydrogeol J. 14(4):433–443.
- Shao Z, Huq ME, Cai B, Altan O, Li Y. 2020. Integrated remote sensing and GIS approach using fuzzy-AHP to delineate and identify groundwater potential zones in semi-arid Shanxi Province. Environ Model Software. 134:104868.
- Tchakounté J, Eglinger A, Toteu SF, Zeh A, Nkoumbou C, Mvondo Ondoa J, Penaye J, de Wit M, Barbey P. 2017. The Adamawa-Yadé domain, a piece of Archaean crust in the Neoproterozoic central African orogenic belt (Bafia Area, Cameroon). Precambrian Res. 299:210–229.
- Tolche A. 2021. Groundwater potential mapping using geospatial techniques: A case study of Dhungeta-Ramis sub-basin, Ethiopia. Geol Ecol Landscape. 5(1):65–80.
- Yıldırım Ü. 2021. Identification of groundwater potential zones using GIS and multi-criteria decision-making techniques: a case study upper Coruh River basin (NE Turkey). ISPRS Int J Geo-Inf. 10(6):396.
- Zghibi A, Mirchi A, Msaddek MH, Merzougui A, Zouhri L, Taupin JD, Chekirbane A, Chenini I, Tarhouni J. 2020. Using analytical hierarchy process and multi-influencing factors to map groundwater recharge zones in a semi-arid Mediterranean coastal aquifer. Water. 12(9):2525.