
Abstract
The urbanization worldwide leads to the rapid increase of solid waste, posing a threat to environment and people’s wellbeing. However, it is challenging to detect solid waste sites with high accuracy due to complex landscape, and very few studies considered solid waste mapping across multi-cities and in large areas. To tackle this issue, this study proposes a novel deep learning model for solid waste mapping from very high resolution remote sensing imagery. By integrating a multi-scale dilated convolutional neural network (CNN) and a Swin-Transformer, both local and global features are aggregated. Experiments in China, India and Mexico indicate that the proposed model achieves high performance with an average accuracy of 90.62%. The novelty lies in the fusion of CNN and Transformer for solid waste mapping in multi-cities without the need for pixel-wise labelled data. Future work would consider more sophisticated methods such as semantic segmentation for fine-grained solid waste classification.
1. Introduction
1.1. Background
With the rapid process of urban sprawl and the accompanied population growth worldwide, the amount of solid waste has been increasing at an unprecedented speed. According to the World Bank Group (Kaza et al. Citation2018), the total amount of solid waste on Earth has reached 2.01 billion tons, which could impose a great threat to both ecological environment and people’s wellbeing. According to the United Nations (https://sdgs.un.org/goals), the Sustainable Development Goal (SDG) 6 focuses on clean water and sanitation while SDG 11 is about sustainable cities and communities, which all concern on the improving water quality and urban environment by reducing pollution, eliminating dumping and paying special attention to municipal and other waste management. Under this circumstance, the detection of solid waste could provide valuable spatial data to accomplish the above SDGs. It should be noted that without appropriate human intervention, the situation might be even worse in those developing countries since their cities’ administration systems could be imperfect and defective, leading to the widespread existence of solid waste sites (Lin et al. Citation2022).
These solid waste sites mainly include household waste around residential areas, industrial waste from factories and construction waste generated by both building construction and demolition. These solid waste sites could produce hazardous materials that cause soil contamination, which is a contributor to point-source pollution (Capolupo et al. Citation2015). Moreover, the accompanied harmful substances would also be transferred to the nearby water bodies (i.e. rivers, lakes, reservoirs) during the precipitation process, leading to the non-point source pollution, which will degrade the quality of cultivated land and endanger the safety of drinking water sources. Therefore, it is of great significance to monitor and delineate the spatial distribution of the solid waste sites, which could provide geo-referenced data for environmental protection department.
1.2. Related work
Earlier studies for solid waste monitoring mainly focused on field surveys and statistical reports (Beliën et al. Citation2014), which could be a tough and laborious task. Meanwhile, with the rapid development of aerospace science and technology, remote sensing imagery could be easily accessible nowadays. Due to the unique advantage of synoptic view, wide coverage and cost-effectiveness (Feng et al. Citation2015), remote sensing has been introduced to monitor solid waste dumps and landfills, and the monitoring method has been transferred from visual inspection to automatic detection and recognition. In the previous studies, Silvestri and Omri (Citation2008) endeavoured to detect landfills by monitoring the growth status of nearby vegetation with medium-resolution remote sensing imagery. The rationale is that vegetation could show an irregular spectrum due to the soil pollution caused by landfills or garbage dumps. However, this indirect approach may fail since the vegetation growth could be affected by numerous additional factors other than solid waste induced contamination. Compared with medium resolution remotely sensed data, very high resolution (VHR) imagery has a spatial resolution at the meter level, where the appearance, outline and textures of solid waste could be clearly captured (), making it possible for the direct detection from remote sensing imagery. For instance, Kako et al. (Citation2012) utilized VHR remote sensing data acquired by unmanned aerial vehicle (UAV) to detect plastic waste in the coastal regions, which justifies the effectiveness of VHR imagery in enhancing the geospatial accuracy for waste monitoring.
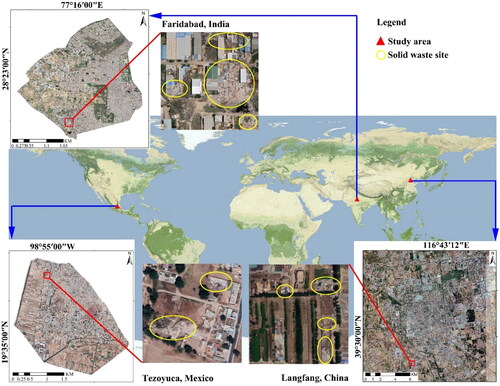
Figure 1. Study areas.
Although several researches have focused on the automatic detection of solid waste sites (Andriolo et al. Citation2020; Biermann et al. Citation2020), they mainly relied on classic machine learning methods and handcrafted image features, whose generalization capability and robustness could be not strong enough to cope with the complicated and heterogeneous landscapes. Besides, the design of image features would require special domain expertise from the remote sensing field. Compared with the above methods, deep learning or deep neural networks (DNN) (LeCun et al. Citation2015), especially the convolutional neural network (CNN), has witnessed astonishing success in computer vision tasks (Krizhevsky et al. Citation2012), and has also been a research hotspot in remote sensing (Feng et al. Citation2019) and environmental field (Liu et al. Citation2020). Relevant applications include land use and land cover classification (Huang et al. Citation2018), wetland mapping (Rezaee et al. Citation2018) and plastic greenhouses monitoring (Feng et al. Citation2021). Meanwhile, CNN has also been applied to garbage detection (Sun et al. Citation2021) and achieved good performance. For instance, Lin et al. (Citation2022) proposed the RWNet to classify different types of recyclable waste from ground pictures with transfer learning. Fallati et al. (Citation2019) utilized a commercial software, PlasticFinder, whose core algorithm is CNN to detect the coastal solid waste sites from UAV images. However, convolution calculation of CNN belongs to local operator, which can only extract image features from a certain sized image patch (called receptive field), neglecting the global information and contextual relationship, while the latter is of great importance in remote sensing image analysis and scene understanding.
Recently, a model from the field of natural language processing (NLP), Transformer, has been applied successfully in computer vision tasks with astonishing performance (Dosovitskiy et al. Citation2020). Specifically, Transformer is mainly based on the self-attention mechanism, where the contextual relationship within a scene image could be effectively modeled. Therefore, Transformer based models have yielded state-of-the-art performance in several computer vision applications such as image classification, object detection, etc. (Dosovitskiy et al. Citation2020). Considering the complicated nature of modern urban landscape, it would be difficult to detect the solid waste sites from its surroundings. Under this context, Transformer could play a role in increasing the accuracy of solid waste recognition due to its capability of capturing the spatial relationship among various land objects. Despite its advantage in aggregating global contextual information of a certain scene image, Transformer tends to neglect the local features, which is precisely the strength of classical CNNs. Therefore, if we integrate both Transformer and CNN, they would complement each other and might yield an even better performance for solid waste detection.
1.3. Motivation and contributions
Above all, the objective of this paper is to integrate both Transformer and CNN into a dual-stream deep neural network for the accurate detection of solid waste sites from VHR remote sensing imagery. In specific, the hybrid model consists of two streams, one is the CNN stream and the other is the Transformer stream. In the CNN stream, we adopt the multi-scale dilated convolutional neural network (MDCNN) for local features extraction, which could account for the scale and shape differences of solid waste sites under complex landscapes. In the Transformer stream, we utilize the latest Swin-Transformer (Liu et al. Citation2021) to extract and aggregate the global contextual features, which could increase the separability of solid waste sites from their surroundings. Afterwards, both local and global features are fused via a gated fusion module for feature aggregation, based on which the final classification could be made. Finally, to get the exact boundary of each solid waste site, we tend to a weakly-supervised method which is based on CAM (class activation mapping). Ever since the proposed deep neural network aims to detect solid waste sites, then it is named SW-Net (Solid Waste Net) in this paper.
The main contributions of this study are as follows.
A novel deep learning model (i.e. SW-Net), which integrates CNN and Transformer for local and global feature learning, has been proposed for solid waste mapping.
A weakly-supervised mechanism has been explored in the delineation of solid waste boundaries, which shows good performance without pixel-wise labelled data.
The dataset (i.e. RS4SW) and the code in this paper are available online to promote future studies.
The rest of the paper is organized as follows. Section 2 introduces the study area, dataset and the proposed SW-Net. Section 3 shows the experiment results. Section 4 presents the discussion and limitation. And Section 5 provides the main conclusions.
2. Methods
This section gives an overview of the study area and dataset first, then illustrates the proposed deep learning model for solid waste mapping. Finally, training details and accuracy metrics for performance evaluation are given.
2.1. Study area
In this research, three typical study regions are selected, including Langfang in China, Faridabad in India and Tezoyuca in Mexico, which all locate in the main developing countries around the world (). All the three cities are close to their capitals (i.e. Beijing, New Delhi and Mexico City), which are also known as satellite cities.
Due to their location advantages, all the three cities have witnessed rapid industrial development, which are mainly attributed to the industrial transfer of their capital cities. Several low-end manufacturing and construction industries have been moved to these cities, such as cement plants and chemical plants, which leads to the rapid increase of the accompanied solid waste sites. It indicates that they might have become the Pollution Heaven, ever since the environmental regulation of these three cities are far less severe than that of their capital cities, causing the casually discarding and stacking of these industrial wastes.
Meanwhile, the rapid urbanization process of the three cities could bring in more household waste. However, supporting infrastructure construction has lagged behind the garbage increase, leading to the stack of household wastes around the residential regions, especially in the suburb of the city. Moreover, during the urban sprawl, a large number of old buildings have been torn down, which contributes to the widespread construction waste. In this study, we try to detect the solid waste sites in the three typical cities of China, India and Mexico to provide accurate solid waste maps to the local government for regional sustainability.
2.2. Dataset used
The VHR remote sensing imagery in this study is from Google Earth (http://earth.google.com/), with a spatial resolution of 0.5 meters, where the details of solid waste sites could manifest themselves clearly (). Meanwhile, the size of each image patch is set to be 224 × 224, since it is a standard image size in the deep learning field (Feng et al. Citation2021).
Figure 2. Samples of solid waste sites. (a) Langfang city in China; (b) Faridabad city in India; (c) Tezoyuca city in Mexico.
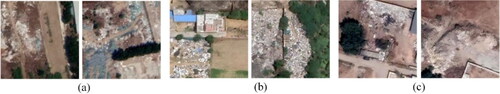
The classification scheme mainly consists of two categories, including solid waste sites (SW) and non-solid waste sites (non-SW) (). Specifically, SW mainly includes industrial waste, household waste and construction waste, which are usually distributed around factories and residential areas. Besides, SW usually has a white appearance with irregular shapes and textures (), which makes it possible to separate them from their surroundings. Meanwhile, non-SW mainly consist of buildings, roads, parks, farmland and water bodies, etc.
Table 1. Classification scheme.
shows that there are a total of 3680 image patches for Langfang, Faridabad and Tezoyuca, where the ratio of training and testing sets is 8:2. Training set is used to train and calibrate the classification model while testing set is left for accuracy assessment.
2.3. Overall structure of SW-Net
This section will describe the overall structure of the proposed SW-Net for solid waste mapping.
As shown in , the input of the SW-Net is a remote sensing image patch while the output is the predicted label. In specific, the proposed SW-Net consists of a CNN stream, a Transformer stream and a feature fusion module. The CNN stream contains a MDCNN while the Transformer stream contains the state-of-the-art Swin-Transformer. The former was focused on local feature extraction, while the latter was focused on global contextual feature learning. Next, an adaptive gated feature fusion model was adopted to aggregate both the local and global features. Once the training process is finished, the trained SW-Net could be used to recognize the solid waste sites in large-scale regions through sliding-window strategy.
Figure 3. Overall structure of the proposed SW-Net.
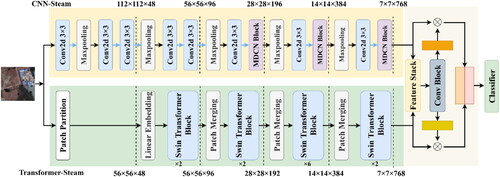
2.4. Feature extraction
In this section, we will detailly describe the two streams of the proposed SW-Net, which includes the CNN stream and the Transformer stream.
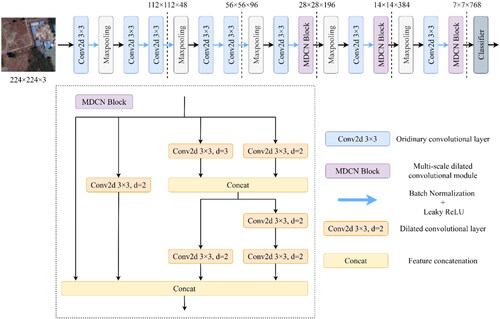
2.4.1. CNN stream
The CNN stream is formed by a MDCNN, which has been proposed in our earlier works (Feng et al. Citation2019; Chen et al. Citation2022), and has achieved good performance in coastal land cover mapping and urban village extraction. As is known, the landscape under VHR remote sensing imagery is rather complicated and fragmented. Meanwhile, the solid waste sites have different shapes and sizes. Therefore, it is a challenging task to automatically detect these solid waste sites. To tackle the complex landscapes and the appearance variance of solid waste sites, dilated convolutions were introduced to make the CNN model accommodate to the variety of ground objects’ shapes. Besides, multi-scale connections among convolutions have been established for extracting hierarchical and multi-level features.
As depicted in , both the dilated convolution and multi-scale connections were utilized for discriminative feature learning under complex landscapes. However, as convolutions belong to local operator, which has flaws in modeling the contextual information of the entire scene image, while the contextual relationships play a vital role in remote sensing image analysis and scene understanding. To complement this deficiency, we introduced an additional parallel stream based on Transformer to enhance the capability of global feature learning, which will be described in the next section.
Figure 4. CNN stream.
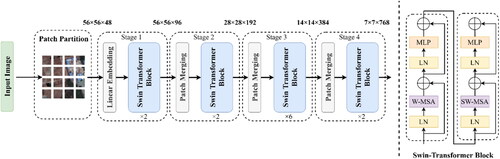
2.4.2. Transformer stream
Specifically, the Transformer stream is based on Swin-Transformer. It first splits an image into N*N patches, and then establishes the relationship among these patches to derive the contextual information, aiming at providing global features that could compensate the drawback of the CNN stream.
shows the structure of the Transformer stream. As can be seen, a remote sensing scene image was first split into 4 × 4 patches via Patch Partition. Afterwards, an image sequence is generated by stacking the image patches serially via Linear Embedding layer, and then is sent to the Swin-Transformer Block. Among them, Patch Merging down-sampled the feature map to reduce the feature map’s size while increasing its dimension to reduce the computation without losing too much feature information. Swin-Transformer block consists of both the W-MSA (Windows Multi-Head Self-Attention) and SW-MSA (Shifted Windows Multi-Head Self-Attention) modules (), which is to model the dependency among different image patches globally. From the other hand, such dependency just reflects the contextual relationships within the remote sensing scene image, which could redeem the shortcomings of the CNN stream in global feature learning.
Figure 5. Transformer stream.
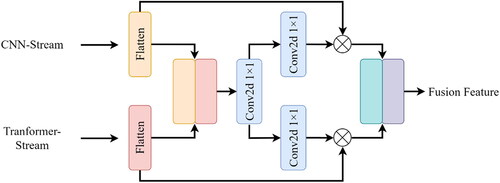
2.5. Adaptive feature fusion
After the image feature extraction from both CNN stream and Transformer stream, feature fusion should be conducted to enhance the features’ representation and discrimination. In this section, we introduce an adaptive gated fusion module method, which has the merits of enhancing informative features while suppress the noisy ones.
depict the structure of the adaptive fusion module. Features from each stream (i.e. MDCNN or Swin-Transformer) were firstly passed to Flatten layers. Next, several convolution layers were used to compute the feature importance, after which the original features were recalibrated via dot-production. Finally, the recalibrated features were then concatenated to generate the fused feature, which would be sent into the softmax layer for classification.
Figure 6. Gated fusion module.
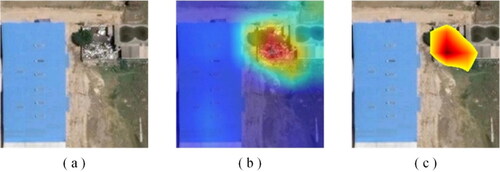
2.6. Solid waste sites boundary delineation
It should be noted the proposed SW-Net is a patch-wise classification model, which could not extract the exact boundary of each solid waste site. To tackle this issue, we refer to a weakly-supervised method that utilizes the Grad-CAM (Gradient-weighted Class Activation Mapping) (Selvaraju et al. Citation2017) to delineate the solid waste sites’ boundaries. Specifically, based on Grad-CAM, the model trained with image-level or scene-level labels are informative to tell where the most discriminative region lies. Therefore, Grad-CAM is utilized to generate attention maps to tell where the solid waste sites locate. To better delineate the boundaries of the solid waste sites, a threshold was utilized to segment the attention map, after which the solid waste sites could be localized (). It should be noted that Grad-CAM does not need pixel-level labels, which could reduce the labelling burden but still yield the boundary.
Figure 7. Boundary delineation of solid waste sites. (a) remote sensing image patch; (b) image patch overlayed with CAM; and (c) boundaries of solid waste sites generated by thresholding the CAM image.
2.7. Training details
In this study, the widely used Adam (Kingma and Ba Citation2014) was selected as the optimizer with an initial learning rate of 1e-4. As for the loss function, cross-entropy (CE) loss was adopted. The ratio of training and testing sets is 8:2 and 20% of training samples were randomly chosen to form the validation set, which could help selecting the best model with the minimum validation loss. Besides, the SW-Net is programmed with TensorFlow 2.5 on a NVIDIA 2080Ti with 11 G memory.
2.8. Accuracy evaluation
Both qualitative and quantitative methods were used to justify the performance of the proposed SW-Net in solid waste mapping. As for the former, visual inspection was adopted to check the classification errors. While for the latter, a testing dataset was used to calculate the confusion matrix and overall accuracy (OA). In addition, ablation studies were performed to further justify the role of CNN stream and Transformer stream. And contrast experiments were also conducted to compare the proposed SW-Net with other deep learning models.
3. Results
This section shows the results of both solid waste classification and accuracy evaluation. In addition, bad case analysis is performed to show the errors of the model.
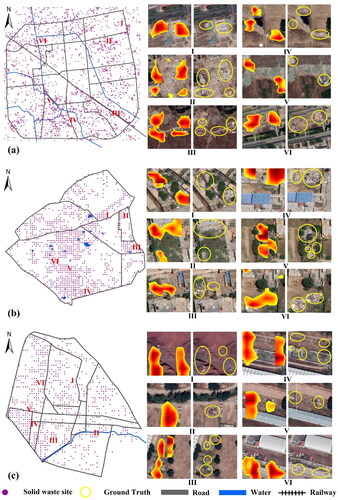
3.1. Solid waste mapping results
shows the solid waste mapping results in the three study areas using the proposed SW-Net. It illustrates that the proposed SW-Net shows a good performance in recognizing the solid waste sites under complex landscapes in the three study regions. The mapping results are in accordance with the visual inspection from remote sensing imagery. The maps witness no obvious classification errors. Meanwhile, we also selected a series of sub-regions from the three cities to show the mapping details. In depicts clearly that through the SW-Net and the Grad-CAM, the boundaries of each solid waste site could be delineated from its surroundings. Although the boundaries in this study is not as precise as the ground-truth, it should be noted that we only utilized the coarse, scene-level labels, which yields a trade-off between huge labeling work and the localization accuracy.
Figure 8. Mapping result of solid waste sites for (a) Langfang; (b) Faridabad; (c) Tezoyuca.
3.2. Accuracy assessment results
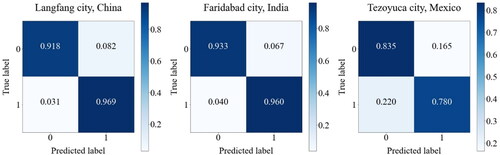
In the last section, visual inspection was used to evaluate the solid waste mapping performance qualitatively. While in this section, a testing dataset was introduced for quantitative accuracy assessment. A confusion matrix was derived for each city together with the OA and Kappa index, which is shown as follows.
indicates that the proposed SW-Net has a good performance in the task of solid waste mapping, which shows an overall accuracy of 94.20%, 94.62% and 80.50% for Langfang, Faridabad and Tezoyuca, respectively. Besides, Langfang and Faridabad show a higher accuracy when compared with Tezoyuca. One possible reason is that the solid wastes sites observed from remote sensing image of Tezoyuca show rather unclear textures when compared with Langfang and Faridabad, making it more difficult to separate from the background. To further analyse the classification performance.
Figure 9. Confusion matrix of each study area. Notes. 0 represents non-solid waste sites and 1 denotes solid waste sites.
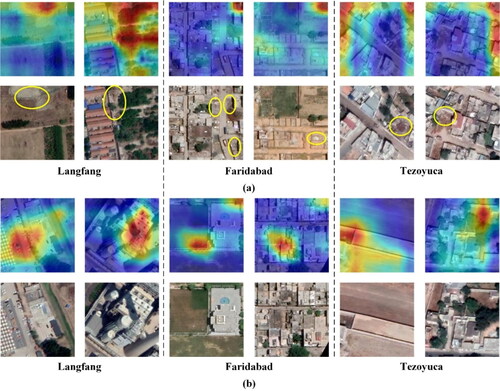
illustrates several prediction errors, together with the corresponding attention maps that are generated from the proposed deep learning model. shows that when the solid waste sites have a small size or unobvious textures, it is difficult to tell whether the image patch contains a solid waste site or not, even interpreted by remote sensing experts. Moreover, attention maps show that SW-Net could not correctly locate the solid waste sites hence results in the classification errors. illustrates several false positive predictions, where other land covers are misclassified as solid waste sites. It seems that the model tends to recognizes the opening parking lot and courtyard as solid waste sites, where they show similar textures and spatial patterns as that of solid waste sites from the remote sensing imagery. To tackle the above classification errors, remote sensing images with a higher spatial resolution would be needed in the future study, since these images could provide finer spatial details to separate solid waste sites from other land cover categories and vice versa.
Figure 10. Examples of several predicted image patches. (a) solid waste sites predicted as non-solid waste sites; (b) non-solid waste sites predicted as solid waste sites.
4. Discussion
This section firstly analyses the exposure risk of solid waste for each study area, then describes the ablation study and the comparison with other methods. At last, limitation and future work of this study are discussed.
4.1. Exposure risk analysis of solid waste
Based on the solid waste classification result, we could yield the accompanied exposure risk map to identify the regions with a high exposure risk to solid waste sites ().
Figure 11. Exposure risk map for (a) Langfang; (b) Faridabad; (c) Tezoyuca.
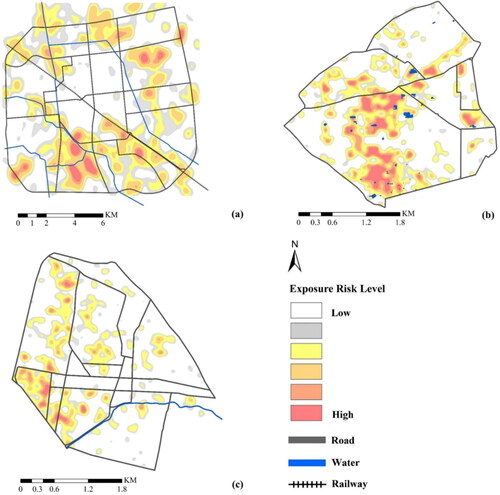
Specifically, we utilized kernel density estimation method to the solid waste classification data to generate the exposure risk map. The regions with the lowest risk are in white, and the deeper the color, the higher the exposure risk it represents. depicts the exposure risk map of Langfang in China, which shows a clear spatial pattern that most high-risk regions are outside the city core. However, they are very close to the rivers, which would pose a potential risk to the water quality. In Faridabad, many ponds are located in the high exposure risk zones (), which would also result in a concern of possible water safety. shows that the high exposure risk districts are scattered in Tezoyuca while there are also several high-risk zones alongside the river. Therefore, both the spatial location map and the exposure risk map could provide valuable information to the local environmental protection department.
4.2. Ablation study
According to previous study (Lin et al. Citation2021), to further justify the performance of the proposed SW-Net, we compared the accuracy between mono-stream DNN and dual-stream DNN.
Since the SW-Net in this study integrates both a CNN stream and a Transformer stream, it is necessary to verify the effectiveness of each mono-stream for the performance of solid waste mapping. Specifically, we consider the following models. CNN-only and Transformer-only represent using only CNN stream or Transformer stream for classification. Feature-stacking means the classic feature-stacking method, while the proposed model represents the SW-Net in this study. The comparison results between the above models are listed in . The comparison results between the above models are listed in .
Table 2. Accuracy for CNN-only, Transformer-only and the proposed model.
indicates that when compared with mono-stream model, the integration of CNN and Transformer in this study could increase the accuracy for solid waste classification, which could gain an average accuracy increase of 8.33%, 7.31% and 8.25% in Langfang, Faridabad and Tezoyuca, respectively. The reason for the accuracy increase lies in the integration and complementation of both local features from CNN and global features from Transformer. Meanwhile, the gated feature fusion in this study outperforms the feature-stacking method with an average accuracy increase of 5.98% in the three cities. The reason why the feature-stacking fusion method shows a lower performance lies in that it only concatenates the local and global features extracted from CNN stream and Transformer stream, neglecting the importance of each feature to the classification accuracy. On the contrary, the gated feature fusion could learn the weights of each feature, aiming at re-calibrating all the features according to their importance hence to enhance the informative features while restrain the noisy ones.
4.3. Comparison with other methods
To further verify the effectiveness of this study, we also compared it with other classic deep learning methods in the computer vision field, such as VGG (Simonyan and Zisserman Citation2014), ResNet (He et al. Citation2016), DenseNet (Huang et al. Citation2017), EfficientNet (Tan and Le Citation2019), DenseNet (Huang et al. Citation2017). The comparison results are as follows.
shows that the SW-Net outperforms other deep learning models with an average accuracy increase of 12.10%, 11.31% and 11.10% in Langfang, Faridabad and Tezoyuca, respectively. Compared with the classic CNN models, the proposed SW-Net model has two improvements. Firstly, it integrates both MDCNN and Swin-Transformer into an end-to-end model, which benefits from both the multi-scale local features of MDCNN and the global contextual features of Swin-Transformer. Secondly, the SW-Net benefits from the adaptive local and global feature fusion, which could enhance the information of each subnetwork while suppressing the noise within to a certain limit. Therefore, the SW-Net model could learn more discriminative features from complicated landscapes.
Table 3. Comparison with other deep learning models.
Meanwhile, a comparison with other solid waste classification methods was made to further demonstrate the superiority and limitations of the proposed SW-Net. The following table shows the comparative analysis results, mainly from the aspects of data source, study area, model used and accuracy reported from literature ().
Table 4. Comparison with other solid waste classification methods.
Silvestri and Omri (Citation2008) utilized an indirect method to recognize solid waste sites by analysing the abnormal NDVI (normalized difference vegetation index) that was caused by landfills. This method might be unreliable in large regions since the NDVI could be affected by various factors other than solid waste. Lin et al. (Citation2022) classified the wastes from the ground images using a VGG-like deep learning model with a transfer learning strategy. Both Bao et al. (2018) and Fallati et al. (2019) utilized UAV Images to identify solid waste sites using the threshold method and CNN model, respectively, and show good performance. It should be noted UAV has a limitation in acquiring data from large-scale regions, which might not be the best choice in real world applications. Compared with UAV data, VHR satellite data could provide an alternative in solid waste mapping. For instance, Sun et al. (Citation2021) performed solid waste classification using VHR imagery and an object detection model. Although their model could yield the bounding box of the solid waste sites, it requires a large amount of manually labelled data. Besides, solid waste sites are always scattered distributed with an irregular boundary, making it hard to recognized even through an object detection model. Compared with the above studies, unlike the classic CNN model, the proposed SW-Net integrated CNN and Transformer to fuse both local and global features for enhancing the inter-class separability. Meanwhile, the SW-Net could yield the boundaries of the solid waste sites through a weakly supervised method, which releases the burden on per-pixel labelling process. Above all, the proposed model is promising for large scale solid waste mapping with little requirement for box-level or pixel-level annotation.
4.4. Limitations
In addition, although the SW-Net model shows a good performance in solid waste mapping from VHR remote sensing images, some issues need to be solved. The first issue is that although we could obtain the coarse boundaries of solid waste sites through a weakly-supervised method (), the boundaries could be further refined through fully-supervised semantic segmentation model in future research. The other issue is that we did not perform a fine-grained classification of solid waste sites since it is hard to separate industrial, household and construction waste due to very similar appearances from remote sensing imagery. In the future study, other geo-referenced data such as point-of-interest (POI) could be introduced to provide additional attribute information. For instance, if most surrounding POIs of a certain solid waste site belong to industrial zones, then it is highly probable that this site contains industrial waste.
5. Conclusions
This research focused on the automatic mapping of solid waste sites based on the proposed dual-stream deep neural network, SW-Net, from VHR remote sensing data. Specifically, the SW-Net consists of a CNN stream and a Transformer stream. The former utilizes an MDCNN to learn multi-scale local features, aiming to tackle the scale and shape variations of solid waste sites. While the latter adopts Swin-Transformer to learn contextual information of a remote sensing image to provide useful global features. Both the local and global features are fused adaptively, where the more informative features could be enhanced via feature aggregation.
Experimental results show that the proposed model achieves high accuracy for solid waste mapping in three typical regions of China, India and Mexico. The prediction errors mainly occurred between solid waste sites and other land covers such as open parking lots and courtyards. An exposure risk map has also been generated to show the location of the high-risk regions.
This study demonstrates that by utilizing the proposed SW-Net, it is feasible to detect and map solid waste sites from VHR remote sensing imagery. Furthermore, in terms of Environmental, Social, and Governance (ESG), firstly, the generated solid waste map could provide valuable geospatial data for environmental protection, indicating the risk of solid waste sites on water safety, soil contamination, etc. As for social aspect, the solid waste map provides a way to measure the spatial inequality of people’s well-being against potential health risks. As for governance, the findings in this study could be used for both local governments and companies for the constrain of solid waste pollution, leading to a more sustainable way in regional development.
Data availability statement
The data & code that support the findings of this study are openly available at [https://github.com/MrSuperNiu/Remote-Sensing-for-Solid-Waste-mapping].
Disclosure statement
The authors report there are no competing interests to declare.
Additional information
Funding
References
- Andriolo U, Gonçalves G, Bessa F, Sobral P. 2020. Mapping marine litter on coastal dunes with unmanned aerial systems: a showcase on the Atlantic Coast. Sci Total Environ. 736:139632.
- Bao Z, Sha J, Li X, Hanchiso T, Shifaw E. 2018. Monitoring of beach litter by automatic interpretation of unmanned aerial vehicle images using the segmentation threshold method. Mar Pollut Bull. 137:388–398. 10.1016/j.marpolbul.2018.08.009. 30503448
- Beliën J, De Boeck L, Van Ackere J. 2014. Municipal solid waste collection and management problems: a literature review. Transp Sci. 48(1):78–102.
- Biermann L, Clewley D, Martinez-Vicente V, Topouzelis K. 2020. Finding plastic patches in coastal waters using optical satellite data. Sci Rep. 10(1):1–10.
- Capolupo A, Pindozzi S, Okello C, Fiorentino N, Boccia L. 2015. Photogrammetry for environmental monitoring: the use of drones and hydrological models for detection of soil contaminated by copper. Sci Total Environ. 514:298–306.
- Chen B, Feng Q, Niu B, Yan F, Gao B, Yang J, Gong J, Liu J. 2022. Multi-modal fusion of satellite and street-view images for urban village classification based on a dual-branch deep neural network. Int J Appl Earth Obs Geoinf. 109:102794.
- Dosovitskiy A, Beyer L, Kolesnikov A, Weissenborn D, Zhai H, Unterthiner T, Dehghani M, Minderer M, Heigold G, Gelly S, et al. 2020. An image is worth 16x16 words: transformers for image recognition at scale. ArXiv:2010.11929.
- Fallati L, Polidori A, Salvatore C, Saponari L, Savini A, Galli P. 2019. Anthropogenic marine debris assessment with unmanned aerial vehicle imagery and deep learning: a case study along the beaches of the Republic of Maldives. Sci Total Environ. 693:133581.
- Feng Q, Liu J, Gong J. 2015. Urban flood mapping based on unmanned aerial vehicle remote sensing and random forest classifier—A case of Yuyao, China. Water. 7(12):1437–1455.
- Feng Q, Niu B, Chen B, Ren Y, Zhu D, Yang J, Liu J, Ou C, Li B. 2021. Mapping of plastic greenhouses and mulching films from very high resolution remote sensing imagery based on a dilated and non-local convolutional neural network. Int J Appl Earth Obs Geoinf. 102:102441.
- Feng Q, Yang J, Zhu D, Liu J, Guo H, Bayartungalag B, Li B. 2019. Integrating multitemporal Sentinel-1/2 data for coastal land cover classification using a multibranch convolutional neural network: a case of the Yellow River Delta. Remote Sens. 11(9):1006.
- He K, Zhang X, Ren S, Sun J. 2016. Deep residual learning for image recognition. Proceedings of the IEEE International Conference on Computer Vision. p. 770–778.
- Huang G, Liu Z, Maaten L, Weinberger KQ. 2017. Densely connected convolutional networks. Proceedings of the IEEE International Conference on Computer Vision. p. 4700–4708.
- Huang B, Zhao B, Song Y. 2018. Urban land-use mapping using a deep convolutional neural network with high spatial resolution multispectral remote sensing imagery. Remote Sens. Environ. 214:73–86.
- Kako S, Isobe A, Magome S. 2012. Low altitude remote-sensing method to monitor marine and beach litter of various colors using a balloon equipped with a digital camera. Mar Pollut Bull. 64(6):1156–1162.
- Kaza S, Yao L, Bhada-Tata P, Van Woerden F. 2018. What a waste 2.0: a global snapshot of solid waste management to 2050. Washington, DC: World Bank Publications.
- Kingma DP, Ba J. 2014. Adam: a method for stochastic optimization. ArXiv:1412.6980.
- Krizhevsky A, Sutskever I, Hinton GE. 2012. Imagenet classification with deep convolutional neural networks. Advances in Neural Information Processing Systems. Vol. 25.
- LeCun Y, Bengio Y, Hinton G. 2015. Deep learning. Nature. 521(7553):436–444.
- Lin K, Zhao Y, Gao X, Zhang M, Zhao C, Peng L, Zhang Q, Zhou T. 2022. Applying a deep residual network coupling with transfer learning for recyclable waste sorting. Environ Sci Pollut Res. 29(60):91081–91095.
- Lin K, Zhao Y, Kuo JH, Deng H, Cui F, Zhang Z, Zhang M, Zhao C, Gao X, Zhou T, et al. 2022. Toward smarter management and recovery of municipal solid waste: a critical review on deep learning approaches. J Clean Prod. 346:130943.
- Lin K, Zhao Y, Tian L, Zhao C, Zhang M, Zhou T. 2021. Estimation of municipal solid waste amount based on one-dimension convolutional neural network and long short-term memory with attention mechanism model: a case study of Shanghai. Sci Total Environ. 791:148088.
- Lin K, Zhou T, Gao X, Li Z, Duan H, Wu H, Lu G, Zhao Y. 2022. Deep convolutional neural networks for construction and demolition waste classification: VGGNet structures, cyclical learning rate, and knowledge transfer. J Environ Manage. 318:115501.
- Liu J, Feng Q, Wang Y, Batsaikhan B, Gong J, Li Y, Liu C, Ma Y. 2020. Urban green plastic cover mapping based on VHR remote sensing images and a deep semi-supervised learning framework. ISPRS Int J Geo-Inf. 9(9):527.
- Liu Z, Lin Y, Cao Y, Hu H, Wei Y, Zhang Z, Lin S, Guo B. 2021. Swin transformer: hierarchical vision transformer using shifted windows. Proceedings of the IEEE International Conference on Computer Vision. p. 10012–10022.
- Rezaee M, Mahdianpari M, Zhang Y, Salehi B. 2018. Deep convolutional neural network for complex wetland classification using optical remote sensing imagery. IEEE J Sel Top Appl Earth Obs Remote Sensing. 11(9):3030–3039.
- Selvaraju RR, Cogswell M, Das A, Vedantam R, Parikh D, Batra D. 2017. Grad-cam: visual explanations from deep networks via gradient-based localization. Proceedings of the IEEE International Conference on Computer Vision. p. 618–626.
- Silvestri S, Omri M. 2008. A method for the remote sensing identification of uncontrolled landfills: formulation and validation. Int J Remote Sens. 29(4):975–989.
- Simonyan K, Zisserman A. 2014. Very deep convolutional networks for large-scale image recognition. ArXiv:1409.1556.
- Sun X, Liu Y, Yan Z, Wang P, Diao W, Fu K. 2021. SRAF-Net: shape robust anchor-free network for garbage dumps in remote sensing imagery. IEEE Trans Geosci Remote Sensing. 59(7):6154–6168.
- Tan M, Le Q. 2019. Efficientnet: rethinking model scaling for convolutional neural networks. ICML. 97:6105–6114.