
 ?Mathematical formulae have been encoded as MathML and are displayed in this HTML version using MathJax in order to improve their display. Uncheck the box to turn MathJax off. This feature requires Javascript. Click on a formula to zoom.
Abstract
DRASTIC is a model used to reliably assess the pollution potential of aquifers at global location. Despite various criticisms of this model or its optimization, sometimes the territorial or geological conditions still must rely on this model approach based on its simplicity. The existence of sinkholes in the alluvial aquifer with an underlying karst aquifer is a clear example of the need to change or optimize the DRASTIC model to improve accuracy of prediction. In this study, the DRASTIC model was changed by adding two factors, the distance to a sinkhole and the sinkhole catchment factors. The modified DRASTIC model was then used to evaluate the pollution potential of Abarkouh aquifer in Yazd province, Central Iran. The intrinsic vulnerability index of Abarkouh aquifer was calculated by the weighted sum method in GIS. The resulting numerical values ranged between 62 and 176 for full study area. Without adding the two layers related to Sin-DRASTIC, the generic DRASTIC Index map showed summed values ranging between 54 and 130. The final Sin-DRASTIC map was divided it into 4 orders very low (<106; 722 km2, 78%), low (107-133; 186 km2, 20%), low to moderate (133-160; 15.3 km2, 1.7%), and moderate vulnerability (161-176; 1.7 km2, 0.3%) vulnerability. Both of the created maps showed high Area Under the Curve values at 76% and 78% for the generic DRASTIC and Sin-DRASTIC respectively. However, the area of the aquifer containing the sinkholes showed low and very low zones of contamination vulnerability on the generic DRASTIC map. The sensitivity analysis showed that the aquifer vulnerability to pollution is mainly controlled by the vadose zone impacts and the sinkhole catchment factor. Therefore, it is concluded that for geologic settings containing sinkholes that are open or contain higher vertical hydraulic conductivity sediment compared to the general matrix of the unconfined aquifer, the Sin-DRASTIC model method yields a superior prediction.
HIGHLIGHTS
Sin-DRASTIC is a modified version of the generic DRASTIC method that used in regions wherein sinkholes occur
The Sin-DRASTIC models was applied to intrinsic vulnerability of Abarkouh aquifer, Central Iran.
The high AUC values at 76% and 78% for the generic DRASTIC and Sin-DRASTIC respectively, show the accuracy of the results.
In the Sin-DRASTIC map the sinkhole areas showed a high potential for groundwater contamination
Introduction
Today, groundwater potential to pollution has become one of the main essential aspects of groundwater management. Ever then the idea of intrinsic vulnerability was proposed by Margat (Citation1968), a variety of approaches have been used in various climates to test the contamination potential of alluvial and karst aquifers (Foster Citation1987; Adams and Foster Citation1992; Van Stempvoort et al. Citation1993; Civita 1994; Drew and Hötzl Citation1999; Zwahlen Citation2004; Ravbar and Goldscheider Citation2007; Kavouri et al. Citation2011; Taheri et al. Citation2015a). Undoubtedly, among all of the methods used, the DRASTIC model is perhaps the best known model that has been applied worldwide (Aller Citation1985). The DRASTIC simplicity and feasibility development along with its reliance on factors in hydrogeology that are well-established and have data availability are key reasons the model is used by water managers and researchers.
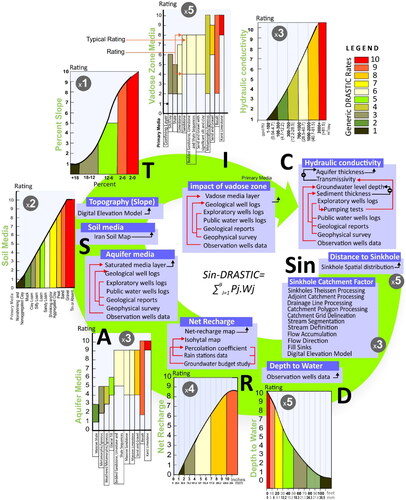
A DRASTIC model is commonly constructed by preparing 7 thematic maps including depth of water (D), net recharge (R), aquifer media (A), soil media (S), topography (T), impact of the vadose zone (I), and hydraulic conductivity (C) with consideration of the weights and rates as proposed by Aller (Citation1985). With consideration of the weighting of the layers, the aggregated DRASTIC Index Map contains derived fields lying numerically between 23 and 230 (Hamza et al. Citation2015; Herlinger and Viero Citation2007). The process of preparing the various layers, the final division of the DRASTIC Index Map, the interpolation methods to provide the thematic layers, and even the collection of accurate data can enhance the DRASTIC Index to be reliable work product used in groundwater management (Majidipour et al. Citation2021; Karimi et al. Citation2022). Various criticisms have been aimed at this approach, perhaps the most important of which is the sharpness of the boundaries between the conventional categories of the ultimate DRASTIC index zones (from very high to very low vulnerability) and, how these boundaries are applied to manage groundwater quality. Many efforts have been made to use a fuzzy approach to create a more meaningful assessment of the boundaries to enhance regulatory use of the map (Iqbal et al. Citation2015; Lad et al. Citation2019; Jafari and Nikoo Citation2019; Novinpour et al. Citation2022). However, because of the nature of the data used to create the initial thematic maps and the weighing factors used, the boundary sharpness issues sometimes cannot be resolved using even the ‘fuzzy’ approach.
Another serious and important challenge in using a DRASTIC model approach is the modification of the aquifer and soil properties (mapped properties) used in an attempt to obtain more accurate results and adapt it to undesirable environmental conditions and/or the lack of data in specific model layers. Many papers have been published using a modified DRASTIC method in a number of areas of practice, including aquifer vulnerability (Fritch et al. Citation2000; Sener and Davraz Citation2013; Neshat et al. Citation2014; Singh et al. Citation2015; Sadat-Noori and Ebrahimi Citation2016; Ayed et al. Citation2017; Warren Citation2019; Singha et al. Citation2019; Asfaw and Mengistu Citation2020; Balaji et al. Citation2021; Nasri et al. Citation2021; Ghazavi and Ebrahimi Citation2015; Saha and Alam Citation2014).
In nearly all of the modified DRASTIC model approaches, other factors such as land use have been added to the generic DRASTIC parameters and introduced under new names, such as DRASTIC- LU (Li and Merchant Citation2013; Alam et al. Citation2014; Zafane et al. Citation2017; Kumar and Pramod Krishna Citation2020; Ncibi et al. Citation2020; Persaud and Levison Citation2021; Moghaddam et al. Citation2021). In some cases, the nature of the model used for alluvial aquifer assessment has been changed for use in karst aquifers (Dubey et al. Citation2006; Mimi et al. Citation2012). These modifications are only acceptable when the user is reasonably assured that the standard DRASTIC approach cannot get the desired results and there is a demonstrated need to add additional parameters/layers that better characterize the hydrogeological environment. However, in many cases the generic DRASTIC model yields satisfactory outcomes and there is no requirement to add new layers unless there is indeed an additional factor such as sinkholes that can transfer surface contaminants to greater depths in the aquifer (bypassing of soils and/or the unsaturated zone). In such cases, ignoring these impacts and their effects on the aquifer pollution by DRASTIC may not produce acceptable results.
In a study of an aquifer system located in the western Iran, Taheri et al. (Citation2017) demonstrated and documented that that sinkholes transfer runoff containing pollutants directly into the aquifer system. The generic DRASTIC model did not provide adequate results for karstic aquifer systems (local conditions). By adding a distance layer from sinkholes and sinkhole catchment areas, they introduced a modified model of DRASTIC called Sin-DRASTIC (Taheri et al. Citation2017). In another region of Central Iran, the Abarkouh plain in Yazd province, one of the aquifers has numerous sinkholes that breach unconfined Quaternary sediments and these features allow transfer of contaminants directly into the underlying aquifer. The effects of contamination caused by these sinkholes have been studied by Soldo et al. (Citation2020). Thus far, no report or paper has been available on the evaluation of this aquifer using the DRASTIC model, which can also be used to consider sinkholes in the contaminant transport process. In this research, for the first time, the Sin-DRASTIC method has been applied to evaluate pollution vulnerability of the Abarkouh aquifer. The results of this study can be applied to similar areas globally where sinkholes penetrate through alluvial, fluvial, or unlithified marine sediments that form shallow aquifer systems (including confining beds) above carbonate aquifers.
Geological and hydrogeological background
Study area
Abarkooh or Abarkouh city is located in the southeast of Yazd province, central Iran (). The Abarkouh aquifer is named after this city with area of about 929 km2. The Abarkouh aquifer within the Abarqou sub-Catchment with code 4401 in the Iranian watersheds and study areas coding and classifications document (Ministry of Energy of Iran Citation2005) (). This study area or sub-catchment with an area of 3714 km2 () is located in an arid land by less than one third rainfall of Iran (80 mm/year vs. 250 mm/y). The Abarkouh aquifer is an alluvial unconfined system recharged by west to east flow direction from the western parts. The carbonate rocks and playa evaporate sediments (Abarkouh Playa) surrounded the aquifer on the west, north, and east (Meraat et al. Citation2017).
Figure 1. Site location in the World (a), Yazd province, central Iran (b), Abarqou or Abarkouh Sub-catchment and geological map(c).
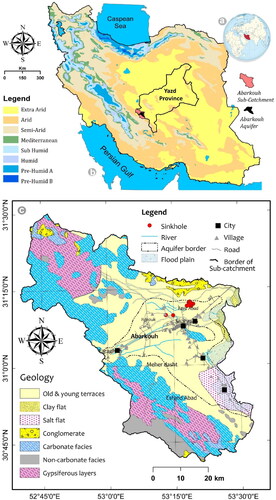
A geophysical survey shows that the Abarkouh Playa basin is filled by more than 500 m of Quaternary sediments (Tabatabai Citation1994). This is confirmed by the drilling of a number of irrigation-water wells constructed on the periphery of the playa (Arzani Citation2003, Citation2007). However, the average alluvial thickness of the aquifer is about 100 m, and according to geophysical studies in the north the aquifer has a maximum thickness of 300 m. In addition, according to these studies, the aquifer margins of the northern highlands are formed mainly by marl, conglomerate and coralline limestone. The western margin of the aquifer consists of Triassic-age limestones and dolomites. Along the southwestern border, the primary lithologies include shale, conglomerate, Permian gray limestones, and a Triassic-age shaley-limestone.
Within the eastern part of the plain, muddy hard substrate and salt sediments (fine sediments) are the predominant facies. The covered limestone of the region, especially in the northern area, is karstic and tends to feed water to the overlying alluvium from the bottom upwards. The boundaries and general geometry of the karst aquifer has not been adequately investigated. This limestone along with buried travertine have karstification potential and can be effective in sinkhole formation based on the limited data available (YRWA Citation2018).
Sinkhole inventory
Sinkholes have been reported at 31 locations within the Abarkouh aquifer. The exact time of formation of these sinkholes is unknown, but according to some oral and administrative reports, they date back to the 1992 to 2000 period. Perhaps the beginning of the formation of these sinkholes coincides with the formation of sinkholes in the Hamadan province (Karimi and Taheri Citation2010; Taheri et al. Citation2015b, Citation2019, Citation2021), which occurs simultaneous with the over-exploitation of groundwater in Iran. This time period can be considered to be the beginning of the groundwater ‘silent revolution’ in Iran (Fornés et al. Citation2005). Data on the sinkhole characteristics are presented in . Most of these sinkholes are the cover-collapse type with others being suffusion types. Illustrations of some of the sinkholes are given in .
Figure 2. Abarkouh sinkholes with documentation numbers: a) S2, b), S15, c) S13, d) S13-1; e) S19; f) S11, g); S18, h) P3, i) S11.
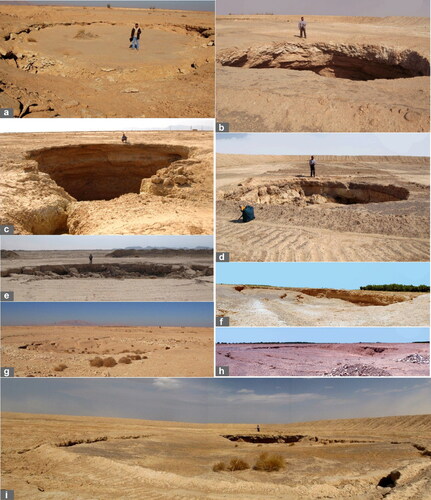
Table 1. The inventory of Abarkouh sinkhole, major axial length (D), and minor axial length (d) in meters.
Sinkhole formation, properties and relevant maps
Sinkholes are concentrated in two main areas, the first one is Fayiz Abad or Feizabad where the largest number of sinkholes (28) are located in the northern part of Abarkouh aquifer. There are 3 sinkholes located near the village of Horouk, where only traces of these features remain at present. According to the geological map of the Fayiz Abad area, the sinkholes are located in Pliocene to Quaternary units. Host sediments within these sinkholes consist of unconsolidated conglomerate, travertine, young terraces, and bedded clays. However, it should be noted that the development of covered karst is associated with the various carbonate rock facies that underlie the area (). Some geophysical studies indicate the existence of sinkholes to a depth of 40 m below surface (Akhavan Ghalibaf and Razavi Citation2018).
Long-term residents in the area suggest that a limited number of sinkholes existed before drilling of deep-water wells, but with construction of a greater number of deep wells, the number of sinkholes has increased. Some of indigenous people in the area believe that the sinkholes formed within the local flood plain of ephemeral streams. Therefore, sinkholes formed during part of the year were subsequently infilled with fluvial sediments during floods. In recent years, some residents of the area have created artificial embankments and have built artificial recharge ponds to increase recharge to their wells. Every year changes to the landscape are made, such as filling sinkholes, leveling the ground surface and repairing embankments.
The history of the formation of these sinkholes passed on by residents of the region may be correct according to the local geological and geomorphological conditions. After each flood, the runoff penetrates through covered karst and near-surface travertine by land crevices, voids within unconsolidated conglomerate, and rapidly recharges the underlying aquifer through the unconsolidated sediments. This process of suffusion and imbalances between overburden sediment and underlying cavities can trigger collapse of the soil mass, eventually causing formation of sinkholes. This hypothesis is similar to the formation of sinkholes in other areas with similar geology. The mechanism of sinkhole-formation in this area is caused by the thin nature of the unconsolidated sediments and the lack of formation cohesiveness, which can result in the form of suffusion sinkholes. The presence of ponor-like cavities and the deep development of the edges of most sinkholes confirms this hypothesis. shows the sinkhole distribution in the Horouk and Fayiz Abad areas. A general conceptual model for the formation of the Faizabad sinkholes is presented in .
Figure 3. The map of Sinkhole catchment factor (SCF)(a), and distance to sinkholes (b) in the study area.
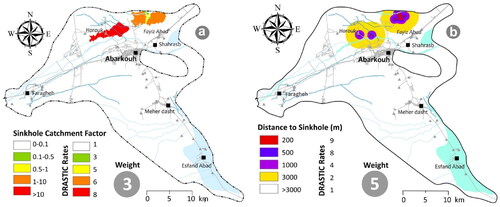
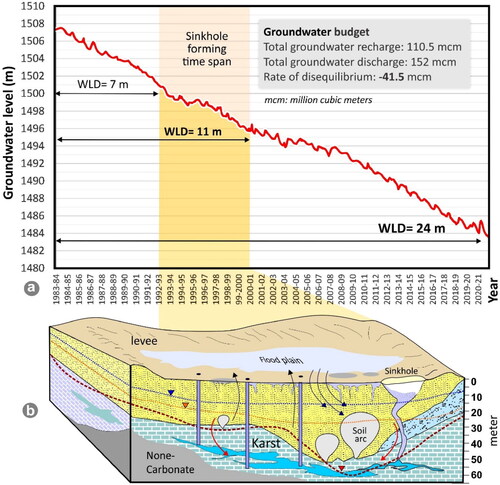
Figure 4. A representative aquifer hydrograph (groundwater level above mean sea level (a.m.s.l) in m) and the time span of sinkhole formation, WLD: Water level decline. (a) a conceptual model for the formation of the Faizabad sinkholes (b).
Sinkholes are open conduits or collection points for surface water and runoff, and can transmit anthropogenic contaminants into an aquifer. In some types, such as cover collapse and bedrock cover collapse sinkholes, it is much easier for percolating runoff containing contaminants, such as chemical fertilizers, brine, solid waste, septic tank discharge, and domestic wastewater, to penetrate deep into an aquifer system. In some types of suffusion sinkholes, the risk of contamination is lower, but because of the accumulation of water, the sinkhole can still facilitate the process of deep penetration of contaminants into an aquifer. Distance to sinkholes and the sinkhole catchment factor (SCF) are two criteria by which the possible effect of sinkholes on groundwater pollution can be roughly evaluated. Proximal locations to a sinkhole have a potentially higher rate of aquifer contamination risk compared to distal locations.
Hydrogeological overview
The Abarkouh aquifer has been overexploited in recent time. The aquifer hydrograph has been deeply declining over the past four decades. shows a representative hydrograph of aquifer water levels during the time span of sinkhole formation. As illustrated, the thickness of alluvium, the water-level decline and its coincidence to soluble covered karstified rocks, can be considered as the main factors in the formation of sinkholes. This aquifer is in an unsustainable and critical state. In addition, the presence of saline and soluble sediments in arid and semi-arid regions along with the development of covered karst tend to create subsidence, and the formation of sinkholes, which reduces the quality of groundwater by allowing movement of saline runoff into the aquifer.
Material and methods
Sin-DRASTIC method
Sin-DRASTIC is a modified DRASTIC model approach used in areas with sinkholes for more accurate evaluation. This method is the same as the generic DRASTIC method (Aller Citation1985; EquationEq. 1(1)
(1) ), with the difference being that the sinkhole layers (by abbreviation Sin) are added to the DRASTIC model as effective and important factors in the transfer of surface contaminants to deeper groundwater. This method was used for the first time by Taheri et al. (Citation2017). The acronym Sin-DRASTIC originates from the two words of the Sin and DRASTIC with nine parameters employed in the approach, which are: D, R, A, S, T, I, C, and Sin (distance to sinkholes and sinkhole catchment factor). The parameters are multiplied by a weight given to each hydrogeological parameter. The form of the equation is the following:
(1)
(1)
where Pj is the rating and Wj is the corresponding weight of each parameter proposed by Taheri et al.. (2017).
Data processing, creation of thematic maps, and weighting of the nine factors
One of the most important issues in conducting a groundwater assessment with a useful model is the compilation of accurate and sufficient data. High-quality data input can bring the results closer to reality. In this study, an attempt has been made to refine all data sets and use the most accurate ones. Despite the effort to do so, the number of field visits is always limited by a variety of factors. The authors had to rely on the available data and correct them on the basis of empirical and expert knowledge (interviews). However, there are still many ambiguities in the type and behavior of aquifer bed rock, covered karst development, the role of the unconsolidated conglomerates (variable cohesiveness), and the high solubility of the travertine (limestone) in causing sinkhole occurrence.
GIS tools were applied to all of the collected data used to prepare the thematic maps and ARC Hydro extension was used to calculate the SCF layer as is shown in more detail (). The method of combining the various datasets within the GIS format is shown within . Weighting of the nine factors used in the Sin-DRASTIC was carefully considered based on the past experience of the authors and the literature (Aller Citation1985; Taheri et al. Citation2017). The weighting applied to the various factors considered are shown in .
Table 2. Rates and weights of the Sin-DRASTIC components.
Depth to water (D) is the amount of water that passes through the surface and the vadose zone and reaches the water table (Aller Citation1985). A thick unsaturated zone could allow a variety of chemical and biological processes to remove some contaminants along with possible adsorption. The pathway of contaminants to the top of the aquifer is very fast in areas where there are surface capture features (depressions), open channels, and open sinkholes, which are really shortcuts instead of flowpaths. In this study, a groundwater depth map was prepared using data from 45 observation wells and interpolation based on the inverse distance weighted (IDW) technique in GIS. The reasons for using the IDW method (for all thematic layers) are presented by Taheri et al. (Citation2021) for flat alluvial plains. Using the generic method, the rates of this layer are shown in the results and its weight was set at 5.
Net recharge (R) refers the amount of water per unit area of land which penetrates the ground surface and reaches the water table (Aller Citation1985). The most important source of net recharge is rainwater, which feeds the aquifer by penetrating the upper layers of the water table. Estimating net recharge is not an easy task and there is usually scarce data for recharge evaluation. In addition to rainwater, the amount of water infiltrated from irrigation and leakage from other sources must also be taken into account. In this study, due to the lack of reliable data, the following simple equations used to evaluate net recharge (Taheri et al. Citation2017):
(2)
(2)
(3)
(3)
(4)
(4)
where RR is rainfall recharge; IRSP: irrigation return flow to the aquifer and surface water percolation.
Precipitation was calculated from long-term data of rain gauge stations in the study area. The percentage of infiltration was obtained from the results of the water balance project of the study area, which is equivalent to rainwater that reaches to the aquifer. The RR amount and irrigation return flow to the aquifer and surface water percolation calculated for the Abarkouh aquifer by the Yazd Regional Water Authority (YRWA) report for the study area (YRWA 2010) were estimated 0.86 and 76.2 mm/yr, respectively.
Aquifer media (A) refers to the geological media composed of consolidated rocks (carbonate and hard rocks) or unconsolidated materials such as loose sediments with different grains of clay, sand, and gravel, forming the aquifer. This definition can distinguish between two types of aquifers, alluvial and karst. In this study, the alluvial aquifer is located on a karstic aquifer, and despite the effects of subsurface karst in creating sinkhole and sediment suffusion, all evaluations have been done for the alluvial aquifer. Karst effects are hidden in the triggering of sinkhole formation and practically influence infiltration and groundwater flow at some distance to sinkholes and SCF parameters. Of course, in rating different layers, generic DRASTIC scores are taken into account for the aquifer media map.
The main challenge in preparing the A layer is access to subsurface information and the type and spatial distribution of sediments. In the absence of geophysical surveys, geological logs of exploratory wells are usually used to prepare the aquifer media map. Despite the existence of geophysical studies in some of the study area, a map has not been prepared for the aquifer media layer using these data. In this study, the type of sediment was determined using 50 geological logs of exploratory wells and public water wells and the aquifer media layer was prepared using the interpolation method in the GIS.
Soil media (S) refers to the topmost part of the vadose is usually composed of weathered and shallow geological and organic matters and controls the direction of percolating water to the vadose zone. It has an average thickness of 2 m or less from the surface. The layer obtained from the 1/250,000 soil map of Yazd region and mainly consists of Aridisols and Entisols/Aridisols containing playa and salt flat sediments (Roozitalab et al. Citation2018).
Aridisols are mineral soils of typical arid regions. A common characteristic of upland Aridisols is a desert pavement consisting of pebbles, gravels or stones. The pavement commonly forms as the result of the removal of fine material by water or wind, leaving the larger-sized fraction on top of the soil, and it can sometimes be partially lithified (Maliva and Missimer Citation2012). Among other things, the pavement helps reduce subsequent erosion (deflation) by protecting the underlying soil (Dregne Citation2011). Entisols are dominant in sandy deserts in the form of sand sheets or sand dunes (Abdelfattah and Shahid Citation2007). This layer is the weakest layer in terms of accuracy of hydraulic properties and its effect on contamination transfer to the aquifer.
Topography (T) is the slope layer in the DRASTIC model and shows the slope and its changes in the surface of the land and as a factor that controls the retention or infiltration of water on the surface and inside the ground plays an important role in directing running water and rainwater to the vadose environment and ultimately to the aquifer. The slope map was extracted from Digital Elevation Model (DEM) in Arc Map GIS software. In this study and other studies based on the DRASTIC model or its modified versions, areas with higher slopes are given lower rate and areas with lower slopes are given higher rates.
Impact of the vadose zone (I) refers to the part of the upper layer of the water table that is located below the soil layer (if there is a soil layer) and above the saturation zone and plays an important role in transferring water and contaminants with it into the saturation zone. This layer concerns the lithology of the vadose zone as opposed to the thickness which is covered by the depth to the water table parameter. Description of this layer requires accurate subsurface geologic data. The constraints and methods that are used to prepare the aquifer media layer are also used for estimation of this parameter, with the difference that in the aquifer media layer, geological and sedimentary materials below the water table were evaluated and in the vadose media the sediments above the water table were mapped. This layer was prepared using the same dataset as the aquifer media layer and was divided into field for use in DRASTIC. It has a weighting factor of 5.
Hydraulic conductivity (C) is last layer in the generic DRASTIC and the seventh of the 9 layers in the Sin- DRASTIC model. It refers to the capacity of aquifer material to pass water under a specific hydraulic gradient is defined as hydraulic conductivity. Hydraulic conductivity can also be a function of the entry of contaminants into the aquifer as it determines the flow rate in the aquifer and its passage. Values for hydraulic conductivity are obtained from aquifer pumping tests.
In many water resources management authorities in different countries, including Iran, there is information related to pumping testing and hydraulic conductivity rates. Transmissivity is one of the hydraulic coefficients, the relation of which is defined by hydraulic conductivity in the form of EquationEq. (5)(5)
(5) . In the absence of data from this layer, either published reports and previous research and average of hydraulic conductivity based on aquifer lithological or sedimentary units can be used, such as those provided by Freeze and Cherry (Citation1979), or the transmissivity dividing by aquifer thickness can be used. The hydraulic conductivity of the aquifer was computed using EquationEq. (5)
(5)
(5) :
(5)
(5)
where k is the hydraulic conductivity (m/s), T is the transmissivity (m2/s), and b is the thickness of the aquifer (m).
Distance to sinkholes (SIN) is the eighth layer of the nine layers of Sin-DRASTIC model. Sinkholes are open conduits that play an important role in transporting contaminants by concentrating surface water flow into the upper zone of the aquifer, and in deeper sinkhole conduits into the saturated zone of the hosted aquifer. Distance from the sinkhole is merely a physical concept that indicates the possibility of concentrating the flow towards the open passages of the sinkholes. This factor is complemented by the sinkhole catchment factor, which is the next criterion in the Sin-DRASTIC model.
Sinkhole catchment factor (SCF) or catchment areas of the sinkholes is the last of the nine layers in the Sin-DRASTIC model. The concept and method of extracting this layer from existing data and its evaluation tools are described in detail in the information provided in and . The weight of this factor is 3 (). Sinkhole catchment factor (SCF) means that each sinkhole can exert its influence in a small sub-basin in addition to the actual diameter of the open hole. The map of distance to sinkholes (Sin) was produced by using multiple ring buffer tool in 3 D analyst box in the GIS media at specified distances from sinkhole points (). Sinkhole catchment areas were designed by use Arc-Hydro tool, an extension of Arc GIS. The weight coefficients for different sinkholes spatial distributions were calculated by Thiessen method (Taheri et al. Citation2017). The area of each Thiessen polygon was considered and divided into the related sub-area. The SCF was multiplied by the major axial length (m) and sinkhole depth (m) for representative the sinkholes on pollutant transport into the aquifer. EquationEquation 6(6)
(6) proposed by the Taheri et al. (Citation2017) to evaluate the potential of pollutant transport through sinkholes to deep aquifer (EquationEq. 6
(6)
(6) ):
(6)
(6)
where Psink is the potential of pollutant transport through sinkhole into the aquifer; Dsinkhole: the major axial length of sinkhole (meter); dsinkhole: depth of the sinkhole (meter). and show steps of SCF preparing.
Figure 5. Flowchart of the sources and steps of data used in this study.
Method of testing the DRASTIC and Sin-DRASTIC model results
Testing the results of each model or validation it is one of the most important tasks that a research team must perform in applying a model to evaluate groundwater vulnerability. The DRASTIC model, with all its universality, is no exception to this rule and must be validated by an appropriate method. Among the methods applied to assess the results of the DRASTIC method, the use of nitrate concentration and its compatibility with different vulnerability zones of the model results is the most common approach for DRASTIC validation. In this research, nitrate concentration has been used to evaluate the results of Drastic and Sin-Drastic models.
The most common approach to evaluate the effectiveness of a model is to evaluate the results within the realities of the actual state or field condition. In groundwater, the results of the model should be in acceptable agreement with the study area hydrogeological situations. In evaluating the DRASTIC model, the results are usually measured by the nitrate concentration in the aquifer. The ROC method was used to validate the outputs of both models by assessing the AUC of 100 randomly placed points in the area maps that contained the predicted vulnerability field in comparisons to the actual measured nitrate concentrations. The ROC calculation methodology and its AUC application are described in full detail in Taheri et al. (Citation2021). This method has many applications in validating the results of models based on the overlaying thematic maps in groundwater critical zone mapping, groundwater index-based sustainability assessments, and sinkhole susceptibility mapping (Taheri et al. Citation2020).
Sensitivity analysis
Sensitivity analysis is an analytical method that assesses series in individual input variables on the final outputs (Napolitano and Fabbri Citation1996). There are several methods for obtaining sensitivity analysis that provide valuable information about the effect of weights and rates on each parameter in the final result (Hamby 1995; Gogu and Dassargues Citation2000).
The map removal and the single-parameter are two main methods for sensitivity analysis were described by Lodwick et al. (Citation1990) and Napolitano and Fabbri (Citation1996), respectively. The map removal analysis used to the sensitivity of the final vulnerability map (Sin-DRASTIC) after removing one or more maps from the input data. The method has been used in several index-based groundwater assessments (Taheri et al. Citation2020a, Citation2020b). This method can be evaluated using EquationEq. (14)(14)
(14) :
(14)
(14)
where S is the sensitivity calculate stated in terms of the variation index, V and v are the unperturbed (Sin-DRASTIC index without removing any parameter) and the perturbed (vulnerability index after removing one or more parameters) Sin-DRASTIC indices, respectively. N and n are the number of data layers used to compute V and v, respectively.
Results
Thematic maps
Thematic maps for the D, R and A factors are presented in . In , the D layer is presented. The weighting factor and final map used for this parameter is presented in . Groundwater depth varies from 11.8 to 105.4 m. Great depth is considered an obstacle to the transmission of contamination and the lowest score (1) is allocated to it. Shallow groundwater depth is a significant agent in the transferal of pollution to the aquifer and in this layer, it is given a score of 9. An isohytal map of precipitation is presented in with the calculated and weighted net recharge map shown in and . Based on water budget of the Abarkouh sub-catchment (), the net recharge map was created using the percent of percolation (0.86), value of IRWSP percolation (76.2), and EquationEqs. (2) (3)(3)
(3) , and Equation(4)
(4)
(4) (). Rainfall rate in this area is low (maximum 120 mm per year and average 80 mm per year). However, most direct recharge occurs via rainfall, and infiltration of return flow of agricultural and industrial waters. Based on the calculated net recharge, the maximum recharge rate is about 130 mm in the western part of the aquifer ().
Figure 6. Depth to water (a), reclassified D layer and its rates and weight (b); isohytal map (c), reclassified R layer and its rates and weight (d); aquifer media (e), and reclassified A layer and its rates and weight.
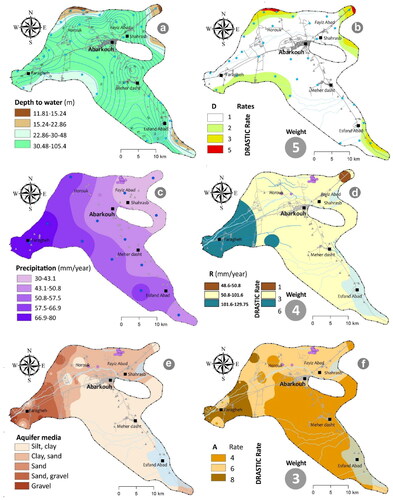
Table 3. Water budget of the Abarkouh sub-catchment.
The aquifer media maps are presented in . The aquifer media map is presented in and is based on lithology of the aquifer matrix. The final map for the DRASTIC analysis is given in and has a weighting factor of 3. This layer was based on Aller (Citation1985) proposed rates for three classes. with final weights of 8, 6 and 4.
The soils map is given in and is based on the local soils types by name with the accompanying physical properties that include lithology and hydraulic properties. There are not many pedological studies related to soil grain size and composition and its effects on contamination transmission in the region. The corresponding DRASTIC rate map is shown in and has a weighting factor of 2. The final thematic map for the T is presented in with the DRASTIC map having a weight of 1 in . The slope of the area is low and therefore a high score is allocated to it (). Based on the proposed rates of generic DRASTIC, this layer was divided into three classes with final weights of 10, 9 and 5 ().
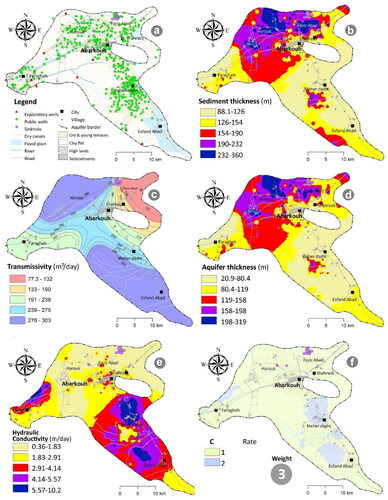
The thematic maps leading to the development of the final aquifer hydraulic conductivity map are shown in . The locations of wells and surface features used in obtaining the geology of the aquifer system are shown in . This map also includes some of the surface features that influence the type of lithology found in the subsurface. The overall sediment thickness map is presented in . An aquifer transmissivity map is shown in and a corresponding aquifer thickness map is shown in . The aquifer hydraulic conductivity map is given in . The final DRASTIC rate map for the two aquifer systems is presented in .
Figure 7. Aquifer media (a), reclassified A layers and its rates and weight (b); soil media (c), reclassified S layers and its rates and weight (d); impact of the vadose zone (e), reclassified I layers and its rates and weight (f).
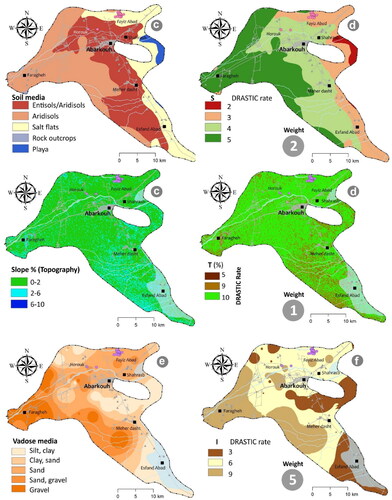
Figure 8. Steps of hydraulic conductivity layer production; (a) exploratory wells and public water wells for sediment thickness map production, (b) sediment thickness map, (c) transmissivity map based on pumping tests, (d) aquifer thickness, (e) hydraulic conductivity layer, and C rates based on generic DRASTIC rates.
Distance to sinkholes (SIN) is one of the two layers added to the DRASTIC model, which was divided into 5 classes by the buffer method in the GIS environment (). The method of preparing this layer and its divisions are presented in . The sinkhole catchment factor (SCF) () is divided into 5 categories. This layer was classified based on two upper and lower end limits (less than 0.1 and more than 10). The highest score was 8 and the lowest was considered 1. The final map can be over-influenced by this layer, if exaggerated in classification and scoring.
Figure 9. Calculation of the SCF factors in several steps by use of the ARC Hydro extension in GIS environment.
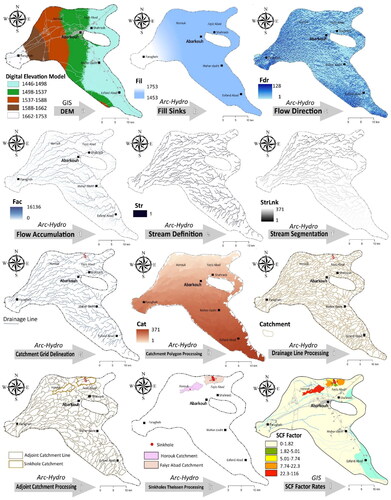
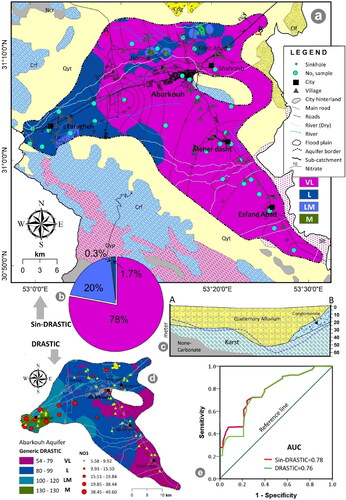
Figure 10. Vulnerability map based on Sin-DRASTIC Index values for the Abarkouh aquifer (a), percent of covered area by every 4 classes of the Sin-DRASTIC Index (b), cross-section of alluvial-bedrock thickness and water level situation (c), Generic DRASTIC Index values (d), and, AUC curves for DRASTIC and Sin-DRASTIC models in the nitrate-based model accuracy assessment (e).
Final Sin-DRASTIC map
Based on the described methods, nine thematic maps were prepared to create the Sin-DRASTIC analysis of the area. Many of these maps required the compilation and analysis of factors to produce the weighted thematic map used in the DRASTIC analysis. The intrinsic vulnerability index of Abarkouh aquifer was calculated by the weighted sum in GIS environment based on EquationEq. (1)(1)
(1) . The resulting numerical values ranged between 62 and 176 full study area.
Without adding the two layers related to Sin-DRASTIC, the generic DRASTIC Index map showed summed values ranging between 54 and 130. Based on the ranges recommended by Aller (Citation1985), the vulnerability classes of the final generic DRASTIC map should be classified into 4 classes (very low, low, low to moderate and medium) (). The generic DRASTIC classifier was used to ascertain the 4 classes of groundwater vulnerability. These four classes are very low (<79; 232.8 km2, 25.2%) , low (80-99; 530.2 km2, 57.3%), low to moderate (100-119; 122.6 km2, 13.2%), and moderate (120-130; 39.6 km2, 4.3%) vulnerability ().
Table 4. Color code for DRASTIC Index ranges based on Aller (Citation1985), and Sin-DRASTIC equivalent classes.
Validation and sensitivity analyses
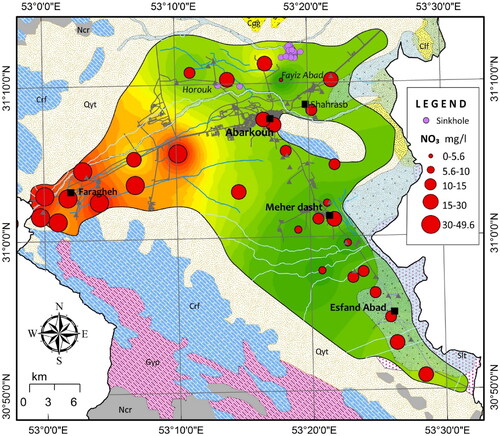
A useful common method for validating a DRASTIC model and its modified variants is to use nitrate concentrations in the groundwater to test the accuracy of the model output. Nitrate concentration in the Abarkouh aquifer ranges from 5.6 to 49.6 mg/l by average concentration about 22 mg/L (). The drinking standard of nitrate concentration based on WHO is 50 mg/l (WHO Citation2011). The normal concentration of nitrate in groundwater is low and is between 10 to 15 mg/L (CDPH Citation2010) and the concentration more than 10 mg/l suggest anthropogenic groundwater contamination (Mueller Citation1995). In this study, using nitrate data and the ROC method the final model results were assessed to determine accuracy of the prediction. The AUC curve is most commonly used to compare models. In general, the higher the AUC, the more accurate the model’s predictions.
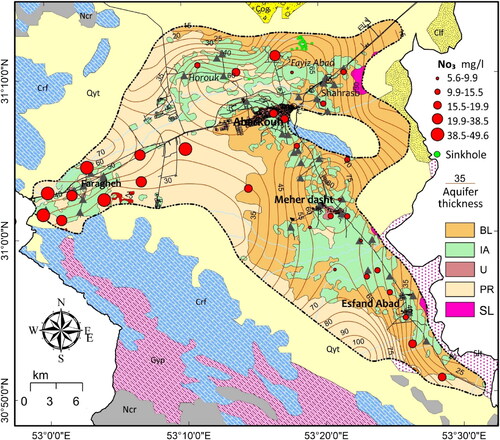
Figure 11. Nitrate concentration (mg/l) in the Abarkouh aquifer, Central Iran.
The final Sin-DRASTIC map was evaluated with values for nitrate concentrations of 15 mg/l. The threshold can be used to validate and to assess the applicability of the developed model. The Sin-DRASTIC index addresses the inherent vulnerability of the aquifer in areas prone to sinkholes based on nitrate concentrations above 15 mg/l in 33 water samples. Based on the calculation of the AUC for the 15 mg/l nitrate concentrations, the values obtained for the final Sin-DRASTIC and DRASTIC models obtained were 78% and 77%, respectively ().
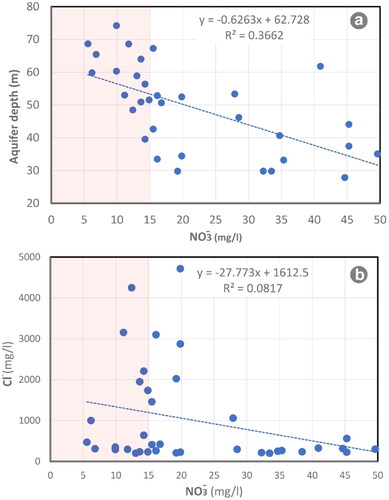
To show the anthropogenic origin of nitrates, there are several methods, such as the use of ratios (NO3 vs Cl, 18O-N vs. 15N-N etc.) and the comparison of the nitrate map with the land use map. High levels of nitrate accompanied with high content of chloride are suspected to come from human and animal waste effluent (Ako et al. Citation2011). The strong positive correlation between NO3- and Cl- is a diagnostic indicator of anthropogenic activity (Demlie et al. Citation2007). shows the thickness of the aquifer versus nitrate concentration. The correlation of this factors is low and shows that there is a weak relationship between nitrate and the thickness of the aquifer. The poor correlation is caused by the relatively high thickness of alluvium in the study area, which promotes reduction of NO3 and reduces the concentration with depth. This is not the negation of anthropogenic effects, but rather it can be caused by the effects of the thickness of the aquifer and redox on nitrate concentration ()
Figure 12. Plot of depth of aquifer versus nitrate concentrations of groundwaters in the Abarkouh aquifer (a); Cl- versus NO3 (b).
There is no strong correlation between land use and nitrate concentration in the study area. However, areas with intensive irrigated agriculture, relatively low aquifer thickness, and urban areas have higher nitrate concentrations ().
Figure 13. Land use map and NO3 concentration in Abarkouh aquifer (BL: bare land, IA; irrigated area, U: urban area, PR: poor range. SL: salt land).
In this study, in order to conduct sensitivity analyses of the 9 layers used to the final map, the results of the sensitivity analysis by use of map removal were calculated by take away one or more maps at a time as shown in . Removal of the ‘I’ layer followed by the SCF, and C layers show the highest mean variations, while the smallest variations are detected after removal of the T, and S parameters.
Table 5. The map removal sensitivity analysis results for Sin-DRASTIC model in the Abarkouh aquifer.
Discussion
The vulnerability for contamination of the Abarkouh aquifer in Central Iran was determined using the DRASTIC method and a modified method called Sin- DRASTIC. The purpose of this evaluation was to investigate the effects of sinkholes in the region on increasing susceptibility to groundwater contamination in Abarkouh aquifer caused by sinkholes. In the DRASTIC method without changing the generic rates/weights or adding other additional layers, the final DRASTIC index had a correspondence to the nitrate concentration in the aquifer (76%). For the Sin-DRASTIC model, the nitrate concentration correlation obtained was 78%. This similarity could be due to the same rates and weights of the seven parameters of in each model. These correlations indicate good accuracy of the data and a proper understanding of the hydrogeological conditions.
However, the most important issue that distinguished the usefulness of the two approaches. The locations of the sinkholes in the generic DRASTIC index map occurred in the very low and low vulnerability zones (). Sinkholes are conduits for surface water and pollutants to enter the aquifer, so their effects cannot be ignored, which would cast doubt on the veracity of the model results. The most important issue in the assessment of Abarkouh aquifer is the impact of the sinkholes on the transfer of contaminants to the aquifer, which is not applied in the generic DRASTIC model. For this purpose, in the Sin-DRASTIC model, two additional parameters called distance to sinkhole and SCF added to the generic DRASTIC. The results showed that this model is more compatible with the hydrogeological conditions of the aquifer and despite the high validity of both model’s correlation to nitrate (76% for generic DRASTIC and 78% for Sin-DRASTIC) sinkholes occur in the low to moderate and moderate zones in Sin-DRASTIC model. Therefore, this model is more realistic and more reliable for use in groundwater planning.
The use of map removal approach for sensitivity analysis () in this study presented that the I and the SCF have the most impact and the topography and soil media have the lowest impacts in the final model. This is caused by the great importance given to the geological media and the aquifer structure (I, C), and the low importance of the topographic effect, which is nearly flat to low slope. These sensitivity ranks are: I > SCF > C>Sin > D > A > R > S > T. Medium importance in this study is related to the depth to water, and this is also expected because this value is relatively high and only 16% of its area has a depth <30 m deep.
The presence of sinkholes can be underestimated with a common misperception that filling them can prevent contamination. Filling of the features can slow the movement of contamination downward, depending on the hydraulic characteristics of the actual fill and the assumption that the features are not branched in geometry. In additional, the formation of new sinkhole based on the issues of over-exploitation of the aquifer and unstable overburden cannot be ignored.
In contrast to this phenomenon, there are several qanats in Yazd province and the study area that have been used for thousands of years without groundwater contamination. This example shows the development of hydrogeoethics patterns in the face of qanats and qanat management in Iran and can reveal the importance of distinguishing between desirable anthropogenic features used in water supply based on cultural and social practices and unwanted anthropogenic phenomenon caused by overdevelopment of aquifers (e.g. the use of deep wells caused declines water levels and sinkholes). The results of this research indicated that even if the DRASTIC model has the highest compliance with the validation factor (here the amount of nitrate concentration), it can still produce unrealistic results based on field conditions and have dubious potential use in groundwater management. Therefore, the use of a modified version of DRASTIC (Sin-DRASTIC) is justified in sinkhole-prone areas.
The practical results of this research showed that the desired results cannot be achieved by simply using the existing models without considering the environmental conditions. The DRASTIC model, with all its universality, is an easy and restrained model in such a way that it does not need to be optimized with changed weights and rates in some areas, and adding another layer or layers does not have much effect on improving the practical results. However, in some areas such as Abarkouh and the Northern plains of Hamadan province, the presence of sinkholes as open features that can directly transfer water and pollution to the aquifer. Therefore, these features need to be addressed in the DRASTIC model. In such cases, adding layers related to the sinkhole, such as the one discussed in this research, is an undeniable necessity.
Conclusions
In this study, the generic DRASTIC model and a modified DRASTIC model (Sin-Drastic) were used to asses of the potential of the Abarkouh aquifer in Central Iran to become contaminated. The generic DRASTIC model was modified by adding two additional parameters, including distance to sinkholes and the sinkhole catchment factor for areas prone to sinkhole development. The validation assessment of the model using nitrate concentrations in groundwater showed that there is good correlation between nitrate contamination in the aquifer and the produced DRASTIC and Sin-DRASTIC maps at 76% and 78% respectively using the area under the curve in an ROC analysis. Therefore, the methods used and the resultant maps are suitable for use in managing groundwater based on strictly pollution vulnerability. The accuracy assessment was obtained for nitrate concentration of 15 mg/l and greater, because the goal of the study was to calculate the inherent groundwater susceptibility to contamination. However, the issue of sinkholes and their impact to aquifer vulnerability was not considered in the generic DRASTIC model. Without considering the effect of sinkholes, the generic DRASTIC results for the aquifer with sinkholes are not sufficiently accurate to truly predict contamination potential. The Sin-Drastic model can be used in other parts of the world that have similar conditions. This model can be an efficient model for coupled alluvial-karst aquifers (or other unlithified sediment/karst aquifer systems) with sinkholes occurring through the overburden.
Using of the generic DRASTIC model for evaluation of alluvial aquifer containing sinkholes requires these features to be incorporated into the model. Otherwise, the accuracy of the groundwater contamination assessment may not be sufficiently accurate to be used in land use and water management planning. The results of this research show that the evaluation of alluvial aquifers that contain sinkholes using the generic DRASTIC model without considering the spatial distribution of sinkholes does not bring yield results. To evaluate areas with sinkholes, it is recommended to use Sin-DRASTIC model instead of the generic DRASTIC model. The most important limitation of this work is access to accurate and correct data on the aquifer geological properties, the degree of contamination of the aquifer, the hydraulic conditions of the aquifer. The accuracy of these data impacts the preparation of thematic maps related to Sin-DRASTIC, and ultimately the overall accuracy of follow management map.
Acknowledgements
The authors would like to thank Yazd Regional Water Authority (YRWA) for providing the database used in this study. Kamal Taheri is very grateful to his wife L. Pourdad and his daughter Kaniya Taheri for their support and cooperation during the field and library studies. The present study is extracted from Saadi Fathi’s MSc thesis in Water Engineering who is grateful to the Water Engineering, soil science department of Malayer University for approving his proposal.
Disclosure statement
The authors have declared that no competing interests exist.
References
- Abdelfattah MA, Shahid SA. 2007. A comparative characterization and classification of soils in Abu Dhabi coastal area in relation to arid and semi-arid conditions using USDA and FAO soil classification systems. Arid Land Res Manage. 21(3):245–271.
- Adams B, Foster SSD. 1992. Land‐surface zoning for groundwater protection. Water Environ J. 6(3):312–319.
- Akhavan Ghalibaf M, Razavi M. 2018. A simple criterion for zoning the ground hole occurrence in the basic studies of railway and power transmission networks in the county of Abarkouh, Yazd. grd. 06(02):49–79.
- Ako AA, Shimada J, Hosono T, Ichiyanagi K, Nkeng GE, Fantong WY, Eyong GET, Roger NN. 2011. Evaluation of groundwater quality and its suitability for drinking, domestic, and agricultural uses in the Banana Plain (Mbanga, Njombe, Penja) of the Cameroon Volcanic Line. Environ Geochem Health. 33(6):559–575.
- Alam F, Umar R, Ahmed S, Dar FA. 2014. A new model (DRASTIC-LU) for evaluating groundwater vulnerability in parts of central Ganga Plain, India. Arab J Geosci. 7(3):927–937.
- Aller L. 1985. DRASTIC: a standardized system for evaluating ground water pollution potential using hydrogeologic settings. Robert S. Kerr Environmental Research Laboratory, Office of Research and Development, US Environmental Protection Agency.
- Arzani N. 2003. The tragedy of ancient qanats in Kavir borders and arid lands, a case study from Abarkoh Plain, Central Iran. Iran Int J Sci. 4(1):73–86.
- Arzani N. 2007. Playa-lake level fluctuation and recent sediments of a terminal Fan-Playa Fringe, Abarkoh Basin, Central Iran.
- Asfaw D, Mengistu D. 2020. Modeling megech watershed aquifer vulnerability to pollution using modified DRASTIC model for sustainable groundwater management, Northwestern Ethiopia. Groundwater Sustainable Dev. 11:100375.
- Ayed B, Jmal I, Sahal S, Bouri S. 2017. Assessment of groundwater vulnerability using a specific vulnerability method: case of Maritime Djeffara shallow aquifer (Southeastern Tunisia). Arab J Geosci. 10(12):1–14.
- Balaji L, Saravanan R, Saravanan K, Sreemanthrarupini NA. 2021. Groundwater vulnerability mapping using the modified DRASTIC model: the metaheuristic algorithm approach. Environ Monit Assess. 193(1):1–19.
- CDPH. 2010. California Department of Public Health Drinking Water Program. Perchlorate in Drinking Water. 2010; [accessed 2010 Mar 14]. http://www.cdph.ca.gov/certlic/drinkingwater/Pages/Perchlorate.aspx.
- Demlie M, Wohnlich S, Gizaw B, Stichler W. 2007. Groundwater recharge in the Akaki catchment, central Ethiopia: evidence from environmental isotopes (δ18O, δ2H and 3H) and chloride mass balance. Hydrol Proc Intern J. 21(6):807–818.
- Dregne HE. 2011. Soils of arid regions. Netherlands: Elsevier.
- Drew D, Hötzl H, editors. 1999. Karst hydrogeology and human activities. Impacts, consequences and implications. Int Contrib Hydrogeol. 20:322.
- Dubey DP, Tiwari RN, Dwivedi UMESH. 2006. Evaluation of pollution susceptibility of karst aquifers of Rewa Town (Madhya Pradesh) Using “DRASTIC” Approach. J Environ Sci Eng. 48(2):113–118.
- Fornés JM, Hera ÁL, Llamas MR. 2005. The silent revolution in groundwater intensive use and its influence in Spain. Water Policy. 7(3):253–268.
- Foster S. 1987. Fundamental concepts in aquifer vulnerability, pollution risk and protection strategy. TNO Proc Inf. 38:69–86.
- Freeze RA, Cherry JA. 1979. Groundwater. New Jersey: Prentice-Hall.
- Fritch TG, McKnight CL, Yelderman JC, Jr, Arnold JG. 2000. An aquifer vulnerability assessment of the Paluxy aquifer, central Texas, USA, using GIS and a modified DRASTIC approach. Environ Manage. 25(3):337–345.
- Ghazavi R, Ebrahimi Z. 2015. Assessing groundwater vulnerability to contamination in an arid environment using DRASTIC and GOD models. Int J Environ Sci Technol. 12(9):2909–2918.
- Gogu RC, Dassargues A. 2000. Current trends and future challenges in groundwater vulnerability assessment using overlay and index methods. Environ Geol. 39(6):549–559.
- Hamza SM, Ahsan A, Imteaz MA, Rahman A, Mohammad TA, Ghazali AH. 2015. Accomplishment and subjectivity of GIS-based DRASTIC groundwater vulnerability assessment method: a review. Environ Earth Sci. 73(7):3063–3076.
- Herlinger R, Viero AP. 2007. Groundwater vulnerability assessment in coastal plain of Rio Grande do Sul State, Brazil, using drastic and adsorption capacity of soils. Environ Geol. 52(5):819–829.
- Iqbal J, Gorai AK, Katpatal YB, Pathak G. 2015. Development of GIS-based fuzzy pattern recognition model (modified DRASTIC model) for groundwater vulnerability to pollution assessment. Int J Environ Sci Technol. 12(10):3161–3174.
- Jafari SM, Nikoo MR. 2019. Developing a fuzzy optimization model for groundwater risk assessment based on improved DRASTIC method. Environ Earth Sci. 78(4):109.
- Karimi H, Taheri K. 2010. Hazards and mechanism of sinkholes on Kabudar Ahang and Famenin plains of Hamadan, Iran. Nat Hazards. 55(2):481–499.
- Karimi D, Bahrami J, Mobaraki J, Missimer TM, Taheri K. 2022. Groundwater sustainability assessment based on socio-economic and environmental variables: a simple dynamic indicator-based approach. Hydrogeology J. 30(7):1963–1988.
- Kavouri K, Plagnes V, Tremoulet J, Dörfliger N, Rejiba F, Marchet P. 2011. PaPRIKa: a method for estimating karst resource and source vulnerability—application to the Ouysse karst system (southwest France). Hydrogeol J. 19(2):339–353.
- Kumar A, Pramod Krishna A. 2020. Groundwater vulnerability and contamination risk assessment using GIS-based modified DRASTIC-LU model in hard rock aquifer system in India. Geocarto International. 35(11):1149–1178.
- Lad S, Ayachit R, Kadam A, Umrikar B. 2019. Groundwater vulnerability assessment using DRASTIC model: a comparative analysis of conventional, AHP, Fuzzy logic and frequency ratio method. Model Earth Syst Environ. 5(2):543–553.
- Li R, Merchant JW. 2013. Modeling vulnerability of groundwater to pollution under future scenarios of climate change and biofuels-related land use change: a case study in North Dakota, USA. Sci Total Environ. 447:32–45.
- Lodwick WA, Monson W, Svoboda L. 1990. Attribute error and sensitivity analysis of map operations in geographical informations systems: suitability analysis. Intern J Geograph Inform Syst. 4(4):413–428.
- Majidipour F, Najafi SMB, Taheri K, Fathollahi J, Missimer TM. 2021. Index-based groundwater sustainability assessment in the socio-economic context: a case study in the Western Iran. Environ Manage. 67(4):648–666.
- Maliva RG, Missimer TM. 2012. Arid lands water evaluation and management. Dordrecht, Netherlands: Springer; p. 1076.
- Margat J. 1968. Vulnerabilite des nappes d’eau souterraine a la pollution: bases de la cartographie [Vulnerability of groundwater to pollution: database mapping]. BRGM Publication 68-SGL 198, BRGM, Orleans, France
- Meraat M, Jafari H, Qishlaqi A. 2017. Assessing the source of nitrate and heavy metals in groundwater resources of Abarkooh plain, central Iran. Eur Water. 58:143–150.
- Mimi ZA, Mahmoud N, Madi MA. 2012. Modified DRASTIC assessment for intrinsic vulnerability mapping of karst aquifers: a case study. Environ Earth Sci. 66(2):447–456.
- Ministry of Energy of Iran. 2005. Iranian watersheds and study areas coding and classifications document .
- Moghaddam HK, Banihabib ME, Javadi S, Randhir TO. 2021. A framework for the assessment of qualitative and quantitative sustainable development of groundwater system. Sustain Dev. 29(6):1096–1110.
- Mueller D. K. 1995. Nutrients in ground water and surface water of the United States: an analysis of data through 1992. Vol. 95, No. 4031. Reston, VA: U. S. Geological Survey.
- Napolitano P, Fabbri AG. 1996. Single-parameter sensitivity analysis for aquifer vulnerability assessment using DRASTIC and SINTACS. IAHS Publications-Series of Proceedings and Reports-Intern Assoc Hydrological Sciences, 235(235):559–566.
- Nasri G, Hajji S, Aydi W, Boughariou E, Allouche N, Bouri S. 2021. Water vulnerability of coastal aquifers using AHP and parametric models: methodological overview and a case study assessment. Arab J Geosci. 14(1):1–19.
- Ncibi K, Chaar H, Hadji R, Baccari N, Sebei A, Khelifi F, Abbes M, Hamed Y. 2020. A GIS-based statistical model for assessing groundwater susceptibility index in shallow aquifer in Central Tunisia (Sidi Bouzid basin). Arab J Geosci. 13(2):1–21.
- Neshat A, Pradhan B, Pirasteh S, Shafri HZM. 2014. Estimating groundwater vulnerability to pollution using a modified DRASTIC model in the Kerman agricultural area, Iran. Environ Earth Sci. 71(7):3119–3131.
- Novinpour EA, Moghimi H, Kaki M. 2022. Aquifer vulnerability based on classical methods and GIS-based fuzzy optimization method (case study: chahardoli plain in Kurdistan province, Iran). Arab J Geosci. 15(4):1–15.
- Persaud E, Levison J. 2021. Impacts of changing watershed conditions in the assessment of future groundwater contamination risk. J Hydrol. 603:127142.
- Ravbar N, Goldscheider N. 2007. Proposed methodology of vulnerability and contamination risk mapping for the protection of karst aquifers in Slovenia. AC. 36(3):461–475.
- Roozitalab, M. H., Siadat, H., & Farshad, A., editors. 2018. The soils of Iran. Switzerland: Springer; p. 255.
- Sadat-Noori M, Ebrahimi K. 2016. Groundwater vulnerability assessment in agricultural areas using a modified DRASTIC model. Environ Monit Assess. 188(1):19.
- Saha D, Alam F. 2014. Groundwater vulnerability assessment using DRASTIC and Pesticide DRASTIC models in intense agriculture area of the Gangetic plains, India. Environ Monit Assess. 186(12):8741–8763.
- Sener E, Davraz A. 2013. Assessment of groundwater vulnerability based on a modified DRASTIC model, GIS and an analytic hierarchy process (AHP) method: the case of Egirdir Lake basin (Isparta, Turkey). Hydrogeol J. 21(3):701–714.
- Singh A, Srivastav SK, Kumar S, Chakrapani GJ. 2015. A modified-DRASTIC model (DRASTICA) for assessment of groundwater vulnerability to pollution in an urbanized environment in Lucknow, India. Environ Earth Sci. 74(7):5475–5490.
- Singha SS, Pasupuleti S, Singha S, Singh R, Venkatesh AS. 2019. A GIS-based modified DRASTIC approach for geospatial modeling of groundwater vulnerability and pollution risk mapping in Korba district, Central India. Environ Earth Sci. 78(21):1–19.
- Soldo B, Mahmoudi Sivand S, Afrasiabian A, Đurin B. 2020. Effect of sinkholes on groundwater resources in arid and semi-arid karst Area in Abarkooh, Iran. Environments. 7(4):26.
- Stempvoort DV, Ewert L, Wassenaar L. 1993. Aquifer vulnerability index: a GIS-compatible method for groundwater vulnerability mapping. Can Water Resour J. 18(1):25–37.
- Tabatabai H. 1994. Gravity and magnetic surveying of central 1\part of Abarkoh Basin. National Iranian Oil Company, internal report
- Taheri K, Gutiérrez F, Mohseni H, Raeisi E, Taheri M. 2015b. Sinkhole susceptibility mapping using the analytical hierarchy process (AHP) and magnitude–frequency relationships: a case study in Hamadan province, Iran. Geomorphology. 234:64–79.
- Taheri K, Missimer TM, Mohseni H, Fidelibus MD, Fathollahy M, Taheri M. 2021. Enhancing spatial prediction of sinkhole susceptibility by mixed waters geochemistry evaluation: application of ROC and GIS. Environ Earth Sci. 80(14):1–28.
- Taheri K, Missimer TM, Taheri M, Moayedi H, Mohseni Pour F. 2020. Critical zone assessments of an alluvial aquifer system using the multi-influencing factor (MIF) and analytical hierarchy process (AHP) models in Western Iran. Nat Resour Res. 29(2):1163–1191.
- Taheri K, Shahabi H, Chapi K, Shirzadi A, Gutiérrez F, Khosravi K. 2019. Sinkhole susceptibility mapping: a comparison between Bayes‐based machine learning algorithms. Land Degrad Dev. 30(7):730–745.
- Taheri K, Taheri M, Komail MS. 2017. Sin-DRASTIC: a modified vulnerability mapping method for alluvial aquifer hosted by karst in the north of Hamadan province, west of Iran. In: EuroKarst 2016, Neuchâtel. Cham: Springer; p. 255–271.
- Taheri K, Taheri M, Mohsenipour F. 2015a. LEPT, a simplified approach for assessing karst vulnerability in regions by sparse data: a case in Kermanshah province, Iran. In Proceedings of 14th Sinkhole Conference, NCKRI Symposium. Vol. 5; p. 483–492.
- Warren RHP. 2019. Modifying Ohio’s DRASTIC ground water potential pollution model to account for karst limestone voids and sinkholes [doctoral dissertation]. The Ohio State University.
- WHO. 2011. Guidelines for drinking-water quality. WHO Chronicle. 38(4):104–108.
- YRWA. 2018.
- Zafane D, Gharbi B, Douaoui A. 2017, November. A new model (DRASTIC-LU) for evaluating groundwater vulnerability in alluvial aquifer of upper cheliff (Algeria). In Euro-Mediterranean Conference for Environmental Integration. Cham: Springer. p. 615–617.
- Zwahlen F, editor. 2004. Vulnerability and risk mapping for the protection of carbonate (karst) aquifers, EUR 20912. Brussels7 European Commission, Directorate-General XII Science, Research and Development; p. 297.