
 ?Mathematical formulae have been encoded as MathML and are displayed in this HTML version using MathJax in order to improve their display. Uncheck the box to turn MathJax off. This feature requires Javascript. Click on a formula to zoom.
Abstract
Groundwater is the main source of drinking water in the Kathmandu Valley (Nepal). To assess the groundwater quality of Lalitpur Metropolitan City (LMC) of this valley, samples were collected in winter and post-monsoon seasons from 35 shallow dug wells and 16 parameters: pH, TDS, EC, Na+, K+, Ca2+, Mg2+, Total hardness, Clˉ, HCO3ˉ, NO3ˉ, NH4+, Fe, PO43-, SO42-, and Total Coliform were analysed. Hydrochemical analysis and GIS-based mapping have revealed spatial and seasonal variations in water quality. The concentration of most of the parameters was higher in the winter samples compared to the post-monsoon. Comparison with the WHO and NDWQS guidelines has revealed anomalous water chemistry. Zones hosting groundwater, suitable and unsuitable for drinking and irrigation were demarcated. However, the presence of pathogens in all the groundwater samples put the entire population of LMC under high health risk. This study bears importance in groundwater exploration, management, and prevention of water-borne diseases.
1. Introduction
Water is essential for survival of life on Earth. Throughout the history of human civilisation, water has played a vital role in mankind’s development. Out of the total volume of water on the earth, 98% is saline sea water, 1.6% is groundwater and 0.004% is surface water. Groundwater, the largest available source of fresh water, is replenished by rainfall and is least polluted as it gets filtered naturally in the soil and aquifer media. Due to the steady rise in population and scarcity of surface water bodies and resources, usage of groundwater has increased manifolds. Groundwater ion chemistry is governed by both natural and anthropogenic factors. The return flow of irrigation and evaporation also influence water chemistry (Rajmohan and Elango Citation2006; Stewart and Aitchison-Earl Citation2020; Tulip et al. Citation2022). Owing to unplanned urbanization, rapid industrialisation, and uncontrolled use of agrochemicals, soil and groundwater resources across the world are getting polluted continuously. Mining of groundwater coupled with improper waste management in densely populated areas has resulted in the depletion of groundwater resources, degradation of water quality, and subsidence of land (Pandey et al. Citation2010; Rehman and Cheema Citation2016). Groundwater quality is also being deteriorated continuously due to an upsurge of salinity, nitrate, iron, fluoride, and heavy metals (Négrel et al. Citation2007; Rezaei et al. Citation2018; Karunanidhi et al. Citation2019; Tang et al. Citation2022) due to excessive use of fertilizers and pesticides, and disposal of untreated sewage (Gautam et al. Citation2013; Syafrudin et al. Citation2021).
The use of polluted groundwater for drinking as well as for domestic and irrigation purposes has direct and indirect adverse effects on health. Although pH does not have any direct impact, very high or low pH can affect health indirectly, since solubility and mobility of various elements are pH dependent. Highly acidic or highly alkaline water is harmful to both plant and animal growth and causes digestive problems for humans. Studies have indicated that acid-base condition in the body is influenced by drinking water which is important for the homeostasis of calcium and magnesium (Rylander Citation2008). Similarly, very high TDS also affects plant growth and blood circulation in human beings. Total hardness (TH) is associated with the concentration of calcium and magnesium in water. Soft water is low in calcium and magnesium content. Low calcium in drinking water may cause strokes and high blood pressure, osteoporosis, kidney stones, obesity, irregular sugar level in the blood, digestive disorder, weak tooth cavity, and rickets (Khurshid and Basheer Citation1998). On the contrary, consumption of hard water for a longer duration may cause gallbladder stones and kidney stones (Kozisek Citation2020). Besides, exceptionally high calcium concentration in blood is associated with digestive disorder, dehydration, diarrhoea, etc. Hypercalcemia is also found correlated with cardiovascular diseases (Bolland et al. Citation2010; Bridget and Kuehn Citation2013; Michaëlsson et al. Citation2013). Magnesium, the fourth most abundant cation in the human body plays a crucial physiological role in body functions. Magnesium deficiency in the human body may cause various gastrointestinal diseases, chronic renal failure, both Type-I and Type-II diabetes mellitus (Gullestad et al. Citation1992; Castiglioni Citation2021; Fiorentini et al. Citation2021), retardation of growth, weakening of muscles, osteoporosis, neuromuscular, hypertension (Rosanoff et al. Citation2021), and cardiovascular diseases (Swaminathan Citation2003; Rylander Citation2008; Rosanoff Citation2013). On the contrary, excess magnesium (>5%) leads to kidney dysfunction, and acute renal failure (Swaminathan Citation2003). Sodium is also a very important constituent for human health. A link has been found between sodium deficiency (hyponatremia) and diseases such as pneumonia, liver cirrhosis, congestive heart failure (CHF), acquired immune deficiency syndrome, etc. (Kovesdy Citation2012). Many other diseases and symptoms such as indigestion, anorexia, hormonal imbalance, arthritis, rheumatism, neuralgia, psychological disorder, and fatigue are found associated with sodium deficiency (Hurley and Johnson Citation2015). On the other hand, excess sodium concentration (>2.5 gm/l) in drinking water causes hypertension (Karppanen and Mervaala Citation2006; Cook et al. Citation2007; Doyle and Glass Citation2010), cardiovascular diseases (Strazzullo et al. Citation2009), and chronic kidney disease (He and MacGregor Citation2007). An optimum level of potassium and sodium–potassium balance is crucial for the proper functioning of human body (National Research Council Citation1989; Cook et al. Citation2009). Symptoms such as diarrhoea, vomiting, depression, muscle weakness, heart rhythm disorder, etc. are common with potassium deficiency (Rose et al. Citation2000). Excess chloride (>250 ppm) in drinking water not only imparts a salty taste but also causes physiological disorder. Phosphate similar to chloride and sulphate anions are acidic in nature, and it breaks the acid-base equilibrium when ingested in a high amount resulting hyper acidic condition or acidosis (Enyoh et al. Citation2018). Intake of high phosphate can damage bones and muscles and increase the risk of heart attacks, strokes, and kidney failures (Komaba and Fukagawa Citation2016). Excess nitrate concentration (>11 ppm) in adults may cause ulcers, gastric cancer (Morales-Suarez-Varela et al. Citation1995; Adimalla Citation2020), colon cancer (Ward et al. Citation2005), recurrent acute respiratory tract infections (Gupta et al. Citation2000), hypertension, and cardiovascular diseases (Napoli and Ignarro Citation2009). In infants, it causes methaemoglobinemia or blue baby disease (Camargo and Alonso Citation2006), anoxaemia, and asphyxia. Similarly, regular high intake of iron exceeding the tolerable limit (>0.5 g) through drinking water may cause adverse health impacts such as diabetes and heart diseases (Ghosh et al. Citation2020), and other diseases of liver, heart, and lung along with hormonal disorder and lowering of immunity (Gurzau et al. Citation2003). These all are possible health hazards due to the anomalous concentration of individual elements. However, the health hazards may be much more severe and complicated when anomalous high or low concentrations of multiple elements (and compounds) act together, or when a person has comorbidity.
Therefore, groundwater quality assessment and monitoring are very important to prevent health hazards. In most of the developed countries, the quality of water resources including groundwater is assessed using well-defined criteria and is regularly monitored. This is integral to water resources assessment, management, and domestic water supply planning. If water quality does not fulfil some essential criteria, or satisfy the required standard, then the water (surface water or groundwater) is treated physically and chemically before supply and use. The standards and guidelines for drinking water quality prescribed and revised by the World Health Organisation (2004, 2011) are considered and followed in countries across the globe. Besides, there are country-specific or even region-specific detailed guidelines for groundwater in general and drinking water in particular. For example, Belitz et al. (Citation2003) of the U.S. Geological Survey presented the framework for groundwater quality monitoring and assessment for California, which is used for that region. Similarly, the European Commission proposed the Water Framework Directive (WFD) (2000/60/EC) for sustainable and integrated management of water resources across Europe. The Groundwater Working Group of the WFD further developed a policy for consistent groundwater monitoring across Europe (European Commission Citation2007a, Citation2007b). The common objectives include monitoring the status and trend of the quantity and quality of groundwater and maintaining the quality criteria of drinking water (Grath et al. Citation2007). Different criteria and thresholds are recommended for drinking water quality standards and environmental quality standards. Significant variations in the criteria thresholds are also found in different European countries due to local (country-wise) risk perception about the chemical constituents and pollutants (Balderacchi et al. Citation2013). Groundwater standards and guidelines (for drinking and irrigation purposes) are also established in most Asian countries including China, India, Japan, South Kora, and even Nepal. However, in Nepal, actual implementation of policy regarding monitoring, assessment, and management of groundwater is lacking.
Groundwater is a vital source of water supply in the Kathmandu Valley since long time. About two decades ago, 45% of people of the Kathmandu Valley were depended on groundwater for drinking and domestic uses (MOPPW. Citation2003). In fact, in most of the cities in Nepal groundwater is the only source of drinking water supply (Pandey et al. Citation2010). In recent years, the use of groundwater resources in the Kathmandu Valley has increased many folds due to a steady rise in population, unplanned urbanization, rapid industrialization, and is adversely affected in terms of quality and quantity (Pradhanang et al. Citation2012; Bhandari et al. Citation2021). However, regular monitoring and strict maintenance of groundwater quality in Nepal for human consumption, agricultural and industrial activities have not been given due attention. Thus, to protect the groundwater resources of the Kathmandu Valley, it is important to map the spatial distribution of various chemical components of groundwater to identify safe and unsafe groundwater zones. A groundwater quality map prepared based on hydrochemical analysis is useful for the demarcation of zones hosting portable groundwater (Annapoorna and Janardhana Citation2015). Such kind of GIS-based water quality zoning maps also help in identifying the key factors governing groundwater chemistry and their relationship with local geology and land use/land cover (Zhang et al. Citation2007). Maps with spatial statistics not only provide information about the occurrence of portable groundwater or its pollution level but also offer a better understanding of the chemical processes governing the subsurface water chemistry (Rezaei and Hassani Citation2018; Yadav et al. Citation2018).
Considering all these facts and factors, a GIS-based groundwater quality zoning in Lalitpur was carried out in this study with the following three objectives. (1) To assess spatial and seasonal variation of groundwater quality, (2) To demarcate groundwater safe and unsafe zones, and (3) To evaluate the number and percentage of the population of this region having high health risk due to use of unsafe groundwater.
2. Study area
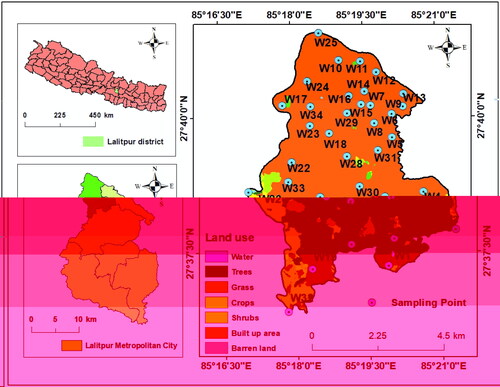
Kathmandu Valley is situated in central Nepal comprising of three administrative districts: Bhaktapur, Lalitpur, and Kathmandu covering an area of 694.27 km2, (Ishtiaque et al. Citation2017). The valley in the Himalayan foothills is spread between 27°31′ to 27°50′ North, and between 85°11′ to 85°34′ East. Altitude of this valley varies between 1213 and 2714 m above the mean sea level (msl). The valley is drained by the Bagmati River and its tributaries which also serve as the main source of water for domestic and irrigation uses (Shakya et al. Citation2019; Chaudhary et al. Citation2021). In the 1980s, the region was mostly covered by natural vegetation (forest, grassland, and shrub) and agricultural land. However, due to rapid urbanisation and population growth, there was a remarkable change in land use/land cover (LULC) in the Kathmandu Valley including LMC in the last three decades when most of the vegetated and agricultural land got converted into impervious urban land (Sarif et al. Citation2020). At present, more than 90% area of Lalitpur is urban land (). Encroachment of cropland and forest located at the fringes of LMC is quite obvious in near future.
Figure 1. Study area with groundwater sample sites and the land-use classes.
Climate in this region is characterized by relatively high temperature and equitably dispersed precipitation throughout the year. The average yearly maximum, minimum, and mean temperature of the basin are 24.2 °C, 12.4 °C, and 18.2 °C, respectively (DHM 2015). Likewise the average annual rainfall depth is around 1500 mm (Pokhrel Citation2018) in the city and about 1800 mm in the slopes and foothills (Thapa et al. Citation2017). Of the total annual precipitation, 75% occurs in the rainy season (June–September), 20% in the pre-monsoon (March to May), and the rest during the post-monsoon period (October–February) (Dongol et al. Citation2005).
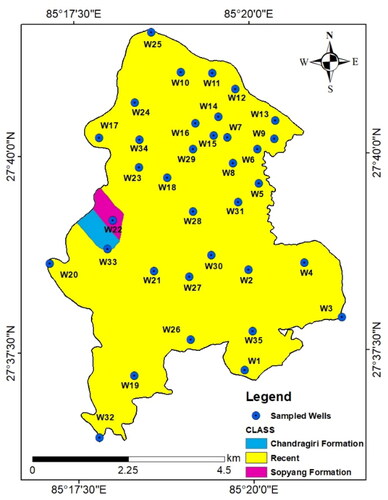
Geologically, Kathmandu Valley is covered by fluvio-lacustrine deposits of Quaternary to Pleistocene ages. Rocks in this region belong to the Chandragiri Formation, the Sopyang Formation, and recent alluvium (DMG Citation1998). Most parts of LMC are covered by recent alluvial deposits (gravel, sand, and silt) of Quarternary age whereas rocks of the Chandragiri Formation and Sopyang Formation (limestone, quartzite, phyllite, and meta-sandstones) are present only in a small part in its west ().
Figure 2. Geological map of Lalitpur Metropolitan City showing rock formations and groundwater sampling points.
The top sediments are composed mainly of unconsolidated sand, silt, clay, and rock fragments (Kharel et al. Citation1998; Sakai Citation2001) forming shallow (≤60 m) and deep (>60 m) aquifers (Gurung et al. Citation2007). The aquifers are unconfined in nature which gets replenished through direct infiltration of rainwater (Shakya et al. Citation2019). Groundwater is the main source of drinking water supply in the Kathmandu Valley, especially in Lalitpur. Although Lalitpur is a metropolitan city, it hosts agricultural land on its fringes. Groundwater is extracted both for domestic as well as for irrigation purposes.
The population rise has led to the urbanisation and decreased fresh water supply. With a growth rate of 4% per year, the population in the Kathmandu Valley increased to 2.5 million (World Bank Citation2022). With a 128% rise in population in the Kathmandu Valley during 1991 to 2011, acute deficit of portable water has resulted. Consequently, the water demand has risen from 35.1 million litres daily (MLD) in 1998 to 470 MLD in 2020 while the average water supply was only 114.2 MLD in 2020 (KUKL Citation2021). To overcome the deficit (355.8 MLD) in water supply, KUKL utilises groundwater (38.52 MLD) as an alternative resource for water supply (KUKL Citation2021).
Lalitpur is the third biggest city of Nepal after Kathmandu and Pokhara located in the south-central portion of Kathmandu Valley and Bagmati waterway on the south side. The city is constituted of 29 municipal wards covering an area of 15.43 km2. By the year 2011, it hosted a population of 226,728 under 54,748 family units (CBS Citation2011). With rapid population growth and settlement, Lalitpur has become one of the fastest-growing cities in South Asia (Maharjan et al. Citation2021). However, unplanned development in terms of rapid urbanisation, rampant industrialisation, waste mismanagement and poor sanitation have caused pollution of both surface water and groundwater, and have led to water-borne diseases in the Kathmandu Valley including LMC. Since groundwater is the main source of drinking water in LMC, groundwater quality monitoring, assessment, and treatment have the maximum importance and priority.
3. Materials and methods
3.1. Sample collection and analysis
A total of 35 groundwater samples were collected from dug wells of dispersed locations in winter (January–February 2020) and post-monsoon period (October–November 2020). All these private shallow wells (depth < 55 m) are mostly used for domestic and irrigation purposes. The reason for sample collection in winter and post-monsoon was to observe seasonal variations in the groundwater chemistry. Since rainfall in the Kathmandu Valley is very low or negligible in winter, there is little influence of rainfall-induced recharge on groundwater chemistry. On the contrary, groundwater chemistry is highly influenced by the rainfall–recharge process during the monsoon season which is reflected in the post-monsoon groundwater quality. Parameters such as pH, TDS, and EC were measured in situ by multi-probe. The samples were stored in a refrigerator at 4 °C before analysis. Chemical analysis of major ions (Na+, K+, Ca2+, Mg2+, NH4+, PO43-, SO42-, Clˉ, HCO3ˉ, NO3ˉ, and Fe) were carried out in the Laboratory of Central Department of Environmental Science, Tribhuvan University using standard methods recommended by American Public Health Association (APHA Citation2005). Of the cations, Na+ and K+ were analysed using flame atomic absorption spectrophotometry. Total hardness (TH), Ca2+ and Mg2+ were measured using EDTA (Ethylene Diamine Tetra-acetic Acid) titration. The concentration of NH4+ and Fe was determined using UV-spectrophotometer. Of the anions, Clˉ was measured by Argentometric Titration method, SO42-, PO43-, and NO3ˉ by spectrophotometer, HCO3ˉ by alkalinity concentration, and TC by incubation at 45 °C.
3.2. Reliability and error analysis of measurements
Assessment of reliability and error of the chemical analysis of groundwater samples is important for the estimation of the measurement uncertainty, the sampling bias, as well as spatiotemporal variability in water quality (Guigues et al. Citation2016; Wali et al. Citation2020). The objectives, sampling sites, the number of samples, analytical parameters, and analysis techniques were determined a priori. The laboratory analysis including pre-treatment, preservation, and chemical analysis of samples was carried out in the laboratory of the Central Department of Environmental Science (CDES), Tribhuvan University (Nepal) by applicable national and international procedure, accredited as per ISO-17015 Standard (ISO 2005). The data analysis was performed as per the procedure of APHA (Citation2005). Analysis of the groundwater samples of both seasons was performed in triplicate. The physicochemical components’ analysis accuracy (Topol and Mitchell Citation1985) was evaluated through the ion-balance error (IE) which was estimated using EquationEquation (1)(1)
(1) .
(1)
(1)
3.3. Groundwater contamination
The degree of contamination (Cd) method developed by Rapant et al. (Citation1995) is widely used for the estimation of heavy metal pollution levels in the water. In this study, this method was employed for the estimation of the pollution level in groundwater using basic physicochemical parameters. In this method, the water quality is evaluated by computing the contamination level through the sum of the contamination factors of each chemical component exceeding the upper permissible limit. The Cd method thus, summarizes the combined effects of a number of quality parameters considered to be unsafe in drinking water (Rubio et al. Citation2000; Boateng et al. Citation2015). As proposed by Backman et al. (Citation1998) the degree of contamination (Cd) may be presented as:
(2)
(2)
where Cfi is the contamination factor calculated using EquationEquation (3)
(3)
(3) :
(3)
(3)
where CMi, and CSi, respectively, are the analytical value and upper permissible concentration for the ith component. Following Rubio et al. (Citation2000), the degree of anomalous concentration of chemicals in the groundwater was categorized as, low (Cd ˂ 1), medium (Cd = 1 – 3), and high (Cd > 3).
3.4. Mapping spatial distribution and groundwater quality zoning
The spatial distribution of the groundwater quality parameters was mapped using ArcGIS 10.2 software. Point values of the parameters at the sample locations were interpolated using Inverse Distance Weight (IDW), which is a deterministic interpolation technique. The IDW interpolation works with a simple logic: the influence of data points is inversely proportional to their distance from the target location, and hence closer data points have similar values (and vice-versa). Thus, its computation is also straightforward (Chen and Liu Citation2012). With well-dispersed data points, the IDW interpolation technique produces reasonably accurate interpolated values as the mathematical equation passes through the actual data points (Yang et al. Citation2015). Thus, the use of IDW interpolation seems logical and appropriate to generate thematic maps for different hydro-chemical parameters. The basic formula of IDW interpolation is:
(4)
(4)
where v* is the unknown value to be determined at any location; w is the weight and x is the value at the known point.
The weight is an inverse distance of a point to each known point value that can be calculated using EquationEquation (5)(5)
(5) as shown below.
(5)
(5)
In EquationEquation (5)(5)
(5) , p is the power, and the higher the power; the lower will be the weight. An optimum value between 1 and 2 is generally used for power p. In this study, power 1 was used. Despite errors generated by interpolation, the integration of spatial distribution maps of various chemical components helps in the demarcation of zones with groundwater quality suitable and unsuitable for drinking and irrigation (Bhuiyan and Champati Ray Citation2017; Rezaei and Hassani Citation2018).
Concentrations of the groundwater quality parameters were compared with the permissible limits for drinking purposes set by World Health Organization (WHO Citation2011) and Nepal Drinking Water Quality Standard (NDWQS Citation2005). A groundwater quality zoning map was generated through integration of the chemical parameters with suitable ranks (). Weights (cumulative ranks) were obtained through addition of ranks of the constituent chemical parameters. To obtain a drinking water quality map, the weights were classified into five classes viz. ‘Very Good’ (weight: 16 with all 16 parameters having rank 1), ‘Good’ (weight: 17 to 24 with majority parameters having rank 1), ‘Moderate’ (weight: 25 to 32 with most of the parameters having rank 2), ‘Bad’ (weight: 33 to 40 with many parameters having rank 3), and ‘Very bad’ (weight: 40 to 47 with most of the parameters having rank 3) (). In the same way, the groundwater contamination map was generated using the Cd values and was classified following the scheme proposed by Rubio et al. (Citation2000) as discussed.
Table 1. Weights assigned to groundwater parameters for drinking purpose.
Table 2. Groundwater quality zoning for drinking through classification of weightage.
Similarly, suitability of groundwater for irrigation was evaluated through different ionic species present in groundwater and was classified following the guidelines by Wilcox and Durum (Citation1967) as well as by Ayers and Westcot (Citation1985). Total dissolved solid (TDS) reflects the state of inorganic contamination and is a measure of ionized species in the aquatic environment (Debels et al. Citation2005). TDS and Electrical conductivity (EC) were used to measure the water salinity (Fipps Citation2003), along with chloride (Clˉ) and are indicators of salinity hazard, the most important water quality parameter for plant production (Salifu et al. Citation2017). The sodium percentage (Na %) (Hussein Citation2004), sodium adsorption ratio (SAR) (Chen et al. Citation2017) and permeability index (PI) (Li et al. Citation2016) were calculated by using the standard formulae (EquationEquations 6–8). Suitability of groundwater for irrigation also depends on the equilibrium state of magnesium and calcium since a high amount of magnesium imparts adverse effects on soil and plant due to high alkalinity (Doneen Citation1964; Al-Shammiri et al. Citation2005). Hence, the magnesium adsorption ratio (MAR) (Rengasamy and Marchuk Citation2011) was calculated using the standard formula (EquationEquation 9(9)
(9) ).
(6)
(6)
(7)
(7)
(8)
(8)
(9)
(9)
The ranks and weights were assigned to groundwater parameters for irrigation () appropriately. The integrated map was reclassified as ‘Very good’, ‘Good’, ‘Moderate’, ‘Bad’, and ‘Very bad’ to obtain the final irrigation zoning map ().
Table 3. Weights assigned to groundwater parameters for irrigation purpose.
Table 4. Groundwater quality zoning map for irrigation.
3.5. Groundwater induced health risk
To assess groundwater-induced health risk in LMC, a municipality ward-wise population map was prepared using the demographic data obtained from the National Population and Housing Census of Nepal (2011). Since the recent population census (of year 2021) is not yet published, the projected population in LMC was computed using the population growth-rate data obtained from the World Bank (World Bank Citation2022). Groundwater induced health risk was assessed through visual comparison and correlation of drinking and irrigation water quality maps with the projected municipality population and population density maps.
4. Results and observations
4.1. Spatial and seasonal variation in groundwater quality
The difference was noticed in the concentration of the chemical parameters in the winter and post-monsoon samples of groundwater. The concentration of majority of the chemicals was higher in the winter samples ().
For winter,
For the post monsoon,
So, the mean ion-balance error of the samples for winter and post-monsoon seasons was respectively, ± 4.82 % and ± 4.61 % (as shown above) indicating the reliability of the measurements and little sampling bias. However, this also reflects seasonal variation in the groundwater quality.
Statistical analysis (correlation analysis) revealed an association among several chemical parameters in the groundwater of LMC, which also indicates seasonal variation. The association was identical in nature (directly or inversely proportional) between certain parameters both in winter and the post-monsoon, despite variation in their strength of association. For example, an association between EC and TDS, between iron and ammonia, and of TH with calcium and magnesium were strong and positive in both the seasons. Similarly, a strong inverse relation between pH and TC in both the seasons. However, diverse and exclusive associations could be noticed among some other parameters either in winter or in the post-monsoon as is shown in . For example, a statistically significant association was noticed for iron with magnesium as well as nitrate in winter but not during the post-monsoon. The strong NO3ˉ was most likely form the agricultural input (Wei et al. Citation2017; Li et al. Citation2018). Although, the use of fertilizers not only adds NO3ˉ in groundwater but also add Ca2+, Mg2+, Clˉ, PO43- and K+ (Hagedorn and Cartwright Citation2009), which can lead to a change in the groundwater geochemistry (Li et al. Citation2018). Similar season-specific associations were noticed among some other parameters which need further study, detailed analysis, and reasoning.
Geospatial mapping of hydro-chemical parameters obtained through interpolation of the point values also revealed the spatial variation in the groundwater chemistry of LMC, as discussed in the following sub-sections.
Table 5. Statistics of groundwater chemistry in Lalitpur Metropolitan City.
Table 6. Association among various chemical parameters in the groundwater of Lalitpur Metropolitan City in Winter and Post-monsoon as revealed by the Pearson moment correlation coefficient.
4.2. Physicochemical parameters
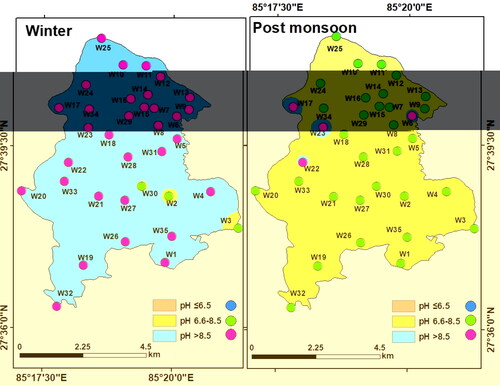
pH: Normal pH of groundwater varies between 6.5 and 8.0 (Islam et al. Citation2014). However, at LMC, groundwater was alkaline, as the pH values of most of the samples vary in the range of 8.38–9.54 (mean: 9.15) in winter and within 7.28–9.54 (mean 7.97) in the post-monsoon (). While pH of only five post-monsoon samples was above the WHO and NDWQS limit (8.5), pH was above this threshold in as many as 30 out of 35 winter-samples (>85%). A slight decrease in groundwater pH during the post-monsoon period was probably due to the mixing of fresh rainwater. Thus alkaline nature of groundwater samples is attributed mainly to the lithology of the study area consisting of quartzite, argillaceous limestone, and dolomitic limestone of the Chandragiri, Sopyang, and recent formations (Acharya and Paudyal Citation2019).
Figure 3. Spatial distribution map of pH of study area.
Total dissolved solid (TDS): TDS is an important attribute in determining the taste of water (Christensen et al. Citation2018). In natural water, TDS consists of degraded gases, as well as decomposable and non-decomposable compounds (Demirel Citation2007). In this study, TDS in the groundwater samples varied between 137 and 1063 mg/L (mean: 491.71 mg/L) in winter and between 112 and 1051 mg/L (mean: 466.35 mg/L) in the post-monsoon indicating significant dissolution of minerals in the aquifers ().
Figure 4. Spatial distribution map of Total Dissolved Solids of study area.
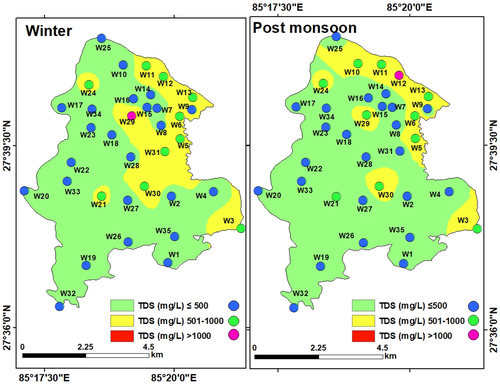
The interpolated maps show that TDS in major parts of LMC was within the permissible limit for domestic use (500 mg/L). Only at two locations, TDS was above the maximum permissible limit of 1000 mg/L in both seasons. Such isolated high values are most likely due to the occurrence and dissolution of minerals from the heterogeneous geological formations constituting the aquifers (Nagarajan et al. Citation2010). Furthermore, high TDS concentration in groundwater may originate from anthropogenic activities like sewage discharge (Das and Nag Citation2017).
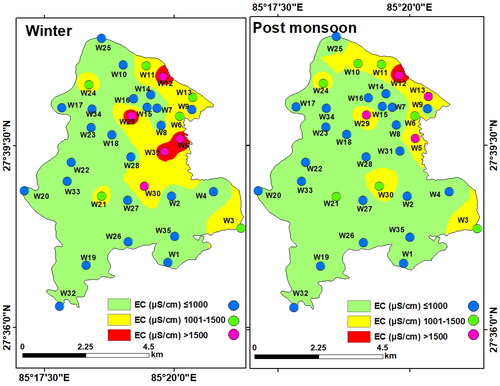
Electrical Conductivity (EC): EC is an indicator of the TDS content in water (Hem Citation1985). In LMC, the EC values varied between 276 and 2127 μS/cm (mean of 983.6 μS/cm) in the winter, and between 226 and 2021 μS/cm with a mean of 913.63 μS/cm during the post-monsoon. High EC values are found in the northern, eastern, and central parts of LMC, owing to a higher concentration of disintegrated ionic particles (). Additionally, metal contents, ammonium, and nitrate are also responsible for high EC in the groundwater (Dzwairo et al. Citation2006). This could be due to the seepage of agrochemicals and leaching of the sewage in the aquifers.
Figure 5. Spatial distribution map of Electrical Conductivity of study area.
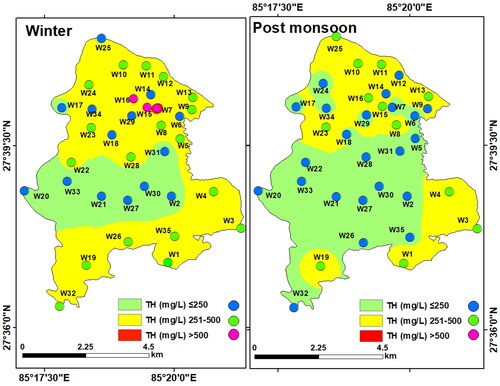
Total Hardness (TH): Ions such as HCO3ˉ, CO32−, SO42−, and Clˉ of Ca2+ and Mg2+ are the determining factors for TH in water (Jain et al. Citation2010). Industries are not recommended for the utilization of hard water due to its corrosion effect on metals. A high degree of hardness can damage the distribution pipeline, may cause high expenditure on washing substances, hardening of tissues due to the deposition of insoluble calcium compounds in the blood circulation and urinary system, and diseases related to the digestive system (CPCB Citation2008). TH as calcium carbonate was found to vary between 100 and 612 mg/L (mean: 306 mg/L) during winter and between 80 and 485 mg/L (mean: 253.03 mg/L) in the post-monsoon. reflects spatial distribution of TH in LMC, which was mostly within the acceptable range for drinking. Only three winter samples exceeded the limit of 500 mg/L. TH in the groundwater is attributed to the carbonate rocks such as limestone, which is dominantly present in the Kathmandu Valley (Acharya and Paudyal Citation2019).
Figure 6. Spatial distribution map of Total Hardness of study area.
4.3. Cations
The estimated values of the cations could be arranged in descending order as: Ca2+ > Na+ > Mg2+ > K+ > NH4+ for both winter and post-monsoon.
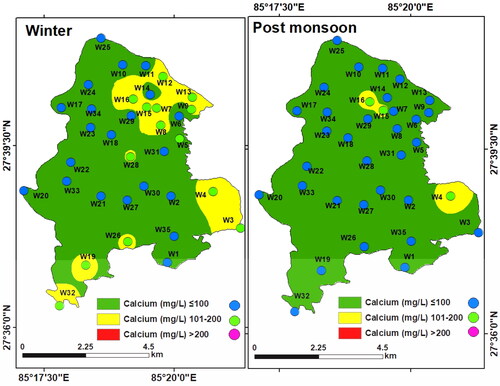
Calcium (Ca2+): Calcium was found to vary between 25.6 and 191.2 mg/L (mean: 87.36 mg/L) in winter and between 15.38 and 155.6 mg/L (mean: 63.57 mg/L) in the post-monsoon period. Calcium in 14.28% of the winter samples and 25.71% of the post-monsoon samples was below the NDWQS threshold (200 mg/L). Relatively high Ca2+ was found in some north-western and south-eastern parts of the study area although the concentration was lower than the threshold (). This is possibly due to the dissolution of carbonate rocks (Ravish et al. Citation2019).
Figure 7. Spatial distribution map of Calcium ion of study area.
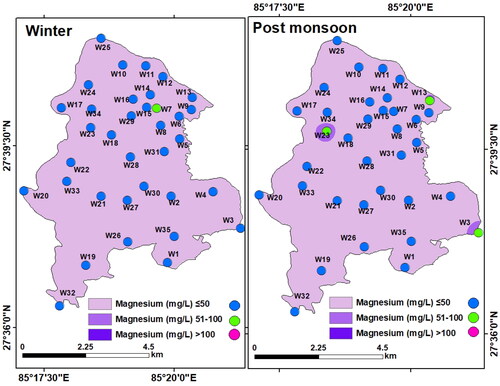
Magnesium (Mg2+): Magnesium in the collected groundwater samples varied between 2.4 and 61.68 mg/L (mean: 22.21 mg/L) in winter and between 2.4 and 81.87 mg/L (mean: 22.14 mg/L) in the post-monsoon. Thus, the spatial distribution of Mg2+ was also within the permissible limit (100 mg/L) of WHO and NDWQS ().
Figure 8. Spatial distribution map of Magnesium ion of study area.
Sodium (Na+): Sodium is crucial in determining the groundwater chemistry for the use in agricultural purposes since it is directly proportional to soil’s hardness and inversely proportional to its permeability (Tijani Citation1994). Sodium content in the groundwater samples was quite high both in winter (33.2 to 70.3 mg/L, mean: 79.8 mg/L) and post-monsoon (13.9 to 79.8 mg/L, mean: 53.65 mg/L) but was within the maximum permissible limit (200 mg/L) for drinking purpose. Comparatively higher Na+ (>50 mg/L) in the study area may be due to multiple geogenic and anthropogenic influences (Tian et al. Citation2016; Ravish et al. Citation2019). The difference in the spatial variation of Na+ in winter and the post-monsoon was the effect of monsoon rainfall ().
Figure 9. Spatial distribution map of Sodium of study area.
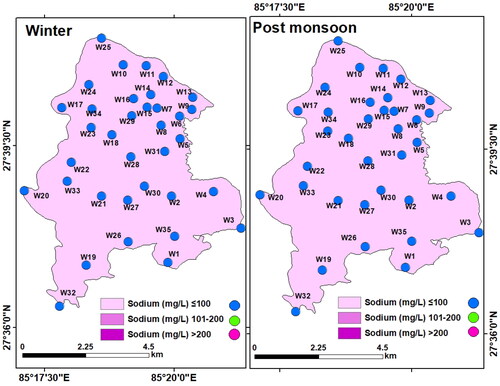
Potassium (K+): Potassium was found to vary from 0.84 to 41.5 mg/L (mean: 16.21 mg/L) in winter and from 0.27 to 50.3 mg/L (mean: 15.87 mg/L) in the post-monsoon. K+ concentration of all the samples falls under the permissible limit of NDWQS (100 mg/L). However, spatial and temporal variations in K+ in the LMC is evident (). Relatively, higher K+ concentration is most likely due to the mixing of weathered carbon and silica-enriched rocks, seepage of agrochemical residue, and outflow of the sewage from the settlement and industries (Karim and Veizer Citation2000; Zhang et al. Citation2007; Selemani et al. Citation2017).
Figure 10. Spatial distribution map of Potassium of study area.
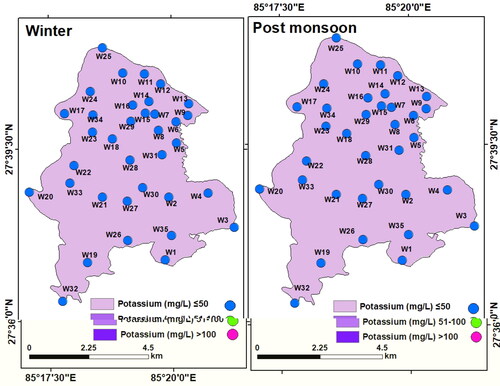
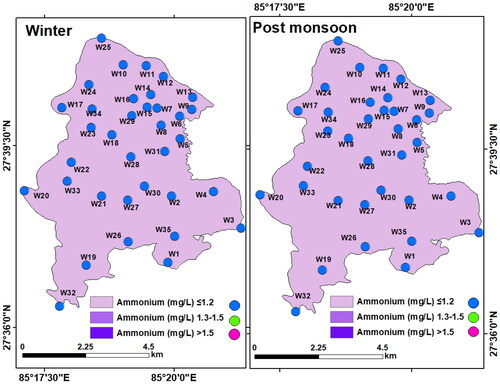
Ammonium (NH4+): Ammonium (NH4+) content in all the samples was low both in winter (< 0.1 to 0.99 mg/L, mean: 0.46 mg/L) and post-monsoon (< 0.1 to 0.46 mg/L, mean: 0.13 mg/L). The ammonium (NH4+–N) concentration did not exceed the WHO permissible limit (1.5 mg/L). However, the interpolated maps of NH4+ have shown sporadic higher concentration (>0.3 mg/L) in the winter (). This is similar to the findings of Sbarbati et al. (Citation2018).
Figure 11. Spatial distribution map of Ammonium in LMC.
4.4. Anions
Anion’s dominance in the groundwater of LMC was observed in the descending order as HCO3ˉ > Clˉ > SO4ˉ > NO3ˉ > PO43- in both winter and the post-monsoon samples.
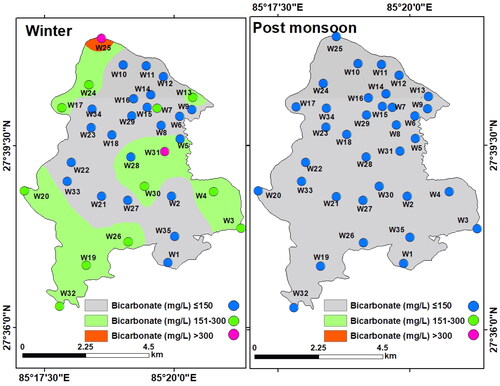
Bicarbonate (HCO3ˉ): Bicarbonate exists in the aqueous solution as components of calcium and carbonate combined with carbon dioxide (Jain et al. Citation2010). Bicarbonate values in the groundwater of LMC varied from 20 to 450 mg/L (mean: 148.29 mg/L) in winter and between 15 and 105 mg/L (mean: 39.29 mg/L) in the post-monsoon. The spatial distribution map of bicarbonate shows a relatively low concentration in winter and a higher concentration in the post-monsoon. Besides, HCO3ˉ in groundwater during the post-monsoon was within the permissible limit (300 mg/L) but was higher in the winter season ().
Figure 12. Spatial distribution of Bicarbonate in the groundwater of LMC.
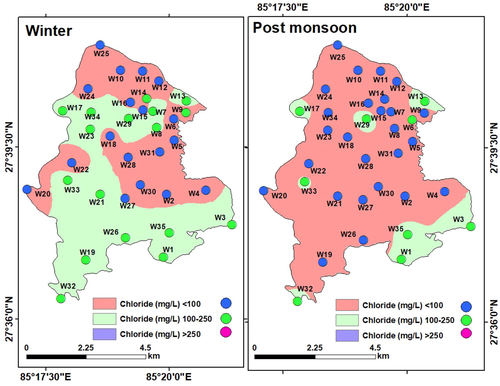
Chloride (Clˉ): Chloride is a steady component of groundwater, accumulated either from the dissolution of rocks and minerals or from agrochemicals and sewage (Hem Citation1985; Ritzi et al. Citation1993; Townsend and Whittemore Citation2005; Prasanth et al. Citation2012). The chloride level in LMC varied in the range of 22.72 to 241.4 mg/L (mean: 103.71 mg/L) in winter and from 20.45 to 220.1 mg/L (mean: 80.87 mg/L) during the post-monsoon, and thus was within the permissible limit of WHO (250 mg/L) in both the seasons (). Only a very few locations had a higher concentration of chloride, which was probably due to the leaching of chloride-containing rocks and minerals in the aquifers.
Figure 13. Spatial distribution of Chloride in the groundwater of LMC.
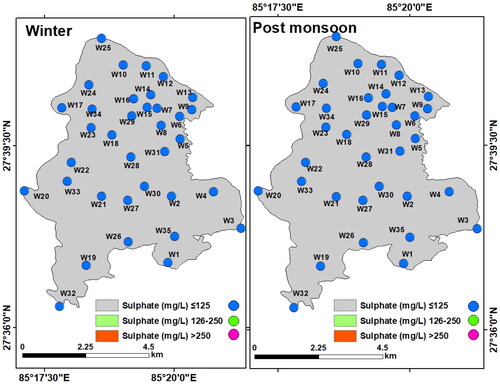
Sulphate (SO42-): Sulphate exists in nature in dissolved form along with sodium, magnesium, and calcium salts. The concentration of sulphate in groundwater may vary seasonally due to infiltration of rainwater and runoff water (Samantara et al. Citation2017). Sulphate concentration in LMC varied between 5.52 and 77.70 mg/L (mean: 21.02 mg/L) in winter and between 4.42 and 63.22 mg/L (mean: 16.47 mg/L) in the post-monsoon. Although the sulphate concentration was high in the central and eastern parts during the post-monsoon, it was under the acceptable range of the WHO standard (250 mg/L) in both seasons ().
Figure 14. Spatial distribution of Sulphate in the groundwater of LMC.
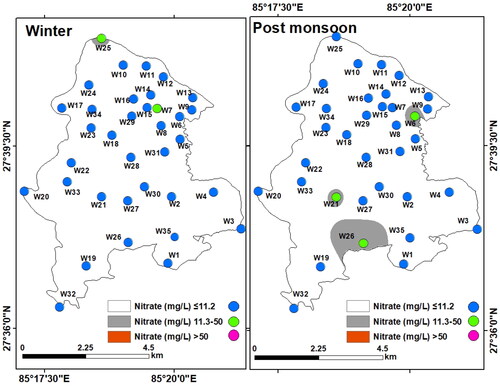
Nitrate (NO3-): Nitrate levels in all groundwater samples were found to vary between 4 and 13.7 mg/L (mean: 6.43 mg/L) in winter and between 4.4 and 29.6 mg/L (mean: 6.58 mg/L) in the post-monsoon and was within the WHO desirable limit (50 mg/L). A slightly higher concentration of nitrate was found in the southern part of LMC during the post-monsoon compared to that during the winter season (). The high nitrate concentration is probably due to the disposal of human and animal waste and the leaching of septic tanks (Townsend and Whittemore Citation2005; Shakya et al. Citation2019).
Figure 15. Spatial variation of Nitrate in the groundwater of LMC.
Phosphate (PO43ˉ): Phosphate levels in the groundwater samples from LMC varied between 0.23 and 3.58 mg/L (mean: 0.78 mg/L) in winter and between 0.104 and 3.65 mg/L (mean: 0.45 mg/L) in the post-monsoon. The interpolated maps revealed low phosphate concentration in most parts of LMC (). However, about 20% of the winter samples and 11.42% of the post-monsoon samples exceeded the permissible limit of WHO (1 mg/L). The high values may be due to contamination of groundwater through the leaching of manure and chemical fertilizers (Domagalski and Johnson Citation2011).
Figure 16. Spatial distribution map of Phosphate of study area.
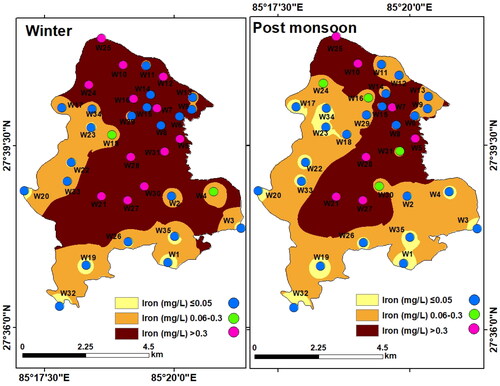
4.5. Iron (Fe)
Iron is a dominant metal content in groundwater. The iron content in the groundwater samples of LMC was found to vary between < 0.01 and 10.16 mg/L (mean: 1.02 mg/L) in winter, and between < 0.01 and 4.19 mg/L (mean: 0.42 mg/L) in the post-monsoon. Fe content in ∼66% of the winter samples and 80% of the post-monsoon samples were below the permissible limit (0.3 mg/L), whereas Fe in ∼34% of the winter samples and 20% of the post-monsoon samples exceeded 0.3 mg/L. Iron was found with relatively higher concentrations in the winter samples (). The interpolated maps show ‘high’ Fe in a major part of LMC compared to the NDWQS limit. This is to be noted that WHO does not have a drinking water guideline for iron as iron content even of 2 mg/L does not have any health-hazard (WHO Citation2011, Citation2017). Iron in the groundwater of LMC was mostly below 2 mg/L. This is most likely due to absence of iron-bearing formation in the shallow aquifers in this region (Samantara et al. Citation2017).
Figure 17. Spatial variation of Iron in the groundwater of LMC.
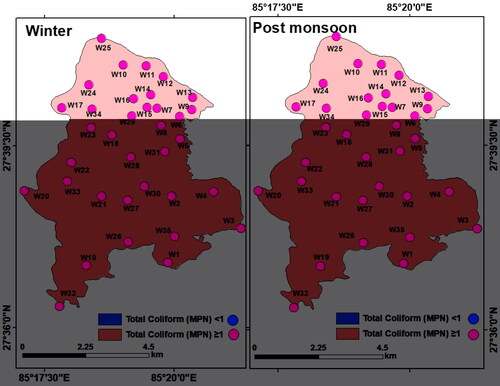
4.6. Microbial parameters
Among the microbial parameters, concentration of coliform bacteria Escherichia coli (E-coli) was found high in both seasons in all the 35 groundwater samples. The E-coli values varied between 56 and 254 most portable number (MPN) (mean: 123.09 MPN/100 mL) in winter and between 68 and 315 MPN/100 mL (mean: 151.48 MPN/100 mL) during the post-monsoon. Common reasons behind the high coliform content in groundwater include open defecation (Sorensen et al. Citation2016; Kapembo et al. Citation2019), leaky sanitation system (Pujari et al. Citation2007; Graham and Polizzotto Citation2013; Sorensen et al. Citation2016; Bhallamudi et al. Citation2019; Dasgupta et al. Citation2021), and inadequate and faulty sewage management structures (Arnade Citation1999; Lu et al. Citation2008; Bhandari et al. Citation2021). Open defecation, leakage, and underground leaching of pollutants into the aquifers impart acute health risk. Contrary to the claim by the Nepal Government that the Kathmandu Valley is free from open defecation, in reality, open defecation is a common practice in the LMC due to lack of awareness, practice, and inadequate public toilets (Ojha Citation2019). The interpolated maps show a high concentration of total coliform (> 1 MPN/100 mL) in the entire LMC in both winter and post-monsoon ().
Figure 18. Spatial distribution of total coliform in the groundwater of LMC.
4.7. Drinking water quality
The drinking water quality zoning map was obtained through integration of weighted parameters and their classification. For drinking purposes, the groundwater was found of ‘moderate’ quality almost in the entire LMC and ‘good’ only in three pockets in the east, west, and south during winter. During the post-monsoon period, groundwater quality for drinking was ‘good’ for western, central, and southern parts of LMC, and was of ‘moderate’ quality in the rest of the LMC ().
Figure 19. Groundwater quality for drinking in the municipality wards of LMC with population density.
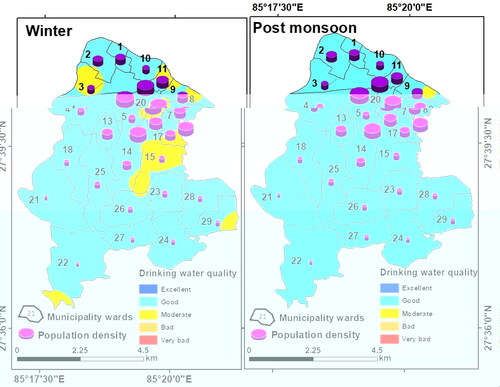
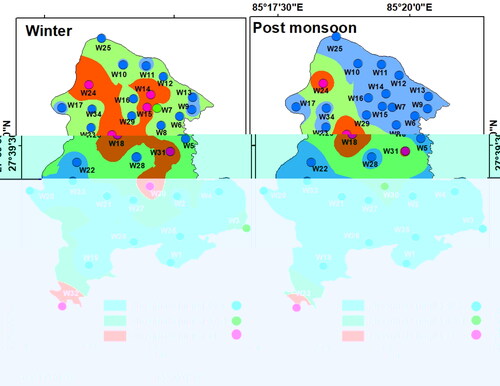
However, the actual scenario of groundwater quality was totally different which must be explained. Groundwater quality for drinking was obtained by classification of the weightage values produced through the integration of the 15 chemical parameters. Since the total weightage values lie between 23 and 32 in winter and between 20 and 27 during post-monsoon, groundwater quality was classified as ‘good’ or ‘moderate’ based on arbitrary classification of the total weights obtained (). This however does not portray the true status of groundwater quality. Therefore, groundwater contamination maps () were generated based on Cd values of the winter and post-monsoon samples (). These maps have revealed significant variations in spatial and seasonal groundwater quality in LMC in terms of contamination level. The degree of contamination in groundwater was ‘high’ in northern, eastern, and central parts of LMC in winter, while in the post-monsoon, ‘high’ contamination level was restricted only in some small northern, eastern, and central pockets of LMC. It is noticeable that in major parts of LMC, groundwater contamination was either ‘high’ or ‘moderate’ in winter but was ‘low’ to ‘moderate’ during the post-monsoon once again confirming the dilution effect on pollutants due to rainfall-induced recharge of the aquifers ().
Figure 20. Spatial and seasonal variations of contamination level in the groundwater at the sampling sites (wells).
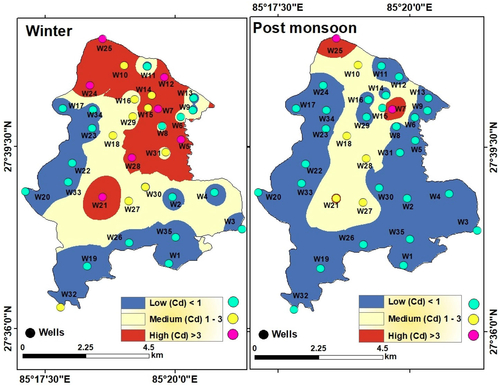
Table 7. Contamination level (C-level) of groundwater in the municipality wards of Lalitpur Metropolitan City during winter and post-monsoon as determined by the contamination index (Cd).
Since contaminated groundwater with poor quality has a direct bearing on community health (Rahman et al. Citation2018; Shukla et al. Citation2021), municipality ward-wise population count and population density in the LMC were correlated and compared. As per 2011 population census (CBS Citation2011), the LMC had total of 70,256 households and the total population of the LMC was 284,922 with 145,924 males and 138,998 females. Out of the total 29 wards, ward number 14 had the largest population of 21,232, while ward number 29 had the least number of populations with 21,232. Ward number 14 had the most (5,438) households, while ward number 27 had the least number (1,020) of households (). With the general increasing trend of population growth in this region, it may be assumed that both the total population and the population density increased further by now. Since the 2021 population census data of Nepal is not yet published, population in the LMC was projected using the year-wise growth rate of Nepal as obtained from the World Bank (World Bank Citation2022). Municipality ward-wise projected population density and total population values are shown in . The population density values were projected over the groundwater contamination level map to get an estimate of the vulnerable population in the LMC due to water-borne diseases (). It is evident that contamination risk was comparatively less during the post-monsoon, but in winter, ward number 1, 2, 3, 8, 11, 14, 17, 20 and 25 had a high risk of contamination through groundwater since many of the constituents (chemical and bacterial) had a concentration above the maximum permissible limit.
Figure 21. A: Groundwater contamination level and population density in the municipality wards of LMC. B. Ward wise total population in the LMC.
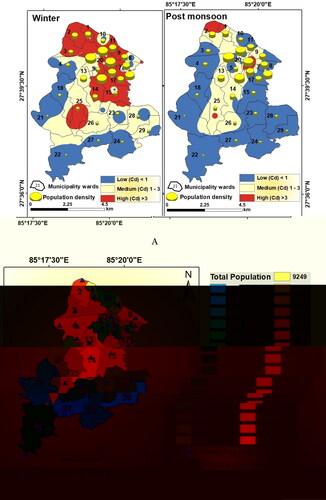
Table 8. Municipality ward-wise projected population of Lalitpur Metropolitan City in the year 2021 (based on population growth rate in Nepal by the World Bank).
However, the main concern regarding groundwater quality in the LMC is not due to anomalous concentration of the chemical components but due to the presence of coliform bacteria in a high concentration. Instead of equal importance to all the parameters, if the highest importance was given to total coliform, then groundwater quality of the entire LMC would be ‘very bad’. The presence of E-coli alone makes the groundwater resources of the LMC unfit for drinking. Comparing and correlating ward-wise total population and groundwater quality ( and , and ), it may be inferred that with a higher population count, municipality wards 14, 2, 4, 13, 3, and 9 (red and orange in ) have a higher health risk due to coliform. In fact, the entire population of Lalitpur is vulnerable to water-borne diseases due to the presence of TC!
4.8. Irrigation water quality
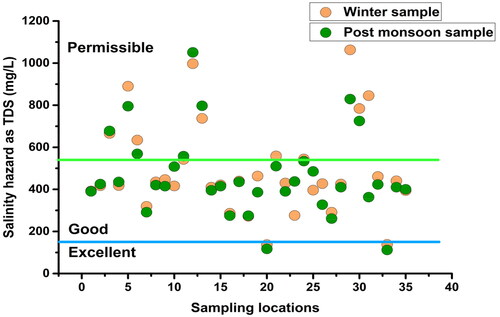
Irrigation water quality was determined using various thresholds for TDS, Cl, SAR, Na%, PI, and MAR (). Based on the TDS, majority of the winter samples (68.57%), as well as of the post-monsoon samples (62.86%) were found ‘good’ for irrigation, and 25.71% and 31.42% of samples were ‘permissible’ during winter and the post-monsoon, respectively. Only two winter and post-monsoon samples with very low TDS were found ‘excellent’ for irrigation (). However as per the criteria, all the groundwater samples were suitable for irrigation (FAO Citation2006).
Figure 22. Groundwater quality of samples for irrigation based on TDS concentration.
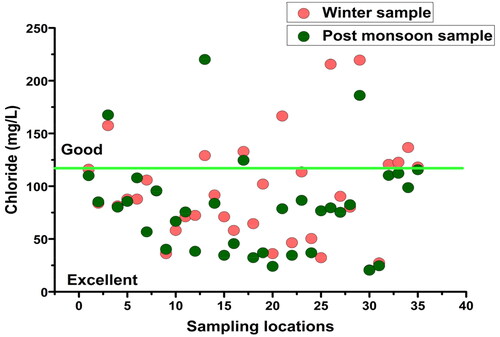
Again, according to Ayers and Westcot (Citation1985), up to 135 mg/L chloride concentration is good for irrigation. indicates 80% of the winter samples and 91.42% of the post-monsoon samples had Clˉ below 135 mg/L.
Figure 23. Groundwater quality for irrigation based on chloride concentration.
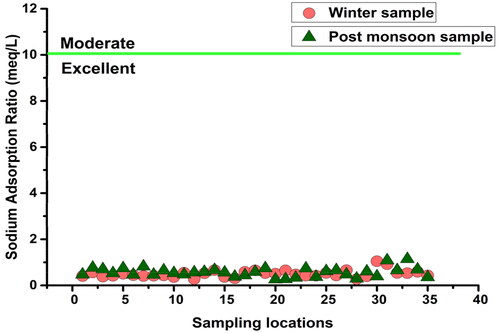
SAR was computed for determining the alkali/sodium hazards to crops, as it expresses the degree of cation exchange reactions in soil when sodium replaces the absorbed magnesium and calcium (Wilcox Citation1955). Based on grading by Richards (Subramani et al. Citation2005), SAR values less than 18 have low sodium hazard and are suitable for irrigation. Analysis indicated that all the groundwater samples collected in this study were ‘excellent’ for irrigation ().
Figure 24. Sodium Adsorption Ratio (SAR) in winter and post-monsoon samples.
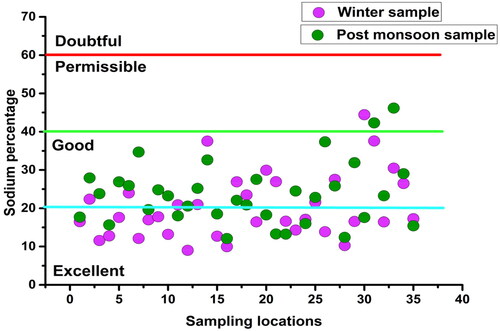
Besides SAR, sodium concentration also plays an important role in groundwater quality for irrigation (Haritash et al. Citation2008). When Na+ concentration in irrigation water is high, sodium replaces hardness factor like Mg2+ and Ca2+ ions, thereby decreasing soil permeability and reducing air and water circulation (Tijani Citation1994; Logeshkumaran et al. Citation2015), causing adverse impacts on crop health (Bouderbala and Gharbi Citation2017). Analysis revealed that the sodium percentage in groundwater was ‘very good’ in most parts of the LMC ().
Figure 25. Spatial distribution map of Sodium percentage.
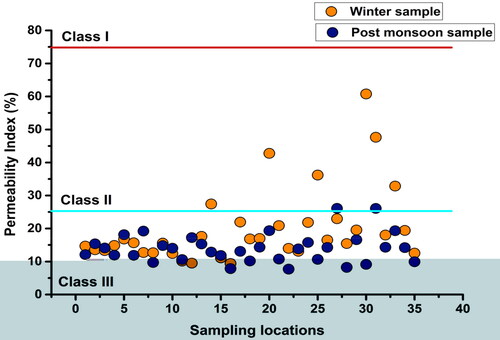
The permeability index (PI) proposed by Doneen (Citation1964) helps to build the relationship between major cations and bicarbonate and assess the suitability of groundwater for cropland irrigation (Panneerselvam et al. Citation2021). The PI was used to classify soil affected by Na+, Mg2+, Ca2+, and HCO3ˉ into three classes (). Water with >75% PI (Class I) is considered good for irrigation, 25–75% PI (Class II) as suitable, and <25% PI (Class III) as unsafe since a low PI has an adverse impact on the development of vegetation (Rawat et al. Citation2018). In this case, six winter samples and two post-monsoon samples fell in Class II, while 29 winter samples and 33 post-monsoon samples were in Class III, pointing to their non-suitability for irrigation ().
Figure 26. Spatial distribution map of Permeability Index.
Magnesium Adsorption Ration (MAR) was also used in this study to assess irrigation water quality. MAR values for the majority of the groundwater samples were found suitable for irrigation. Only two winter samples (W23 and W26) had unsuitable MAR (>50) while 94.28% of the samples were fit for irrigation. However, all the post-monsoon samples were suitable for irrigation with MAR values below 50 ().
Figure 27. Magnesium Adsorption Ratio (MAR) in winter and post-monsoon samples.

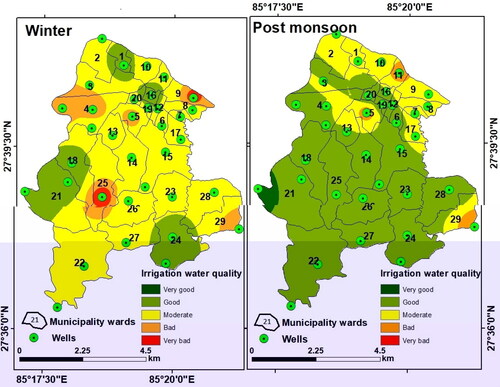
The final zoning map for irrigation thus prepared based on the aforesaid chemical parameters () shows that for irrigation purposes, groundwater quality in most parts of the LMC was moderate in winter but was good in the post-monsoon. According to the weightage value (), only two groundwater samples in winter, one each in the northern and central parts were bad for irrigation.
Figure 28. Groundwater quality for irrigation in the municipality wards of LMC.
4.9. Hydro-geochemical processes
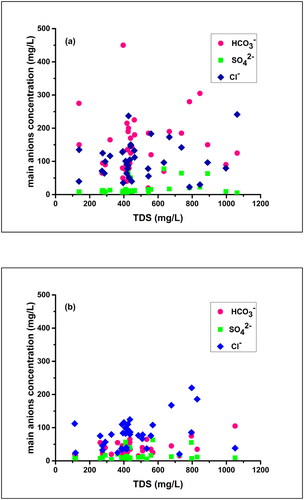
Hydro-geochemical processes and the geogenic and anthropogenic factors governing the groundwater chemistry in the Kathmandu Valley including the LMC could be identified in this study. The exchange of ions that occurs in the groundwater system is partially controlled by the local geological set-up influencing rock-water interactions (Wu et al. Citation2015; Li et al. Citation2018). This is reflected in the TDS, as with the variation in the ion concentration, the TDS values also changed ( and ). Among the major cations, Ca2+ and Na+ contribute more compared to Mg2+, while HCO3ˉ contributes most among the anions. Additionally, in bulk of the winter and post-monsoon samples Ca2+ and Na+ exhibited a counterpoise (), and in the winter samples, HCO3ˉ exhibited a falling trend in the TDS range of 1000 to 1200 mg/L (). The association between TDS and the majority of the ions demonstrated that the breakdown of minerals containing Ca2+ and Na+ and HCO3ˉ augment the majority of water-rock interactions, which may include calcite, dolomite, or albite. On the other hand, gypsum and halite dissolution may be the source of SO42- and Clˉ (Li et al. Citation2018). But in the case of Kathmandu valley, halite deposition is never reported thus Clˉ source might be from anthropogenic contamination (Nakamura et al. Citation2014).
Figure 29. Scatter plots showing variations of the principal cations versus TDS in winter (a), and during the post-monsoon (b).
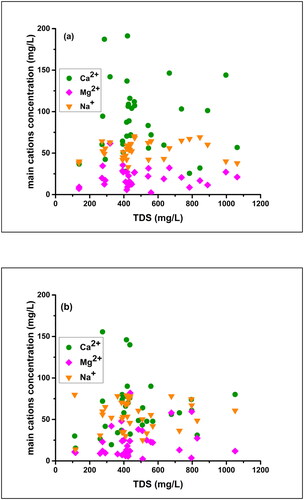
Figure 30. Scatter plots showing variations of the principal anions versus TDS in winter (a), and during the post-monsoon (b).
The silicate weathering is the dominant geochemical process governing the major ionic chemistry in groundwater (Mackenzie and Garrels Citation1965; Li et al. Citation2018; Zhu et al. Citation2019). Halite and silicate rocks are the main sources of sodium in the groundwater. Generally, sodium to chloride ratio in groundwater is approximately 1 if the halite dissolution process releases the sodium ions, whereas if Na to Cl ratio is greater than 1, then silicate weathering is responsible for sodium ions in water (Meybeck Citation1987; Wu et al. Citation2014; Li et al. Citation2016; Wali et al. Citation2021). Alternatively, when sodium ions are released from silicate weathering, HCO3ˉ occurrence will be most ample other than sodium in the water (Lakshmanan et al. Citation2003) as is understood by EquationEquation (10)(10)
(10) .
(10)
(10)
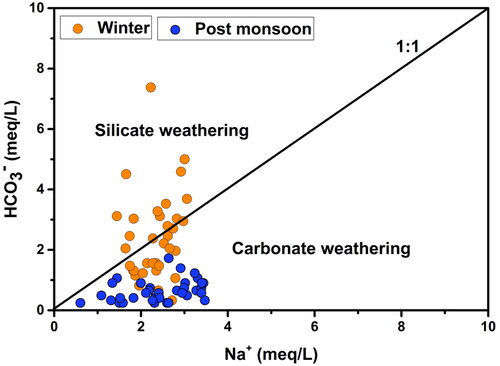
In this study, the Na/Cl ratio varied from 0.24 to 4.56 in the winter and between 0.40 and 4.89, in the post-monsoon samples with the mean values 1.09 and 1.43, respectively. The Na/Cl ratio in 88.6% of the groundwater samples was greater than or equal to 1 (). Again, the values of HCO3ˉ were higher than the values of Na+ in the groundwater samples as shown in . These two facts together suggest that the source of sodium in the majority of the winter samples was silicate weathering while that of the post-monsoon samples was carbonate weathering. According to the previous studies, if the silicate weathering was the source of the sodium then HCO3ˉ will be the abundant anion in the water sample (Rogers Citation1989; Rajmohan and Elango Citation2004). In this study, HCO3ˉ is the dominant anion.
Figure 31. Scatter plot showing seasonal variation of Na+ versus Clˉ in the groundwater.
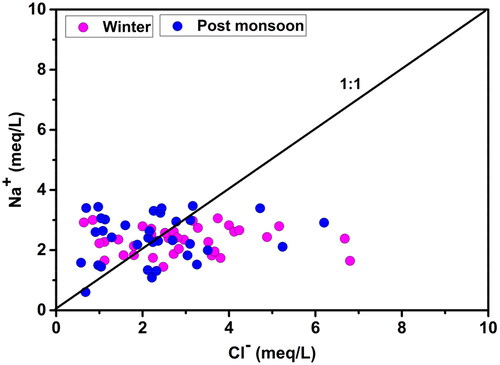
Figure 32. Scatter plot for seasonal variation of HCO3ˉ versus Na+ in the groundwater.
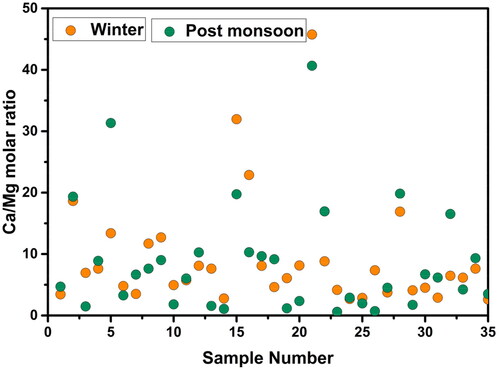
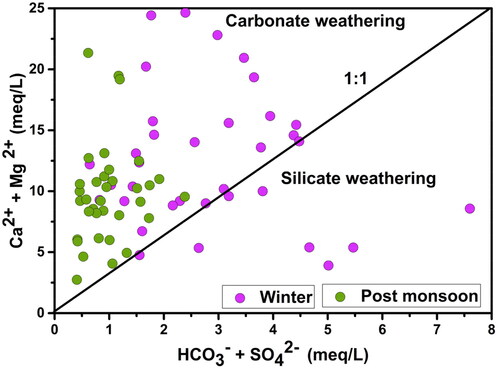
Gypsum, dolomite, limestone, and anhydrite leaching are the main sources of calcium and magnesium ions in groundwater, and the cation exchange process is another important source of calcium ions (Han and Liu Citation2004; Wu et al. Citation2015; Wali et al. Citation2021). The origin of the calcium and magnesium ions can also be determined by comparing the Ca/Mg molar ratio of (Ca2+ + Mg2+) to (HCO3ˉ + SO42ˉ). This means that dolomite should typically dissolve if the Ca/Mg molar ratio is closer to 1 (i.e. the ratio is 1) and that calcite contributes more when the ratio is higher (Hundal Citation2011) and more silicate minerals contribute when the Ca/Mg molar ratio is higher than 2. Generally, the scatter plot ratio of (Ca2+ + Mg2+) vs (HCO3ˉ + SO42-) should be close to the 1:1 line if the dissolution of gypsum, dolomite, and calcite are prominent in a system (Datta and Tyagi Citation1996; Fisher and Mullican Citation1997; Sonkamble et al. Citation2012). The scatter plots ratio tends to shift to the right when the ion exchange process is prominent in a system (Chang and Wang Citation2010; Jeevanandam et al. Citation2012). The scatter ratios will move to the left if reverse ion exchange is prevalent. The Ca/Mg ratios in this study varied from 2.61 to 45.75 for the winter samples and between 0.60 and 40.67 for the post-monsoon samples with an average value of 9.15 and 8.62, respectively (). This indicates that the dissolution of calcite, dolomite, and silicate minerals in the alluvium and the aquifers was the primary cause of the calcium and magnesium ions in the groundwater (Saleh et al. Citation1999; Li et al. Citation2018; Wali et al. Citation2021).
Figure 33. Scatter plot showing seasonal variation of Ca/Mg molar ratio.
In the present study, all the post-monsoon samples and 80% of the winter samples have higher (Ca2+ + Mg2+) than the (HCO3ˉ + SO42-), inferring that carbonate weathering is the dominant hydro-geochemical process in the groundwater () as explained by Equationequation 11(11)
(11) . Fewer samples fall near and below the isoline to indicate that the main mechanisms causing calcium and sodium ions in groundwater samples were silicate weathering and ion exchange.
(11)
(11)
Figure 34. Scatter plot of (Ca2+ + Mg2+) versus (HCO3ˉ + SO42ˉ) depicting seasonal variation in silicate weathering and carbonate weathering.
5. Discussion and conclusion
The hydrochemical studies help in determining the suitability of groundwater for domestic and agricultural purposes (Ganiyu et al. Citation2018). Moreover, it reveals the change in water quality due to rock-water interaction and human influence, if any (Wilcox Citation1948). GIS further helps in visual interpretation of spatial variations of various chemical constituents in the groundwater. In this study, the spatial distribution of the chemical parameters and coliform bacteria in the groundwater of Nepal’s Lalitpur Metropolitan City was mapped using GIS. Lower concentration of most of the chemical constituents in the groundwater during the post-monsoon compared to that in winter was the effect of monsoon-driven recharge of the aquifers and dilution of the chemicals during the monsoon season (Lasagna et al. Citation2013). Comparison of their concentration with the WHO and NDWQS standards and guidelines revealed that most of the groundwater samples are unsuitable for drinking but can be used for domestic and irrigation purposes. Anomalous high concentrations were noticed for several parameters at several sample locations either in winter or in the post-monsoon or in both seasons. The mean value of certain parameters such as pH during winter and calcium and iron in both seasons were much higher than the permissible limits. Besides pH, calcium, and iron, the maximum values for some other parameters such as TDS, EC, TH, magnesium, bicarbonates, and phosphate were even much higher than the permissible limits. Such high concentration of these parameters is most likely due to agrochemicals (fertilisers and pesticides), leakage of solid wastes, and percolation of domestic and industrial effluents (Wei et al. Citation2017; Li et al. Citation2018; Shakya et al. Citation2019). Furthermore, the nitrate concentration found higher in the post-monsoon most likely due to irrigation return flow in the subsurface and septic tank leakage (Gao et al. Citation2012). Besides the anthropogenic activities, the groundwater chemistry was affected by the geological environment. The cation and anion concentrations changed with the TDS variation (Wu et al. Citation2015; Li et al. Citation2018). The weathering of silicate and carbonate rocks has significant influence on groundwater chemistry (Zhu et al. Citation2019). The high concentration of TDS, EC, HCO3ˉ, Clˉ, and SO42- in the groundwater reflects the rock-water interaction factor in groundwater quality (Chen et al. Citation2019). Thus, geogenic contamination and rock-water interaction both have significant influence on the groundwater quality. Anomalous high concentration of these parameters in groundwater is definitely a matter of concern considering their potential adverse impacts on the health of plants, animals, and humans (Shakya et al. Citation2019).
However, the biggest concern for human health in the LMC is definitely due to high concentration of faecal coliform bacteria in all the groundwater samples in both seasons. Previous studies (Warner et al. Citation2008; Haramoto et al. Citation2011; Pant Citation2011; Shrestha et al. Citation2014; Inoue et al. Citation2015; Bhandari et al. Citation2021; Sarkar et al. Citation2022) also reported the occurrence of total coliform, faecal coliform, and other pathogenic bacteria and viruses in the groundwater of the Kathmandu Valley. The presence of faecal coliform bacteria in an aquatic environment is an indication of contamination of the water with faecal materials of animals and humans. In such cases, the chance of contamination by pathogens i.e. disease-producing viruses and bacteria is high (Shrestha et al. Citation2015). Therefore, the occurrence of faecal coliform in water enhances the risk of water-borne pathogenic diseases such as diarrhoea, cholera, typhoid, bacterial gastroenteritis, and hepatitis-A through contact or consumption of the contaminated water (Kumar and Puri Citation2012). Moreover, the increasing presence of antibiotic-resistant bacterial pathogens in groundwater is a matter of emerging global concern (Gallert et al. Citation2005; Bradford and Harvey Citation2017).
Open defecation and leaky sanitation systems are the main reasons that put the entire population of the LMC at health risk. As part of its Sustainable Development Goals 6, the United Nations have set targets such as: (1) achieving universal and equitable access to safe and affordable drinking water for all by the year 2030, and (2) achieving access to adequate and equitable sanitation and hygiene for all and end open defecation by the year 2030 (UNDP Citation2018). Although the Nepal Government declared all districts to be open defecation-free zones, in reality, open defecation is rampant even in the major urban centers such as Kathmandu, Bhaktapur, and Lalitpur (Ojha Citation2019). With very few public toilets and only one faecal sludge treatment plant, management of faecal sludge is a big challenge in the LMC. Due to inadequate sewage treatment facility, most of the sewerage ends up in rivers without any treatment (Aawaaj News Citation2021; Bhandari et al. Citation2021), and subsequently infiltrates the subsurface. Thus, both soil and water in the LMC are highly polluted with faecal bacteria leading to a high risk of water-borne community diseases.
The contamination risk of the pathogens is high as groundwater is the main source of drinking water. Numerous cases of waterborne outbreaks were reported from across the globe due to widespread pathogenic contamination of groundwater (Gallay et al. Citation2006; Fong et al. Citation2007; Craun et al. Citation2010; Cho et al. Citation2014; Guzman-Herrador et al. Citation2015). Similar pathogenic cases were reported in the past also in the Kathmandu Valley (Pandey et al. Citation2002). If attention is not given and the groundwater is not properly treated before the municipality supply, water-borne diseases such as diarrhoea, dysentery, cholera, and hepatitis may spread across the Kathmandu Valley and may even lead to an epidemic.
Therefore, this study suggests that the legislators and regulators take appropriate steps and actions to provide clean water to the population of LMC. Great importance is attached to the purification of the groundwater. According to the WHO, unsafe water and unhygienic sanitation are the main causes of more than 80% of all diseases in developing countries. The same are the reasons behind the high rates of morbidity and mortality of children and infants in Nepal. Since faecal coliform bacteria imparts greater health risk and threat from waterborne diseases, to prevent an epidemic, immediate attention must be given to the blanket banning of open defecation and to the imposition of strict penalty for violation of the rules. At the same time, the Government of Nepal must ensure the availability of clean potable water, sufficient public toilets with the proper hygienic facility, and an adequate number of faecal sludge treatment plants.
Authors’ contributions
Conceptualization: MG; Field work and chemical analysis: MG and TR; Methodology, Data analysis and mapping: MG; Supervision: SPK; Writing original draft: MG; Rewriting: MG, TR, SPK and CB; Review, editing and final shape: CB.
Acknowledgements
The authors are thankful to the five anonymous reviewers for their valuable suggestions for the betterment of this article.
Data availability statement
All the datasets used to support the findings of this study are available from the corresponding author upon request.
Disclosure statement
It is hereby declared that there is no conflict of interest that could have influenced the result and that there is no conflict in the order in which the authors’ names appear.
Additional information
Funding
References
- Aawaaj News. 2021. Fecal sludge management a challenge in Lalitpur Metropolis. Aawaaj News. Available at: https://aawaajnews.com/social-news/fecal-sludge-management-a-challenge-in-lalitpur-metropolis/. [accessed on 17th October 2022].
- Acharya M, Paudyal KR. 2019. Geological setting of the Chandragiri-Chitlang Range, southwest of Kathmandu Valley, central Nepal. J Nepal Geol Soci. 58:199–207.
- Adimalla N. 2020. Spatial distribution, exposure, and potential health risk assessment from nitrate in drinking water from semi-arid region of South India. Human Ecol Risk Asses Int J. 26(2):310–334.
- Al-Shammiri M, Al-Saffar A, Bohamad S, Ahmed M. 2005. Waste water quality and reuse in irrigation in Kuwait using microfiltration technology in treatment. Desalination. 185(1–3):213–225.
- Annapoorna H, Janardhana MR. 2015. Assessment of groundwater quality for drinking purpose in rural areas surrounding a defunct copper mine. Aqua Procedia. 4:685–692.
- APHA. 2005. In: Standard methods for the examination of water and wastewater. 21st ed. Washington DC: American Public Health Association; p. 1220.
- Arnade LJ. 1999. Seasonal correlation of well contamination and septic tank distance. Groundwater. 37(6):920–923.
- Ayers RS, Westcot DW. 1985. Water quality for agriculture. Rome: Food and Agriculture Organization of the United Nations; Vol. 29, p. 174..
- Backman B, Bodiš D, Lahermo P, Rapant S, Tarvainen T. 1998. Application of a groundwater contamination index in Finland and Slovakia. Env Geol. 36(1–2):55–64.
- Balderacchi M, Benoit P, Cambier P, Eklo OM, Gargini A, Gemitzi A, Gurel M, Kløve B, Nakic Z, Predaa E, et al. 2013. Groundwater pollution and quality monitoring approaches at the European level. Critical Reviews Environ Sci Technol. 43(4):323–408.
- Belitz K, Dubrovsky NM, Burow K, Jurgens B, Johnson T. 2003. Framework for a ground-water quality monitoring and assessment program for California. US Geol Surv Water-Reso Investigation Report 03-4166. 78.
- Bhallamudi SM, Kaviyarasan R, Abilarasu R, Philip L. 2019. Nexus between sanitation and groundwater quality: case study from a hard rock region in India. J Water Sanit Hygienic Dev. 9(4):703–713.
- Bhandari P, Banjara MR, Singh A, Kandel S, Rawal DS, Pant BR. 2021. Water quality status of groundwater and municipal water supply (tap water) from Bagmati river basin in Kathmandu valley. Nepal J Water Sanit Hygienic Dev. 11(1):102–111.
- Bhuiyan C, Champati Ray PK. 2017. Groundwater quality zoning in the perspective of health hazards. Water Res Manage. 31(1):251–267.
- Boateng TK, Opoku F, Osafo Acquaah S, Akoto O. 2015. Pollution evaluation, sources and risk assessment of heavy metals in hand-dug wells from Ejisu-Juaben Municipality, Ghana. Env Sys Res. 4(18):1–12.
- Bolland M, Avenell A, Baron JA, Grey A, MacLennan GS, Gamble GD, Reid IR. 2010. Effect of calcium supplements on risk of myocardial infarction and cardiovascular events: meta-analysis. BMJ. 341:c3691.
- Bouderbala A, Gharbi BY. 2017. Hydrogeochemical characterization and groundwater quality assessment in the intensive agricultural zone of the Upper Cheliff plain, Algeria. Environ Earth Sci. 76(21):1–17.
- Bradford SA, Harvey RW. 2017. Future research needs involving pathogens in groundwater. Hydro J. 2:931–938.
- Bridget M, Kuehn MSJ. 2013. High calcium intake linked to heart disease, death. J AmMed Assoc. 309(10):972.
- Burrough PA, McDonnell RA, Lloyd CD. 2015. Principles of geographical information systems. Oxford: Oxford University Press.
- Camargo JA, Alonso Á. 2006. Ecological and toxicological effects of inorganic nitrogen pollution in aquatic ecosystems: a global assessment. Environ Int. 32(6):831–849.
- Castiglioni S. 2021. Magnesium in human health and disease. Editorial Special Issue Nutri. 13(8):2490.
- CBS. 2011. National population and housing census 2011. National Report.
- Chang J, Wang G. 2010. Major ions chemistry of groundwater in the arid region of Zhangye Basin, northwestern China. Environ Earth Sci. 61(3):539–547.
- Chen J, Huang Q, Lin Y, Fang Y, Qian H, Liu R, Ma H. 2019. Hydrogeochemical characteristics and quality assessment of groundwater in an irrigated region, Northwest China. Water. 11(1):96.
- Chen FW, Liu CW. 2012. Estimation of the spatial rainfall distribution using inverse distance weighting (IDW) in the middle of Taiwan. Paddy Water Environ. 10(3):209–222.
- Chen J, Wu H, Qian H, Gao Y. 2017. Assessing nitrate and fluoride contaminants in drinking water and their health risk of rural residents living in a semiarid region of Northwest China. Expo Health. 9(3):183–195.
- Chaudhary B, Salike IP, Poudyal KN. 2021. Urban Heat Island: A case study of Kathmandu Valley. In: Proceedings of 10th IOE Graduate Conference, 10, 68–79.
- Cho HG, Lee SG, Kim WH, Lee JS, Park PH, Cheon DS, Jheong WH, Jho EH, Lee JB, Paik SY. 2014. Acute gastroenteritis outbreaks associated with ground-waterborne norovirus in South Korea during 2008–2012. Epidemiol Infect. 142(12):2604–2609.
- Christensen JN, Dafflon B, Shiel AE, Tokunaga TK, Wan J, Faybishenko B, … Hubbard SS. 2018. Using strontium isotopes to evaluate the spatial variation of groundwater recharge. Sci Total Environ. 637:672–685.
- Cook NR, Cutler JA, Obarzanek E, Buring JE, Rexrode KM, Kumanyika SM, Appel LJ, Whelton PK. 2007. Long-term effects of dietary sodium reduction on cardiovascular disease outcomes: observational follow-up of the trials of hypertension prevention. BMJ. 334(7599):885–888.
- Cook NR, Obarzanek E, Cutler JA, Buring JE, Rexrode KM, Kumanyika SK, Appel LJ, Whelton PK, Trials of Hypertension Prevention Collaborative Research Group. 2009. Joint effects of sodium and potassium intake on subsequent cardiovascular disease. The Trials of Hypertension Prevention follow-up study. Arch Intern Med. 169(1):32–40.
- CPCB. 2008. Guideline for water quality management. Central Pollution Control Board. India: Parivesh Bhawan.
- Craun GF, Brunkard JM, Yoder JS, Roberts VA, Carpenter J, Wade T, Calderon RL, Roberts JM, Beach MJ, Roy SL. 2010. Causes of outbreaks associated with drinking water in the United States from 1971 to 2006. Clin Microbiol Rev. 23(3):507–528.
- Das S, Nag SK. 2017. Application of multivariate statistical analysis concepts for assessment of hydrogeochemistry of groundwater—a study in Suri I and II blocks of Birbhum District, West Bengal, India. Appl Water Sci. 7(2):873–888.
- Dasgupta S, Agarwal N, Mukherjee A. 2021. Moving up the On-Site Sanitation ladder in urban India through better systems and standards. J Environ Manage. 280:111656.
- Datta PS, Tyagi SK. 1996. Major ion chemistry of groundwater in Delhi area: chemical weathering processes and groundwater flow regime. Geol Soci India. 47(2):179–188.
- Debels P, Figueroa R, Urrutia R, Barra R, Niell X. 2005. Evaluation of water quality in the Chillán River (Central Chile) using physicochemical parameters and a modified water quality index. Environ Monit Assess. 110(1-3):301–322.
- Demirel Z. 2007. Monitoring of heavy metal pollution of groundwater in a phreatic aquifer in Mersin-Turkey. Environ Monit Assess. 132(1-3):15–23.
- Department of Mines and Geology (DMG). 1998. Engineering and Environmental Geological Map of the Kathmandu Valley. Germany: DMG in cooperation of BGR.
- Domagalski JL, Johnson HM. 2011. Comparative study of phosphorus transport in the unsaturated zone. Groundwater, streams, and tile drains at five agricultural watersheds. USA: J Hydro. Vol. 409; p. 157–171.
- Doneen LD. 1964. Notes on water quality in agriculture. Department of Water Science and Engineering. Davis: University of California,.
- Dongol BS, Merz J, Schaffner M, Nakarmi G, Shah PB, Shrestha SK, Dangol PM, Dhakal MP. 2005. Shallow groundwater in a middle mountain catchment of Nepal: quantity and quality issues. Environ Geol. 49(2):219–229.
- Doyle ME, Glass KA. 2010. Sodium reduction and its effect on food safety, food quality, and human health. Comp Rev Food Sci Food Safe. 9(1):44–56.
- Dzwairo B, Hoko Z, Love D, Guzha E. 2006. Assessment of the impacts of pit latrines on groundwater quality in rural areas: a case study from Marondera district, Zimbabwe. Phy Chem Earth Parts A/B/C. 31(15-16):779–788.
- Enyoh CE, Verla AW, Egejuru NJ. 2018. PH variations and chemometric assessment of borehole water in Orji, Owerri Imo State. Nigeria J Environ Anal Chem. 5:1–9.
- European Commission. 2007a. Groundwater monitoring, common implementation strategy of the WFD, Guidance N115. Brussels: European Commission.
- European Commission. 2007b. Groundwater in drinking water protected areas, common implementation strategy of the WFD, Guidance N116. Brussels: European Commission.
- FAO, World Health Organization. 2006. A model for establishing upper levels of intake for nutrients and related substances: report of a Joint FAO.
- FAO. 2006. Prospects for food, nutrition, agriculture and major commodity groups. In: World agriculture: towards. p. 2030–2050.
- Fiorentini D, Cappadone C, Farruggia G, Prata C. 2021. Magnesium: biochemistry, Nutrition, detection, and social impact of diseases linked to its deficiency. Nutrients. 13(4):1136.
- Fipps G. 2003. Irrigation water quality standards and salinity management strategies. Texas FARMER Collection.
- Fisher RS, Mullican WF. III 1997. Hydrochemical evolution of sodium-sulphate and sodium-chloride groundwater beneath the northern Chihuahua Desert, Trans-Pecos, Texas, USA. Hydrogeol J. 5(2):4–16.
- Fong TT, Mansfield LS, Wilson DL, Schwab DJ, Molloy SL, Rose JB. 2007. Massive microbiological groundwater contamination associated with a waterborne outbreak in Lake Erie, South Bass Island, Ohio. Environ Health Pers. 115(6):856–864.
- Gallay A, De Valk H, Cournot M, Ladeuil B, Hemery C, Castor C, Bon F, Megraud F, Le Cann P, Desenclos JC. 2006. A large multi‐pathogen waterborne community outbreak linked to faecal contamination of a groundwater system, France, 2000. Clinic Microb Infect. 12(6):561–570.
- Gallert C, Fund K, Winter J. 2005. Antibiotic resistance of bacteria in raw and biologically treated sewage and in groundwater below leaking sewers. Appl Microbiol Biotechnol. 69(1):106–112.
- Ganiyu SA, Badmus BS, Olurin OT, Ojekunle ZO. 2018. Evaluation of seasonal variation of water quality using multivariate statistical analysis and irrigation parameter indices in Ajakanga area, Ibadan, Nigeria. Appl Water Sci. 8(1):1–15.
- Gao Y, Yu G, Luo C, Zhou P. 2012. Groundwater nitrogen pollution and assessment of its health risks: a case study of a typical village in rural-urban continuum, China. PLoS One. 7(4):e33982.
- Gautam SK, Sharma D, Tripathi JK, Ahirwar S, Singh SK. 2013. A study of the effectiveness of sewage treatment plants in Delhi region. Appl Water Sci. 3(1):57–65.
- Ghosh GC, Khan MJH, Chakraborty TK, Zaman S, Kabir AHME, Tanaka H. 2020. Human health risk assessment of elevated and variable iron and manganese intake with arsenic-safe groundwater in Jashore, Bangladesh. Sci Rep. 10(1):5206.
- Graham JP, Polizzotto ML. 2013. Pit latrines and their impacts on groundwater quality: a systematic review. Environ Health Perspect. 121(5):521–530.
- Grath J, Ward R, Scheidleder A, Quevauviller P. 2007. Report on EU guidance on groundwater monitoring developed under the common implementation strategy of the water framework directive. J Environ Monit. 9(11):1162–1175.
- Guigues N, Desenfant M, Lalere B, Vaslin-Reimann S, Eyl D, Mansuit P, Hance E. 2016. Estimating sampling and analysis uncertainties to assess the fitness for purpose of a water quality monitoring network. Accred Qual Assur. 21(2):101–112.
- Gullestad L, Dolva LO, Waage A, Falch D, Fagerthun H, Kjekshus J. 1992. Magnesium deficiency diagnosed by an intravenous loading test. Scan J Clin Lab Invest. 52(4):245–253.
- Gupta SK, Gupta RC, Gupta AB, Seth AK, Bassin JK, Gupta A. 2000. Recurrent acute respiratory tract infections in areas with high nitrate concentrations in drinking water. Environ Health Perspect. 108(4):363–366.
- Gurung JK, Ishiga H, Khadka MS, Shrestha NR. 2007. The geochemical study of fluvio-lacustrine aquifers in the Kathmandu Basin (Nepal) and the implications for the mobilization of arsenic. Environ Geol. 52(3):503–517.
- Gurzau ES, Neagu C, Gurzau AE. 2003. Essential metals—case study on iron. Ecotox Env Safety. 56(1):190–200.
- Guzman-Herrador B, Carlander A, Ethelberg S, Freiesleben de Blasio B, Kuusi M, Lund V, Löfdahl M, MacDonald E, Nichols G, Schönning C, et al. 2015. Waterborne outbreaks in the Nordic countries, 1998 to 2012. Eurosurveillance: euro Com Dis Bull. 20(24):24.
- Hagedorn B, Cartwright I. 2009. Climatic and lithologic controls on the temporal and spatial variability of CO2 consumption via chemical weathering: an example from the Australian Victorian Alps. Chem Geol. 260(3-4):234–253.
- Han G, Liu CQ. 2004. Water geochemistry controlled by carbonate dissolution: a study of the river waters draining karst-dominated terrain, Guizhou Province, China. Chem Geol. 204(1–2):1–21.
- Haramoto E, Yamada K, Nishida K. 2011. Prevalence of protozoa, viruses, coliphages and indicator bacteria in groundwater and river water in the Kathmandu Valley, Nepal. Trans R Soc Trop Med Hyg. 105(12):711–716.
- Haritash AK, Kaushik CP, Kaushik A, Kansal A, Yadav AK. 2008. Suitability assessment of groundwater for drinking, irrigation and industrial use in some North Indian villages. Environ Monit Assess. 145(1-3):397–406.
- He FJ, MacGregor GA. 2007. Dietary salt, high blood pressure and other harmful effects on health. In Kilcast D, Angus F, editors. Reducing salt in foods. Boca Raton, FL: CRC Press; p. 18–54.
- Hem JD. 1985. Study and interpretation of the chemical characteristics of natural water (Vol. 2254). Department of the Interior, US Geological Survey.
- Hundal HS. 2011. Geochemistry and assessment of hydrogeochemical processes in groundwater in the southern part of Bathinda district of Punjab, northwest India. Environmental Earth Sci. 64(7):1823–1833.
- Hurley SW, Johnson AK. 2015. The biopsychology of salt hunger and sodium deficiency. Pflugers Arch. 467(3):445–456.
- Hussein MT. 2004. Hydrochemical evaluation of groundwater in the Blue Nile Basin, eastern Sudan, using conventional and multivariate techniques. Hydrogeol J. 12(2):144–158.
- Inoue D, Hinoura T, Suzuki N, Pang J, Malla R, Shrestha S, Chapagain SK, Matsuzawa H, Nakamura T, Tanaka Y, et al. 2015. High-throughput DNA microarray detection of pathogenic bacteria in shallow well groundwater in the Kathmandu Valley, Nepal. Curr Microbiol. 70(1):43–50.
- Ishtiaque A, Shrestha M, Chhetri N. 2017. Rapid urban growth in the Kathmandu valley, Nepal: monitoring land use land cover dynamics of a Himalayan city with Landsat imageries. Environmentals. 4(4):72.
- Islam MJ, Hakim MA, Hanafi MM, Juraimi AS, Chowdhury I, Hossain AKMM, … Halim MA. 2014. Geochemical assessment of groundwater composition and evaluating its suitability of Saidpur Upazilla in Bangladesh. Life Sci J. 11(7).
- ISO I. 2005. General requirements for the competence of testing and calibration laboratories. ISO Norm. 17025:2005.
- Jain CK, Bandyopadhyay A, Bhadra A. 2010. Assessment of ground water quality for drinking purpose, District Nainital, Uttarakhand, India. Environ Monit Assess. 166(1-4):663–676.
- Jeevanandam M, Nagarajan R, Manikandan M, Senthilkumar M, Srinivasalu S, Prasanna MV. 2012. Hydrogeochemistry and microbial contamination of groundwater from lower Ponnaiyar basin, Cuddalore district, Tamil Nadu, India. Environ Earth Sci. 67(3):867–887.
- Kapembo ML, Al Salah DMM, Thevenon F, Laffite A, Bokolo MK, Mulaji CK, Mpiana PT, Poté J. 2019. Prevalence of water-related diseases and groundwater (drinking-water) contamination in the suburban municipality of Mont Ngafula, Kinshasa (Democratic Republic of the Congo). J Environ Sci Health A Tox Hazard Subst Environ Eng. 54(9):840–850.
- Karim A, Veizer J. 2000. Weathering processes in the Indus River Basin: implications from riverine carbon, sulfur, oxygen, and strontium isotopes. Chem Geol. 170(1-4):153–177.
- Karppanen H, Mervaala E. 2006. Sodium Intake and Hypertension. Prog Cardiovasc Dis. 49(2):59–75.
- Karunanidhi D, Aravinthaswamy P, Subramani T, Jianhu, W, Srinivasamoorthy. 2019. Potential health risk assessment for fluoride and nitrate contamination in hard rock aquifers of Shanmuganadhi River basin, South India. Hum Health Risk Assess. 25(1-2)
- Kharel BD, Shrestha NR, Khadka MS, Singh VK, Piya B, Bhandari R. 1998. Hydrological conditions and potential barrier sediments in the Kathmandu valley, Final Report (Feb 1998). Env Geol Project.
- Khurshid S, Basheer A. 1998. Pollution assessment and water quality status in parts of Cochin. Ind J Env Prot. 18(4):246–249.
- Komaba H, Fukagawa M. 2016. Phosphate—a poison for humans? Kidney Int. 90(4):753–763.
- Kovesdy CP. 2012. Significance of hypo- and hypernatremia in chronic kidney disease. Nephrol Dial Transplant. 27(3):891–898.
- Kozisek F. 2020. Regulations for calcium, magnesium or hardness in drinking water in the European Union member states. Regul Toxicol Pharmacol. 112:104589.
- KUKL. 2021. Kathmandu Upatyaka Kanepani Limited Annual Report.
- Kumar M, Puri A. 2012. A review of permissible limits of drinking water. Indian J Occup Environ Med. 16(1):40–44.
- Lakshmanan E, Kannan R, Kumar MS. 2003. Major ion chemistry and identification of hydrogeochemical processes of ground water in a part of Kancheepuram district, Tamil Nadu, India. Environ Geosci. 10(4):157–166.
- Lasagna M, De Luca DA, Debernardi L, Clemente P. 2013. Effect of the dilution process on the attenuation of contaminants in aquifers. Environ Earth Sci. 70(6):2767–2784.
- Li P, Wu J, Qian H. 2016. Hydrochemical appraisal of groundwater quality for drinking and irrigation purposes and the major influencing factors: a case study in and around Hua County, China. Arab. J. Geosciences. 9(1):1–17.
- Li X, Wu H, Qian H, Gao Y. 2018. Groundwater chemistry regulated by hydrochemical processes and geological structures: a case study in Tongchuan, China. Water. 10(3):338.
- Li P, Wu J, Qian H, Zhang Y, Yang N, Jing L, Yu P. 2016. Hydrogeochemical characterization of groundwater in and around a wastewater irrigated forest in the southeastern edge of the Tengger Desert, Northwest China. Expo Health. 8(3):331–348.
- Logeshkumaran A, Magesh NS, Godson PS, Chandrasekar N. 2015. Hydro-geochemistry and application of water quality index (WQI) for groundwater quality assessment, Anna Nagar, part of Chennai City, Tamil Nadu, India. Appl Water Sc. 5(4):335–343.
- Lu Y, Tang C, Chen J, Sakura Y. 2008. Impact of septic tank systems on local groundwater quality and water supply in the Pearl River Delta, China: case study. Hydrol Process. 22(3):443–450.
- Mackenzie FT, Garrels RM. 1965. Silicates: reactivity with sea water. Science. 150(3692):57–58.
- Maharjan M, Aryal A, Man Shakya B, Talchabhadel R, Thapa BR, Kumar S. 2021. Evaluation of Urban Heat Island (UHI) Using Satellite Images in Densely Populated Cities of South Asia. Earth. 2(1):86–110.
- Meybeck M. 1987. Global chemical weathering of surficial rocks estimated from river dissolved loads. Am J Sci. 287(5):401–428.
- Michaëlsson M, Melhus H, Lemming EW, Wolk A, Byberg L. 2013. Long term calcium intake and rates of all cause and cardiovascular mortality: community based prospective longitudinal cohort study. BMJ. 346:f228.
- MOPPW. 2003. Optimizing water use in Kathmandu valley report. HMG/Nepal: Ministry of Physical Planning and Works.
- Morales-Suarez-Varela MM, Llopis-Gonzalez A, Tejerizo-Perez ML. 1995. Impact of nitrates in drinking water on cancer mortality in Valencia, Spain. Eur J Epidemiol. 11(1):15–21.
- Nagarajan R, Rajmohan N, Mahendran U, Senthamilkumar S. 2010. Evaluation of groundwater quality and its suitability for drinking and agricultural use in Thanjavur city, Tamil Nadu, India. Environ Monit Assess. 171(1-4):289–308.
- Nakamura T, Nishida K, Kazama F, Osaka KI, Chapagain SK. 2014. Nitrogen contamination of shallow groundwater in Katmandu Valley. Nepal. 日本水文科学会誌. 44(4):197–206.
- Napoli C, Ignarro LJ. 2009. Nitric oxide and pathogenic mechanisms involved in the development of vascular diseases. Arch Pharm Res. 32(8):1103–1108.
- National Research Council. 1989. Recommended dietary allowances. National Academy of Sciences. Washington, DC: National Academy Press..
- NDWQS. 2005. National drinking water quality standards, 2062 and national drinking water quality standard implementation Guideline, 2062. Ministry of Land Reform Management, Government of Nepal.
- Négrel P, Lemiere B, D, Grammont HM, Billaud P, Sengupta B. 2007. Hydrogeochemical processes, mixing and isotope tracing in hard rock aquifers and surface waters from the Subarnarekha River Basin, (East Singhbhum District, Jharkhand State, India). Hydrogeol J. 15(8):1535–1552.
- Ojha A. 2019. Kathmandu has been declared open defecation free, but people are still pooping on the streets. The Kathmandu Post. Available at: https://kathmandupost.com/kathmandu/2019/09/18/kathmandu-has-been-declared-open-defecation-free-but-people-are-still-pooping-on-the-streets. [accessed on 25th October 2022].
- Pandey VP, Chapagain SK, Kazama F. 2010. Evaluation of groundwater environment of Kathmandu Valley. Environ Earth Sci. 60(6):1329–1342.
- Pandey BD, Thapa LB, Sherchand JB, Rimal N, Bhattara A, Morita K. 2002. Etiology of diarrhoea among adult patients during the early monsoon period in Kathmandu, Nepal. Jap J Trop Med Hyg. 30(2):133–137.
- Panneerselvam B, Karuppannan S, Muniraj K. 2021. Evaluation of drinking and irrigation suitability of groundwater with special emphasizing the health risk posed by nitrate contamination using nitrate pollution index (NPI) and human health risk assessment (HHRA). Human and Eco Risk Assess: an Int J. 27(5):1324–1348.
- Pant BR. 2011. Ground water quality in the Kathmandu valley of Nepal. Environ Monit Assess. 178(1-4):477–485.
- Pokhrel BK. 2018. Impact of land use change on flow and sediment yields in the Khokana Outlet of the Bagmati River, Kathmandu, Nepal. Hydrology. 5(2):22.
- Pradhanang SM, Shrestha SD, Steenhuis TS. 2012. Comprehensive review of groundwater research in the Kathmandu Valley, Nepal. Kathmandu, Nepal: Kathmandu valley groundwater outlook; p. 6–18.
- Prasanth SS, Magesh NS, Jitheshlal KV, Chandrasekar N, Gangadhar K. 2012. Evaluation of groundwater quality and its suitability for drinking and agricultural use in the coastal stretch of Alappuzha District, Kerala, India. Appl Water Sci. 2(3):165–175.
- Pujari PR, Nanoti M, Nitnaware VC, Khare LA, Thacker NP, Kelkar PS. 2007. Effect of on-site sanitation on groundwater contamination in basaltic environment: a case study from India. Environ Monit Assess. 134(1-3):271–278.
- Rahman MM, Islam MA, Bodrud-Doza M, Muhib MI, Zahid A, Shammi M, Tareq SM, Kurasaki M. 2018. Spatio-temporal assessment of groundwater quality and human health Risk: a case study in Gopalganj, Bangladesh. Expo Health. 10(3):167–188.
- Rajmohan N, Elango L. 2004. Identification and evolution of hydrogeochemical processes in the groundwater environment in an area of the Palar and Cheyyar River Basins, Southern India. Environ Geol. 46(1):47–61.
- Rajmohan N, Elango L. 2006. Hydrogeochemistry and its relation to groundwater level fluctuation in the Palar and Cheyyar river basins, southern India. Hydrol Process. 20(11):2415–2427.
- Rapant S, Vrana K, Bodiš D. 1995. Geochemical atlas of the Slovak Republic. Part 1, groundwater (in Slovak) Geofond, Bratislava
- Ravish S, Setia B, Deswal S. 2019. Hydro-chemical analysis of pre-monsoon groundwater of north-eastern Haryana. Groundwater Sust Develop. 8:630–643.
- Rawat KS, Singh SK, Gautam SK. 2018. Assessment of groundwater quality for irrigation use: a peninsular case study. Appl Water Sci. 8(8):1–24.
- Rehman F, Cheema T. 2016. Effects of sewage waste disposal on the groundwater quality and agricultural potential of a floodplain near Jeddah, Saudi Arabia. Arab J Geosci. 9(4)
- Rengasamy P, Marchuk A. 2011. Cation ratio of soil structural stability (CROSS). Soil Res. 49(3):280–285.
- Rezaei A, Hassani H. 2018. Hydrogeochemistry study and groundwater quality assessment in the north of Isfahan, Iran. Environ Geochem Health. 40(2):583–608.
- Rezaei A, Hassani H, Hassani S, Jabbari N, Mousavi SBF, Rezaei S. 2018. Evaluation of groundwater quality and heavy metal pollution indices in Bazman basin, southeastern Iran. Groundwater for Sust Develop. :9–100245.
- Ritzi RW, Jr Wright SL, Mann B, Chen M. 1993. Analysis of temporal variability in hydrogeochemical data used for multivariate analyses. Groundwater. 31(2):221–229.
- Rogers RJ. 1989. Geochemical comparison of ground water in areas of New England, New York, and Pennsylvania. Groundwater. 27(5):690–712.
- Rosanoff A. 2013. The high heart health value of drinking-water magnesium. Med Hypotheses. 81(6):1063–1065.
- Rosanoff A, Costello RB, Johnson GH. 2021. Effectively prescribing oral magnesium therapy for hypertension: a categorized systematic review of 49 clinical trials. Nutrients. 13(1):195.
- Rose BD, Post D, Rose B, Narins R. 2000. Clinical physiology of acid-base and electrolyte disorders. New York, NY: mcGraw-Hill Companies.
- Rubio B, Nombela MA, Vilas F. 2000. Geochemistry of major and trace elements in sediments of the Ria de Vigo (NW Spain): an assessment of metal pollution. Marine Pollution Bul. 40(11):968–980.
- Rylander R. 2008. Drinking water constituents and disease. J Nutr. 138(2):423S–425S.
- Sakai H. 2001. Stratigraphic division and sedimentary facies of the Kathmandu Basin sediments. J Nepal Geol Soc. 25:19–32.
- Saleh A, Al-Ruwaih F, Shehata M. 1999. Hydrogeochemical processes operating within the main aquifers of Kuwait. J Arid Env. 42(3):195–209.
- Salifu M, Aidoo F, Hayford MS, Adomako D, Asare E. 2017. Evaluating the suitability of groundwater for irrigational purposes in some selected districts of the Upper West region of Ghana. Appl Water Sci. 7(2):653–662.
- Samantara MK, Padhi RK, Sowmya M, Kumaran P, Satpathy KK. 2017. Heavy metal contamination, major ion chemistry and appraisal of the groundwater status in coastal aquifer, Kalpakkam, Tamil Nadu, India. Groundwater Sus Dev. 5:49–58.
- Sarif MO, Rimal B, Stork NE. 2020. Assessment of changes in land use/land cover and land surface temperatures and their impact on surface urban heat island phenomena in the Kathmandu Valley (1988–2018). IJGI. 9(12):726.
- Sarkar B, Mitchell E, Frisbie S, Grigg L, Adhikari S, Byanju RM. 2022. Drinking water quality and public health in the Kathmandu Valley, Nepal: Coliform bacteria, chemical contaminants, and health status of consumers. J Environ Public Health. 2022:3895859.
- Sbarbati C, Colombani N, Mastrocicco M, Petitta M, Aravena R. 2018. Reactive and mixing processes governing ammonium and nitrate coexistence in a polluted coastal aquifer. Geosciences. 8(6):210.
- Selemani JR, Zhang J, Muzuka ANN, Njau KN, Zhang G, Maggid A, Mzuza MK, Jin J, Pradhan S. 2017. Seasonal water chemistry variability in the Pangani River basin, Tanzania. Environ Sci Pollut Res. 24(33):26092–26110.
- Shakya BM, Nakamura T, Kamei T, Shrestha SD, Nishida K. 2019. Seasonal groundwater quality status and nitrogen contamination in the shallow aquifer system of the Kathmandu Valley, Nepal. Water. 11(10):2184.
- Shakya BM, Nakamura T, Shrestha SD, Nishida K. 2019. Identifying the deep groundwater recharge processes in an intermountain basin using the hydrogeochemical and water isotope characteristics. Hydro Res. 50(5):1216–1229.
- Shrestha S, Haramoto E, Malla R, Nishida K. 2015. Risk of diarrhoea from shallow groundwater contaminated with enteropathogens in the Kathmandu Valley, Nepal. J Water Health. 13(1):259–269.
- Shrestha S, Nakamura T, Malla R, Nishida K. 2014. Seasonal variation in the microbial quality of shallow groundwater in the Kathmandu Valley, Nepal. Water Supply. 14(3):390–397.
- Shukla S, Saxena A, Khan R, Li P. 2021. Spatial analysis of groundwater quality and human health risk assessment in parts of Raebareli district, India. Env Earth Sc. 80(800)
- Sonkamble S, Sahya A, Mondal NC, Harikumar P. 2012. Appraisal and evolution of hydrochemical processes from proximity basalt and granite areas of Deccan Volcanic Province (DVP) in India. J Hydrol. 438:181–193.
- Sorensen JPR, Sadhu A, Sampath G, Sugden S, Dutta Gupta S, Lapworth DJ, Marchant BP, Pedley S. 2016. Are sanitation interventions a threat to drinking water supplies in rural India? An application of tryptophan-like fluorescence. Water Res. 88:923–932.
- Stewart MK, Aitchison-Earl PL. 2020. Irrigation return flow causing a nitrate hotspot and denitrification imprints in groundwater at Tinwald, New Zealand. Hydrol Earth Syst Sci. 24(7):3583–3601.
- Strazzullo P, D'Elia L, Kandala N-B, Cappuccio FP. 2009. Salt intake, stroke, and cardiovascular disease: meta-analysis of prospective studies. BMJ. 339:b4567.
- Subramani T, Elango L, Damodarasamy SR. 2005. Groundwater quality and its suitability for drinking and agricultural use in Chithar River Basin, Tamil Nadu, India. Environ Geol. 47(8):1099–1110.
- Swaminathan R. 2003. Magnesium metabolism and its disorders. Clin Bioch Rev. 24(2):47–66.
- Syafrudin M, Kristanti RA, Yuniarto A, Hadibarata T, Rhee J, Al-Onazi WA, Algarni TS, Almarri AH, Al-Mohaimeed AM. 2021. Pesticides in drinking water-a review. IJERPH. 18(2):468.
- Tang J, Zhu Y, Xiang B, Li Y, Tan T, Xu Y, Li M. 2022. Multiple pollutants in groundwater near an abandoned Chinese fluorine chemical park: concentrations, correlations and health risk assessments. Sci Rep. 12(1):3370.
- Thapa BR, Ishidaira H, Pandey VP, Shakya NM. 2017. A multi-model approach for analyzing water balance dynamics in Kathmandu Valley. Nepal. J Hydro Region Stud. 9:149–162.
- Tian Y, Yu C, Zha X, Wu J, Gao X, Feng C, Luo K. 2016. Distribution and potential health risks of arsenic, selenium, and fluorine in natural waters in Tibet, China. Water. 8(12):568.
- Tijani MN. 1994. Hydrogeochemical assessment of groundwater in Moro area, Kwara State, Nigeria. Geo. 24(3):194–202.
- Todd DK, Mays LW. 2004. Groundwater hydrology. John Wiley & Sons.
- Topol LE, Mitchell WJ. 1985. Quality assurance manual for precipitation measurement systems. US Env Prot Agency.
- Townsend MA, Whittemore DO. 2005. Identification of nitrate and chloride sources affecting municipal well waters of the city of McPherson. Kansas: Kansas Geological Survey, Open-file Report; Vol. 34, p. 24.
- Tulip SS, Siddik MS, Islam MN, Rahman A, Haghighi AT, Mustafa SMT. 2022. The impact of irrigation return flow on seasonal groundwater recharge in northwestern Bangladesh. Agri Water Man. 266.
- UNDP. 2018. Sustainable Development Goals. Available from: https://www.undp.org/sustainable-development-goals#clean-water-and-sanitation. [accessed on 9th November 2022].
- Vadiati M, Adamowski J, Beynaghi A. 2018. A brief overview of trends in groundwater research: progress towards sustainability. J Env Man. 223:849–851.
- Wali SU, Alias N, Harun SB. 2020. Quality reassessment using water quality indices and hydrochemistry of groundwater from the Basement Complex section of Kaduna Basin, NW Nigeria. SN Appl Sci. 2(10):1742.
- Wali SU, Alias N, Harun SB. 2021. Reevaluating the hydrochemistry of groundwater in basement complex aquifers of Kaduna Basin, NW Nigeria using multivariate statistical analysis. Env Earth Sc. 80(5).
- Ward MH, deKok TM, Levallois P, Brender J, Gulis G, Nolan BT, VanDerslice J, International Society for Environmental Epidemiology. 2005. Workgroup report: drinking-water nitrate and health—recent findings and research needs. Environ Health Perspect. 113(11):1607–1614.
- Warner NR, Levy J, Harpp K, Farruggia F. 2008. Drinking water quality in Nepal’s Kathmandu Valley: a survey and assessment of selected controlling site characteristics. Hydrogeol J. 16(2):321–334.
- Wei YN, Fan W, Wang W, Deng L. 2017. Identification of nitrate pollution sources of groundwater and analysis of potential pollution paths in loess regions: a case study in Tongchuan region, China. Environ Earth Sci. 76(12):1–13.
- Wilcox. 1955. Classification and use of irrigation waters (No. 969). US Dept Agri.
- Wilcox LV. 1948. The quality of water for irrigation use (No. 1488-2016-124600).
- Wilcox LV, Durum WH. 1967. Quality of irrigation water. Irri Agri Lands. 11:104–122.
- World Bank. 2022. Population growth (annual %): Nepal. Available at: https://data.worldbank.org/indicator/SP.POP.GROW?end=2021&locations=NP&start=1995. [accessed on 25th September 2022].
- World Health Organization. 2004. Guidelines for drinking-water quality. Health criteria and other supporting information. 3rd Ed., Geneva, Switzerland: World Health Organization.
- World Health Organization (WHO). 2011. Guidelines for drinking water. 4th ed. Geneva: World Health Organization.
- World Health Organization (WHO). 2017. Guidelines for drinking-water quality. incorporating the first addendum. 4th ed. Geneva, Switzerland: WHO.
- World Health Organization (WHO). 2019. Trends in maternal mortality 2000 to 2017: estimates by WHO, UNICEF, UNFPA, World Bank Group and the United Nations Population Division.
- Wu H, Chen J, Qian H, Zhang X. 2015. Chemical characteristics and quality assessment of groundwater of exploited aquifers in Beijiao water source of Yinchuan, China: a case study for drinking, irrigation, and industrial purposes. J Chem. 2015.
- Wu J, Li P, Qian H. 2015. Hydrochemical characterization of drinking groundwater with special reference to fluoride in an arid area of China and the control of aquifer leakage on its concentrations. Environ Earth Sci. 73(12):8575–8588.
- Wu J, Li P, Qian H, Duan Z, Zhang X. 2014. Using correlation and multivariate statistical analysis to identify hydrogeochemical processes affecting the major ion chemistry of waters: a case study in Laoheba phosphorite mine in Sichuan, China. Arab J Geosci. 7(10):3973–3982.
- Xiao J, Jin ZD, Ding H, Wang J, Zhang F. 2012. Geochemistry and solute sources of surface waters of the Tarim River Basin in the extreme arid region. NW Tibetan Plateau J Asian Earth Sci. 54:162–173.
- Yadav KK, Gupta N, Kumar V, Choudhary P, Khan SA. 2018. GIS-based evaluation of groundwater geochemistry and statistical determination of the fate of contaminants in shallow aquifers from different functional areas of Agra city, India: levels and spatial distributions. RSC Adv. 8(29):15876–15889.
- Yang X, Xie X, Liu DL, Ji F, Wang L. 2015. Spatial interpolation of daily rainfall data for local climate impact assessment over greater Sydney region. Adv Meteor. 563629
- Zhang SR, Lu XX, Higgitt DL, Chen CTA, Sun HG, Han JT. 2007. Water chemistry of the Zhujiang (Pearl River): natural processes and anthropogenic influences. J Geoph Res Earth Surf. 112(F1)
- Zhu XM, Pan ZR, Zhao DH, Zhang W, Ruan XH. 2019. Hydrochemical properties and groundwater quality evaluation in Suzhou City, lower Yangtze Delta, China. In IOP Conference Series: Earth and Environmental Science. IOP Publishing. Vol. 344, No. 1, p. 012063.