
 ?Mathematical formulae have been encoded as MathML and are displayed in this HTML version using MathJax in order to improve their display. Uncheck the box to turn MathJax off. This feature requires Javascript. Click on a formula to zoom.
Abstract
Accurate and timely detection of river change attaches importance to regional ecological security. Since river change is a complex and dynamic process, there are difficulties to describe it properly. Inspired by geographic events research, river pattern events are innovatively proposed to quantify river change process, combining multi-dimensional information thoroughly. First, inter- and intra- events are defined by comparing typologies changes of river patterns. Afterwards, a river pattern events model (RPEM), integrating "Event types-Spatial locations-River patterns-Morphological features-Hydrological attributes", was proposed to maximally characterize river change process. River pattern events were detected using the object increment difference (OID), and were interpreted as the semantic information in realistic rivers. Experimental results in the Lower Yellow River (LYR) demonstrated that the proposed method achieves good performance in assessing the morphological and hydrological change process. River pattern events are expected to support rapid detection and dynamic analysis of regional and global river change.
1. Introduction
Rivers are the blood on which human survival depends (Ripl Citation2003). Changes in rivers affect national economic development, ecological security of water resources, agricultural production, and daily life of residents (Dolan et al. Citation2021; Qiu et al. Citation2022). With the influence of climate change (Shrestha et al. Citation2020), geological formations (Ostrowski et al. Citation2021) and human activities (Lehner et al. Citation2011; Zhao et al. Citation2020), river morphology is constantly adjusting to the imposed flow and sediment conditions (Ma et al. Citation2012). Therefore, it is essential to quantify changes in rivers through changes in channel morphology and related hydrological processes (Dingle et al. Citation2019), which has been the focus of many scholars.
Recent advances in remote sensing technology provide unprecedented access to continuous monitoring of river changes under long-term series (Pekel et al. Citation2016), such as the implementation of assessing the planform morphological adjustments of rivers (Hossain et al. Citation2013; Kong et al. Citation2020), quantifying channel migration (Li et al. Citation2017; Xia et al. Citation2021), analysing river morphodynamics (Shahrood et al. Citation2020), and detecting the spatio-temporal topological relationship of rivers (Liang et al. Citation2017). Accordingly, several quantitative indices have been developed to characterize river features, including river geometry parameters (river length, width, sinuosity, width/depth ratio, etc.) (Bora and Goswami Citation2022), migration indices (migration rates) (Xia et al. Citation2021), morphological indices (fractal coefficients, braided indices, fractal dimensions) (Chen et al. Citation2015; Dewan et al. Citation2017), etc. Although a large number of indicators provide a wealth of information on river change, the quantization of river changes using these parameters is fragmented and is difficult to express the process of river changes. Moreover, previous studies have mainly measured the river as a whole and rarely studied river changes with classification. Therefore, it is necessary to proposed a method for classifying and measuring river changes in order to capture the information of river change systematically.
In addition to the morphological changes, hydrologists are more concerned with the transformations between different river patterns occurring under various water and sand conditions, such as major flooding events in the lower Colorado River from 1976 to 2000 caused a dramatic shift in flow and resulted in significant adjustments in channel width. The evolution of river bars in the Padma River is largely influenced by the variation of both water and sediment flows (Nawfee et al. Citation2018). Runoff and sediment transport in the lower Yellow River (LYR) are closely related to the transformation of river patterns (Wang et al. Citation2020). Especially, the construction of dams on rivers will affect the changes of hydrological characteristics in river (Ma et al. Citation2012; Liu et al. Citation2021). For example, two large dams (Kariba and Cahora Bassa dam) on the lower Zambezi River in Mozambique have altered the natural seasonal flow of the river, as well as the sediment balance and morphology. After the operation of Xiaolangdi Dam in the LYR, the median grain size increased significantly (Chen et al. Citation2008), sandbars in the upper reaches degraded, although the opposite was observed in the lower reaches (Kong et al. Citation2020). In the braided reach of the LYR, the main channel was changed by widening transversely and deepening vertically after continual siltation and scouring periods (Wang et al. Citation2020). Therefore, hydrological information and river morphological characteristics are acknowledged as essential integrating components for interdisciplinary studies which aim to develop understanding of river behaviour to characterize river changes.
River patterns are the basic units that constitute river geomorphology, and are one of the most direct presentations of the river changes (Twidale Citation2004; Eaton et al. Citation2010). The spatiotemporal change of river patterns can be regarded as a quantitative or even qualitative change from one state to another, including spatial location, morphological features, hydrological attributes, etc. Peuquet and Niu (Citation1995) suggested that a geographical region experienced every state change (including those of its spatial characteristics, attributes, etc.) called a geographic event. In recent years, with the explosive growth of geographic big data, geographic events, known as the basic unit for describing geographic processes, have gradually become a core research content of geographic information science (GIS) (He et al. Citation2022; Zheng et al. Citation2022). For example, a framework for modelling geographic events under multi-source geographic big data was designed to realize multi-scale spatiotemporal response and regional difference analysis of human activities (Du et al. Citation2021). A framework for studying geographical events including the three dimensions of 'state-event-based’ has also been applied to detect and update land-use change events (Xia et al. Citation2011). Moreover, geographic events can not only demonstrate the dynamic changes of states through multidimensional information, but also present the superiority in spatio-temporal reasoning, cause, and mechanism analysis (He et al. Citation2022).
Inspiration from the research framework of geographic events, river pattern events were proposed to extract river information from multiple dimensions for capturing river characteristics maximumly, expecting to provide a feasible solution for the systematic and comprehensive quantification of river change processes. Our contributions are summarized as follows:
To enable the description of river change, the concept of river pattern events is proposed to characterize the main features of river changes and indicate the multidimensional information change in time series.
To express the morphological features of river patterns and the hydrological change process simultaneously, a river pattern events model (RPEM), containing five-dimensional information of "Event types-Spatial locations-River patterns-Morphological features-Hydrological attributes", is proposed to extract the river change information systematically.
To further describe river changes more in accordance with human perception, a mapping relationship between river pattern events and river changes in reality, is proposed to interpret the change information of rivers. Finally, a complete information table of river change is output automatically.
2. Materials and methods
2.1. Data description
2.1.1. Remote sensing series
The remote sensing data used in this paper are from Landsat 5 thematic Mapper (TM) images, Landsat 7 Enhanced Thematic Mapper (ETM+) images and Landsat 8 Operational Land Imager (OLI) images, consisting rich multispectral data at 30 m resolution, downloaded from the Earth Resources Observation and Science (EROS) Centre (http://glovis.usgs.gov/). Image selection was based on image quality (cloud cover <40%), hydrological conditions (to distinguish water bodies along the river) (Shahrood et al. Citation2020) and the specific date (dry season with relatively stable channel). Finally, 21 multitemporal Landsat images covering the lower Yellow River in 2000, 2010 and 2020 were acquired (See Appendix, Table A1 for details).
Table 1. Definition and classification of river patterns.
2.1.2. River measured data
The hydrological station on the LYR provides measured data including runoff, sand transport, sand content, and median grain size. They are obtained from Yellow River Sediment Bulletin and the Yellow River Water Resources Bulletin published by the Yellow River Conservancy Commission for the periods 2000 to 2020.
2.2. Study area
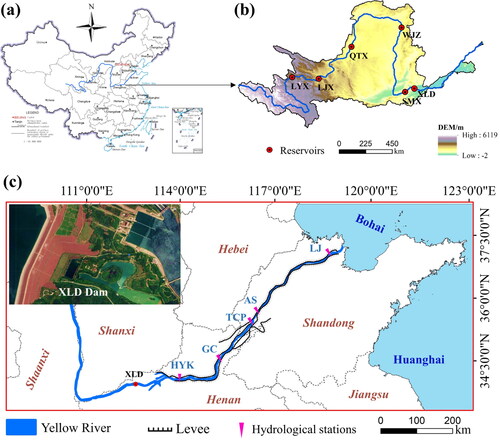
The Lower Yellow River (LYR) has been a hotspot for geomorphological and hydrological research due to its sandy and silty nature and its frequent diversions (Kong et al. Citation2017). According to statistics, the LYR has flooded 1,593 times in the past few thousand years, with 26 major diversions, resulting in serious flooding disasters (Xia et al. Citation2021). Many measures have been taken to solve this problem, including the construction of dams and soil conservation measures, the most important of which is the construction of the Xiaolangdi (XLD) reservoir at the exit of the last gorge in the middle reaches of the Yellow River (). After the XLD reservoir was applied in 2000, the water and sand conditions entering the LYR had changed considerably (Kong et al. Citation2020). The evolution of the riverbed in the LYR has taken on new characteristics as a result of the continuous scouring of the river, especially changes in the morphology of the river channel. Therefore, the LYR below XLD was chosen as the experimental area in this paper.
Figure 1. Map of the geographical location of the study area. (a) Geographical location of the Yellow River in China, downloaded from the Ministry of Natural Resources of the people’s Republic of China (www.mnr.gov.cn/sj/sjfw) (b) DEM and main reservoirs in the Yellow River Basin. Abbreviations include Longyangxia (LYX), Liujiaxia (LJX), Qingtongxia (QTX), Wanjiazhai (WJZ), Sanmenxia (SMX), and XLD. (c) Detailed map of the LYR, including main hydrological stations and XLD Dam. Abbreviations include Huayuankou (HYK), Gaocun (GC), Taochengpu (TCP), Aishan (AS), and Lijin (LJ).
2.3. Methodology
2.3.1. The research framework
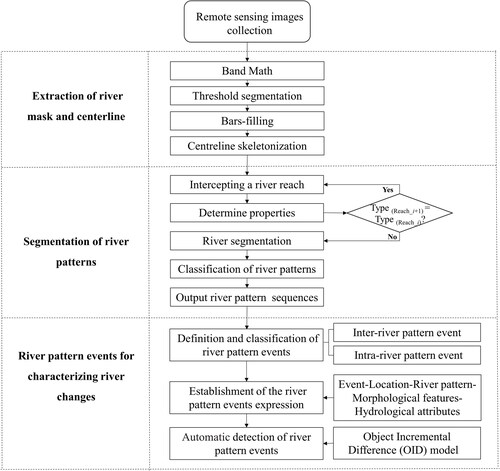
The river change quantification approach proposed in this study is shown in , which mainly consists three sections, extraction of river mask and centreline, segmentation of river patterns, and the river pattern events for characterizing river changes.
Figure 2. Flowchart of the method in this paper.
2.3.2. Extraction of river mask and centreline
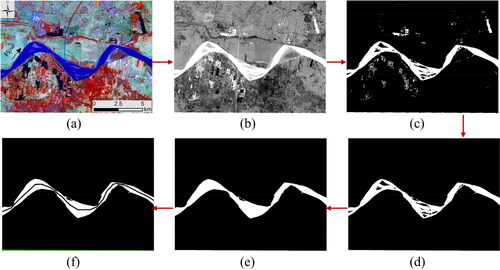
The extraction of river mask and centreline from Landsat images are mainly three steps. First, the Normalized Difference Water Index (NDWI) (Mcfeeters Citation1996) and the modified Normalized Difference Water Index (MNDWI) (Xu Citation2006) index were employed to perform Band Math on multi-band remote sensing images to obtain grayscale images of rivers with values ranging between −1 and 1 (). Then, an automatic threshold classification method based on the Enhanced classification and regression tree (CART) (Ahmadlou et al. Citation2023) was used to extract the most suitable river mask and obtain the binary river data, i.e. 1 for rivers and 0 for non-rivers (). In order to obtain the target river, we need to perform human-machine interpretation and remove information about water bodies such as lakes and ponds (). The centreline extracted in this paper is the centre between the river boundaries and without considering the internal bars and islands. Therefore, all the holes inside the river boundary are assigned a value of 1(), that is, the bars and islands inside the river are filled. After using the skeletonization algorithm proposed by Monegaglia et al. (Citation2018) and removing the burr noise from the pruning algorithms, the final river centreline is obtained (). Detailed procedures are provided in the Appendix.
Figure 3. Schematic diagram of river mask and centreline extraction from Landsat images.
2.3.3. Segmentation of river patterns
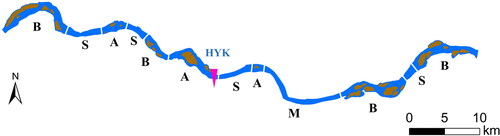
Although there are no rigorously defined criteria for river patterns, the classification scheme proposed by Qian (Citation1985), i.e. straight, meandering, anabranched, and braided, is commonly applied to divide the River Styles in the LRY. The river planform is a spatially arranged combination of these four river patterns. lists the definitions and planform characteristics of river patterns, which is the basis for segmenting river patterns.
From the perspective of the GIS data, the vector structure of river patterns can be seen as consisting of polygons (). Among them, the single-channel river can be regarded as a simple polygon, and the multi-channel river can be considered as a complex multi-polygon with holes inside (i.e. bar or island). Automatic segmentation of rivers to extract four river patterns by using Python tool. shows an example of river pattern segmentation and the detailed steps are shown in the Appendix. Moreover, in order to evaluate the accuracy of river pattern classification, 50 water experts were invited to score the accuracy of the extraction results of four river pattern units: straight, meandering, anabranched and braided, with scores set at 5, 4, 3, 2, 1 and 0, respectively. Finally, the scoring results of experts were statistically analysed, as shown in . The average score of the river pattern unit extraction results was 4.75. More detailed evaluation results are provided in the Appendix.
Figure 4. Schematic diagram of river pattern sequences. S, M, A, B are the abbreviations for straight, meandering, anabranched, and braided, respectively.
2.3.4. River pattern events for characterizing river changes
2.3.4.1. Definition and classification of river pattern events
Inspired by the modelling framework of geographic events (Du et al. Citation2021), this study uses changes occurring in river pattern units at two moments to define River Pattern Event. Each state change (e.g. type, geometric characteristics and hydrological attributes) of a river pattern unit within a certain spatial and temporal domain is regarded as a River Pattern Event, which records and expresses the occurrence, development and process of river change, and is a reflection of objective facts.
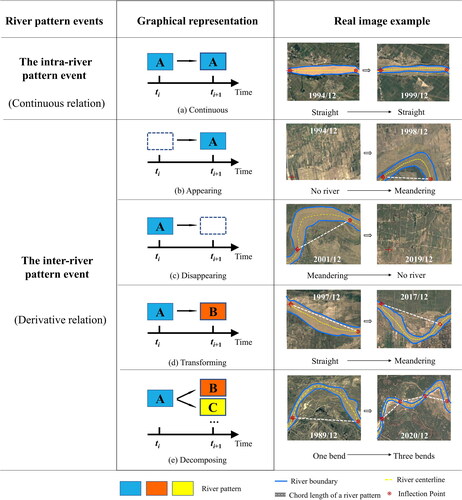
Two types of river pattern event are classified according to whether the type changes of river pattern at two moments, with the following classification rules.
The intra-river pattern event (Noted as Eo). A river pattern unit appears continuously at two consecutive moments and has the same type. For example, a river pattern unit is straight at ti, and it remains straight at t(i+1), as shown in . Referring to the definition of atomic events by Schneider and Xhafa (Citation2022), this kind of event consists of four types of atomic events, i.e., straight-straight, meandering-meandering, anabranched-anabranched and braided-braided.
The inter-river pattern event (Noted as E-). A river pattern unit is transformed in the next moment and there are other river patterns created or disappeared. There are four types of derivative relationships in the inter-river pattern event. ① Appearing. A new river pattern unit is generated at t(i+1), which has no father object and is not related to any river pattern unit at ti, as in . ② Disappearing. A river pattern unit at ti disappears at t(i+1), it has no child objects and is not related to any river pattern unit at t(i+1), as in . ③Transforming. A river pattern unit at ti is converted to a new river pattern unit at t(i+1), consisting of a total of 12 atomic events for the interconversion between the four river patterns (e.g., straight- meandering, straight- anabranched, etc.), as shown in . ④Decomposing. A river pattern unit at ti is decomposed into multiple river patterns at t(i+1), that is, multiple child objects at t(i+1) have the same father object at ti, as shown in .
2.3.4.2. Establishment of the river pattern events model
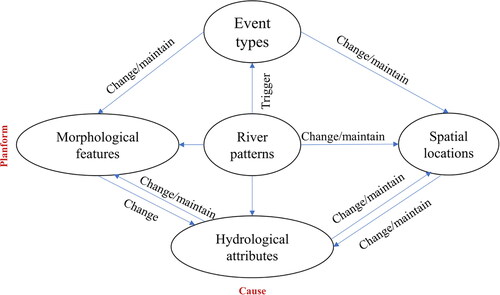
River pattern events cause a series of state changes between river patterns. Each state change of a river pattern is essentially a spatio-temporal process, involved in the continuous changes of spatial locations, morphological and hydrological properties. This paper constructs a river pattern events model (RPEM) consisting of five dimensions of “Event types-Spatial locations-River patterns-Morphological features-Hydrological attributes” based on the definition of river pattern events. The change of river patterns is the core element that triggers such events. Event types, spatial locations, morphological features and hydrological attributes can be used to specifically describe the river pattern event. The relationship between five dimensions is shown in .
Figure 5. The relationship of five-dimensional information in the RPEM model.
In this paper, the five-dimensional information in the RPEM model is integrated into a five-tuple expression (E, ΔM, ΔP, ΔS, ΔA), as shown in Formula (1). The detailed calculation method of morphological features is shown in the Appendix.
(1)
(1)
where E is the event identifier, including the river pattern events listed in , E = {e1, e2,…, en}. ΔM is the type change occurring of river pattern unit at ti and t(i+1). ΔP represents the change in spatial location of river patterns, ΔP={Δpt(i), Δpt(i+1)}, in this paper, Δpt(i) and Δpt(i+1) are represented by the combination of the sequence index k of the river pattern and the distance d to the starting point at ti and t(i+1), respectively. ΔS is a set of the basic morphological features of river patterns, i.e. ΔS= {ΔRW, ΔRL, ΔFD, ΔNBI}, where ΔRW is the river width change (m), ΔRL is the river length change (m), ΔFD is the change of flow direction (°), ΔNBI the change of the number of bars and islands (n). ΔA is a set of hydrological attributes affecting river pattern transformation. Referring to the existing research results on river hydrological process (Kong et al. Citation2017; Wang et al. Citation2020), runoff (r/108m3), suspended sediment load (s/108t), suspended sediment concentration (q/kg/m3) and medium grain size of suspended sediment (m/mm) are selected to be expressed in ΔA =(Δr, Δs, Δq, Δm).
Figure 6. Classification scheme of river pattern events.
2.3.4.3. Automatic detection of river pattern events
Event detection is designed to measure the spatial relationships of river pattern sequences and to discriminate events based on the changes in river patterns. Assuming that the river pattern sequence is Mti=(m1,m2,…,mi) at ti, and at t(i + 1), river pattern events occur in both sequences. The specific detection process of river pattern events is as follows:
Step 1. Labelling two periods of river pattern sequences (Mt(i), Mt(i+1)).
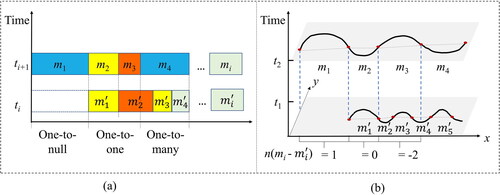
Step 2. The coordinate transformation of the river pattern unit sequences Mt(i) and Mt(i+1) at ti and t(i+1) is performed using the method of principal component transformation, as in .
Step 3. The sequence of river pattern (Mt(i), Mt(i+1)) at ti and t(i+1) is projected onto a one-dimensional (1D) time axis.
Step 4. Detect river pattern events on 1D projected axes using the Object Incremental Difference (OID) model (Chen et al. Citation2012), including Object positive difference (OPD), Object Negative difference (OND), Expansion positive difference (EPD), Contraction Negative difference (CND), Deviation positive and negative difference (DPND), Expansion and contraction difference (ECD) and No difference (ND). Three correspondences will exist between the projected Mt(i+1) and Mt(i) as follows.
A river pattern unit in Mt(i) cannot correspond to a river pattern in Mt(i+1), i.e., a river pattern unit at ti disappears at t(i+1), which can be expressed as n(mi -
)>0.
A river pattern unit in Mt(i) corresponds to a river pattern in Mt(i+1), i.e., a river pattern unit at ti can correspond to a river pattern at t(i+1), which can be expressed as n(mi -
A river pattern unit in Mt(i) corresponds to multiple river patterns in Mt(i+1), i.e., a river pattern unit at ti is decomposed into multiple river pattern unit at t(i+1), which can be expressed as n(mi -
Figure 7. Schematic diagram of river pattern event detection and discovery. (a) The corresponding relationship between the sequences of river pattern units at two moments; (b) Example diagram.
Step 5. River pattern events are discriminated based on the change type of river pattern unit. In the three corresponding relations, cases (1) and (3) can directly determine the occurrence of s the inter-river pattern event. In case (2), the river pattern event should be judged according to whether the type of river pattern has been transformed.
3. Results
3.1. Creating the river pattern event sequence
The river pattern event sequence E ={e1, e2,…, en} is the basis for the expression and detection of river pattern events. Assign a unique ID (ObjectID), a sequence number of river pattern units along the flow direction, to each river pattern unit in the sequence. Because river pattern events are identified according to the type changes of river pattern units between ti and t(i+1), and the sequence number of river pattern units at ti can be regarded as the sequence number of river pattern events. As shown in , the sequence number of river pattern units along the flow direction in 2000 is the sequence number of river pattern events from 2000 to 2010. After the creation of river pattern event sequence, the attributes of river pattern units are indexed and recorded according to the sequence ID, which can realize the automatic extraction and output of river change information.
Figure 8. Schematic diagram of river pattern event sequence.
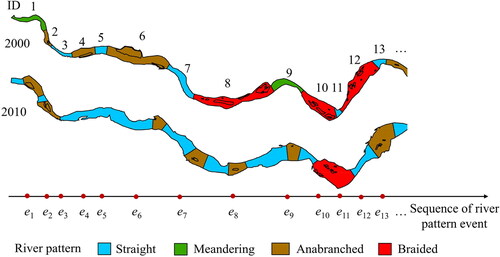
Figure 9. Spatio-temporal distribution and statistics of river pattern events in 2000, 2010, and 2020. Inter-river pattern events in the legend are indicated by 0. Intra-river pattern events include four cases, 1, 2, 3, ≥4, respectively, represent that an individual river pattern at t2 is translated from 1, 2, 3, ≥4 river patterns at ti, e.g. 3 refers to the number of river patterns at t(i+1).
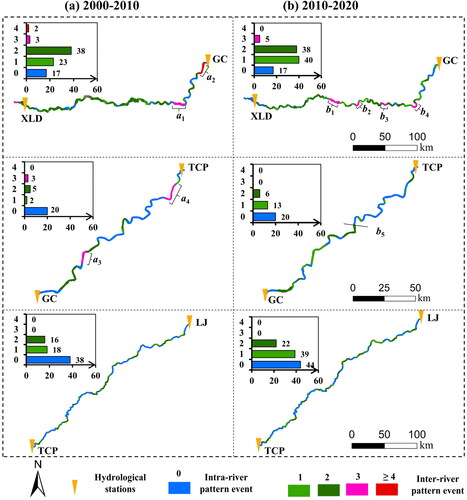
3.2. Spatio-temporal distribution characteristics of river pattern events
shows the spatio-temporal distribution of river pattern events from 2000-2020 in the LYR. The river reach of XLD-GC was dominated by inter-river pattern events from 2000-2010. Between 2000 and 2010, the largest number (38) of transitions from two river-patterns to one river-pattern came about, indicating that many river pattern mergers occurred during this period. Additionally, three river-patterns merged into one where the river direction changes (a1). There are even more than four river-patterns merged and transformed near the GC hydrological station (a2). The GC-TCP reach was dominated by intra-river pattern events, but two major merging transitions of river patterns have also occurred (a3, a4). There are spatial crossing-distribution between two events in the TCP-LJ reach with approximately equal numbers of occurrences.
From 2010-2020, the number of inter-river pattern events was significantly greater than in the previous decade, with frequent translation between river patterns. More specifically, there were significantly more inter-river pattern events in the XLD-GC reach than in the previous decade, with four distinct merging transitions of river patterns (b1-b4). The GC-TCP reach was bounded by b5, with inter-river pattern events dominating the former section and intra-river pattern events occurring in the latter section. In TCP-LJ reach, inter-river pattern events (64) were greater than intra-river pattern events (44).
To summarize, the degree of merging and transitions between river patterns is the XLD-GC reach, the GC-TCP reach, and the TCP-LJ reach, in descending order. Therefore, the evolutionary process of river patterns is spatio-temporally heterogeneous in the LYR, and it is necessary to explore the evolutionary mechanisms by segmenting river reaches according to river patterns.
3.3. Extraction and output of river change information
Four hydrological stations on the LYR were selected as examples to output the multidimensional information of river pattern events in order to comprehensively quantify river changes (). As shown in , 2000, 2010 and 2020 saw inter-river pattern events at stations GC and AS, with a significant transition between these four river patterns. From 2000 to 2020, the river channel mainly migrated laterally, with a corresponding increase in the number of inner bars and islands. The river patterns at the GC station and the AS station occurred intra-river pattern events in 2000, 2010 and 2020, and the internal elements (the channel width, length, bars, and islands) of the river changed, which presents three types of incremental differences: EPD, CND, and ECD. In 2000-2010, an intra-river pattern event occurred near the LJ station, but an inter-river pattern event occurred in 2010-2020, which was converted from a straight river-pattern to a meandering river-pattern. Semantic interpretation is a direct translation of this information, making it more accessible for people to rapidly access changes in the core elements of the river.
Figure 10. Changes of river patterns at typical hydrological stations.
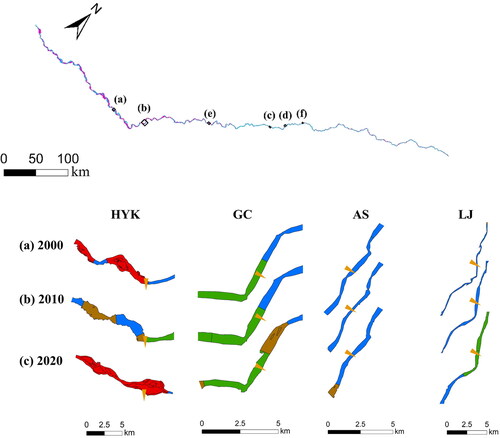
Table 2. Information extraction and output of river pattern events of four hydrological stations on the LYR (2000–2020).
4. Discussion
4.1. Comparisons between methods of assessing river changes
To demonstrate the advantages of the river pattern events, this paper compares multiple methods used to express river change, as shown in . First, the automatic river segmentation method designed in this paper has high consistency with the manual visual interpretation results, but reduces the errors caused by human factors in manual segmentation. Traditionally, rivers are segmented to study river change, based on fixed hydrological stations or urban locations. As a result, the morphological structure of the river might be destroyed at the segmentation, and the classification of river patterns is not accurate enough. Equal length or equal percentage segmentation is another common method, yet the results are difficult to reasonably interpret for geomorphological or hydrological features. In addition, when it comes to river segmentation, the watershed scale is more suitable for studying river change at large spatial scales, not at fine scales. River reach, a meaningful and widely used concept, is a river unit that incorporates a set of dominant processes working on a river segment. In this paper, the segmentation method of river reach, utilizing four river pattern units, are further defined at the reach scale. Importantly, this segmentation method is based on River Styles, which resembles the planform archetype proposed by Nardini and Brierley (Citation2021), and the description of river changes conforms to human cognitive habits more.
Table 3. Comparison of methods for expressing river changes.
Most of the previous studies have used multiple index combinations to quantitatively compare and analyse river changes, focusing on certain aspects such as river morphology, river migration, etc. The method of river pattern event provides a new idea to classify river change. The RPEM model incorporates information from five dimensions and characterize the information changes of river patterns during their transformation process, comprehensively and systematically. Moreover, it is also helpful to excavate the underlying transformation mechanism between river patterns, providing a reliable theoretical support for in-depth analysis of the process of river change.
4.2. Potential mechanisms analysis underlying river pattern events
Implementing water-sediment regulation is one of the main goals of the XLD reservoir on LYR (WSRS) (Kong et al. Citation2020). Therefore, the dynamics of river pattern events are closely related to the flow patterns of water and sediment, and the boundary conditions of fluvial systems. shows information about river pattern events and their hydrological attributes at the LYR from 2000-2020. The HYK-GC reach is characterized by high runoff, high sediment transport, and high suspended sediment concentration. Correspondingly, the river patterns on this reach have undergone numerous transformations over the last 20 years, with inter- events greater than intra- events of river patterns. Specifically, the river reaches of meandering and braided had more inward transformation than that outward from 2000 to 2010, whereas there was an opposite performance between the straight and anabranched river. The anabranched and braided river reach were gradually converted into the meandering and straight river reach from 2010 to 2020. This indicates that after several WSRSs in this river reach, channels are more simplified with slightly higher sinuosity, less sediment storage capacity, and the decrease in sand bars.
Figure 11. Statistics of river pattern events on the LYR and hydrological properties in the RPEM model. (a) and (b) are the transition matrices between the four river patterns, where 1, 2, 3, and 4 represent four river patterns: straight, meandering, anabranched and braided.
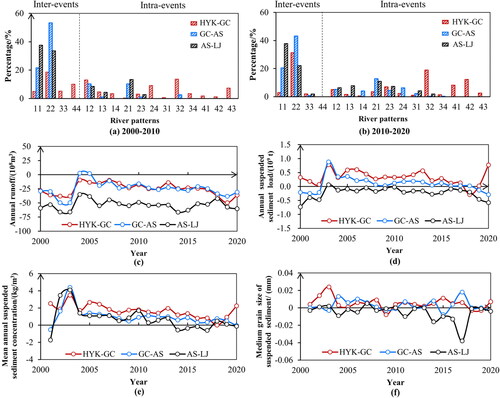
In GC-AS reach, the runoff, sediment transport, and suspended sediment concentration all showed large peaks in 2000-2010, and then gradually decreased and stabilized. Consequently, the inter-river pattern events decreased, the intra-river pattern events increased, and the river patterns transformation was dominated by straight and meandering. From 2010 to 2020, the sediment transport and suspended sediment concentration decreased in this river reach. Some straight and meandering reaches, meanwhile, are converted to braided reaches following the operation of XLD reservoir. This suggests that parts of the sediment eroded from the upper reaches of the LYR have been probably transported to and partially deposited in the lower reaches. This is consistent with the findings reported in previous study (Miao et al. Citation2016).
The runoff and sediment transport in the AS-LJ reach are smaller than those in the other two reaches, with mainly intra-river pattern events occurring. Compared with 2000, the suspended sediment concentration and median particle size increased in 2010. This was accompanied by a gradual increase in the proportion of meandering rivers with the riverbed sedimentation. From 2010 to 2020, the runoff, sediment transport and suspended sediment concentration of this river reach decreased, while the number of straight reaches increased, and the reaches turning into anabranched also increased.
4.3. Potential for extensions of river pattern events method
River pattern events enable the simultaneous description of the multi-dimensional information during the spatio-temporal change process of rivers. However, this paper establishes the mapping relationship between river geometric changes and semantic information. However, the obtained semantic information database needs to be further enriched and improved, limited by the number of samples in the experimental area. Moreover, latest machine learning algorithms have good performance in semantic analysis (Mo et al. Citation2022). If an automatic analysis method is established between the object increment differences and the semantic information of river pattern changes, it will promote the more valuable application of river pattern events in practical decision-making. In addition, river pattern events method established in this paper is also expected to be validated for effectiveness and applicability on more rivers in the world in the future.
5. Conclusion
River pattern events, as proposed in this paper, capture the core change form-river pattern, to classify the types of river change. First, inter- and intra-river pattern, are defined according to whether the river pattern transition occurs. To systematically study the information change in river pattern events, a RPEM model was constructed to quantify the river pattern changes along the time axis in five dimensions of "Event types-Spatial locations-River patterns-Morphological features-Hydrological attributes". In addition, river pattern events allow quick detection through the OID model. The river change information of LYR in China from 2000 to 2020 was extracted in this paper. Experimental results demonstrate that the RPEM model incorporates multi-dimensional information of river pattern events, which not only assess the morphological changes in rivers, but also establish links with hydrological processes. It is hoped that the study of river change will stimulate new ideas, trigger a research boom in river pattern events analysis and serve river evolution analysis and monitoring applications.
Supplemental Material
Download MS Word (11.8 MB)Disclosure statement
No potential conflict of interest was reported by the authors.
Additional information
Funding
References
- Ahmadlou M, Ghajari YE, Karimi M. 2023. Enhanced classification and regression tree (CART) by genetic algorithm (GA) and grid search (GS) for flood susceptibility mapping and assessment. Geocarto Int. 38.
- Bora M, Goswami DC. 2022. RS-GIS based assessment of the impact of Hatimura embankment on the channel planform of the Kolong River, Assam, India. Geocarto Int. 17(19):5547–5563.
- Chen J, Lin Y, Liu W, Zhou X. 2012. Formal classification of spatial incremental changes for updating. Acta Geodaetica et Cartographica Sin. 41(1):108–114.
- Chen WL, Wei JH, Li MJ, Zhou YJ. 2015. Fractal measurement of river bed surface and its application on river pattern discrimination. Sci Sin-Tech. 45(10):1073–1079.
- Chen JG, Zhou WH, Sun GH, Hong J. 2008. Initial operation of Xiaolangdi Reservoir and responses of sedimentation in the Lower Yellow River. J Sediment Res. 5:1–8.
- Clerici A, Perego S, Chelli A, Tellini C. 2015. Morphological changes of the floodplain reach of the Taro River (Northern Italy) in the last two centuries. J Hydrol. 527:1106–1122.
- Dewan A, Corner R, Saleem A, Rahman MM, Haider MR, Rahman MM, Sarker MH. 2017. Assessing channel changes of the Ganges-Padma River system in Bangladesh using Landsat and hydrological data. Geomorphology. 276:257–279.
- Dingle EH, Paringit EC, Tolentino P, Williams RD, Hoey TB, Barrett B, Long H, Smiley C, Stott E. 2019. Decadal-scale morphological adjustment of a lowland tropical river. Geomorphology. 333:30–42.
- Dolan F, Lamontagne J, Link R, Hejazi M, Reed PM, Edmonds J. 2021. Water ecological security assessment and spatial autocorrelation analysis of prefectural regions involved in the Yellow River Basin. Nat Commun. 12(1):1–10.
- Du YY, Yi JW, Xue CJ, Qian JL, Pei T. 2021. Modeling and analysis of geographic events supported by multi-source geographic big data. Acta Geograph Sin. 76(11):2853–2866.
- Eaton BC, Millar RG, Davidson S. 2010. Channel patterns: braided, anabranching, and single-thread. Geomorphology. 120(3–4):353–364.
- Grill G, Lehner B, Thieme M, Geenen B, Tickner D, Antonelli F, Babu S, Borrelli P, Cheng L, Crochetiere H, et al. 2019. Mapping the world’s free-flowing rivers. Nature. 569(7755):215–221.
- He YF, Sheng YH, Hofer B, Huang Y, Qin JR. 2022. Processes and events in the centre: a dynamic data model for representing spatial change. Int J Digit Earth. 15(1):276–295.
- Hossain MA, Gan TY, Baki A. 2013. Assessing morphological changes of the Ganges River using satellite images. Quatern Int. 304(5):142–155.
- Kong D, Latrubesse EM, Miao C, Zhou R. 2020. Morphological response of the Lower Yellow River to the operation of Xiaolangdi Dam, China. Geomorphology. 350:106931.
- Kong D, Miao C, Wu J, Borthwick AGL, Duan Q, Zhang X. 2017. Environmental impact assessments of the Xiaolangdi Reservoir on the most hyperconcentrated laden river, Yellow River, China. Environ Sci Pollut Res Int. 24(5):4337–4351.
- Lehner B, Liermann CR, Revenga C, Vörösmarty C, Fekete B, Crouzet P, Döll P, Endejan M, Frenken K, Magome J, et al. 2011. High-resolution mapping of the world’s reservoirs and dams for sustainable river-flow management. Front Ecol Environ. 9(9):494–502.
- Li J, Xia J, Zhou M, Zhang X. 2017. Variation in reach-scale thalweg-migration intensity in a braided reach of the lower Yellow River in 1986-2015: reach-scale Thalweg-migration intensity in a braided reach. Earth Surf Proc Land. 42(13):1–40.
- Liang L, Guodong Y, Shengbo C. 2017. A combinatorial reasoning mechanism with topological and metric relations for change detection in river planforms: an application to GlobeLand30's water bodies. ISPRS Int J Geo-Inf. 6(1):13.
- Liu W, Wang S, Sang Y, Ran L, Ma Y. 2021. Effects of large upstream reservoir operations on cross-sectional changes in the channel of the lower Yellow River reach. Geomorphology. 387:107768.
- Ma Y, He QH, Nanson GC, Li Y, Yao W. 2012. Channel adjustments in response to the operation of large dams: the upper reach of the lower Yellow River. Geomorphology. 147–148:35–48.
- Mcfeeters SK. 1996. The use of the Normalized Difference Water Index (NDWI) in the delineation of open water features. Int J Remote Sens. 17(7):1425–1432.
- Miao CY, Kong DX, Wu JW, Duan QY. 2016. Functional degradation of the water-sediment regulation scheme in the lower Yellow River: spatial and temporal analyses. Sci Total Environ. 551–552:16–22.
- Mo Y, Wu Y, Yang X, Liu F, Liao Y. 2022. Review the state-of-the-art technologies of semantic segmentation based on deep learning. Neurocomputing. 493:626–646.
- Monegaglia F, Zolezzi G, Güneralp I, Henshaw AJ, Tubino M. 2018. Automated extraction of meandering river morphodynamics from multitemporal remotely sensed data. Environ Model Softw. 105:171–186.
- Nanson G, Gibling MR. 2003. Anabranching rivers. In: Middleton GV, editor. The encyclopedia of sediments and sedimentary rocks. London: Kluwer Academic Publishers; p. 9–11.
- Nanson G, Gibling MR. 2004. Anabranching and anastomosing river. In: Goudie AS, editor. Encyclopedia of geomorphology, Vol. 1. London: Routledge; p. 23–25.
- Nardini A, Brierley G. 2021. Automatic river planform identification by a logical-heuristic algorithm. Geomorphology. 375(1–2):107558.
- Nawfee SM, Dewan A, Rashid T. 2018. Integrating subsurface stratigraphic records with satellite images to investigate channel change and bar evolution: A case study of the Padma River, Bangladesh. Environ. Earth Sci. 77(89):1–14.
- Ostrowski P, Falkowski T, Utratna-Ukowska M. 2021. The effect of geological channel structures on floodplain morphodynamics of lowland rivers: a case study from the Bug River, Poland. Catena. 202(1):105209.
- Pekel JF, Cottam A, Gorelick N, Belward A. 2016. High-resolution mapping of global surface water and its long-term changes. Nature. 540(7633):418–422.
- Peuquet DJ, Niu D. 1995. An event-based spatiotemporal data model (ESTDM) for temporal analysis of geographical data. Int J Geographical Inf Sys. 9(1):7–24.
- Qian N. 1985. On the classification and causes of formation of different river patterns. Acta Geograph Sin. 40:1–10.
- Qiu M, Zuo Q, Wu Q, Yang Z, Zhang J. 2022. Water ecological security assessment and spatial autocorrelation analysis of prefectural regions involved in the Yellow River Basin. Sci Rep. 12(1):5105.
- Ripl W. 2003. Water: the bloodstream of the biosphere. Philos Trans R Soc Lond B Biol Sci. 358(1440):1921–1934.
- Schneider P, Xhafa F. 2022. Anomaly Detection and Complex Event Processing over IoT Data Streams, Chapter 4 - Complex event processing: building complex events from simple, atomic events. Amsterdam, the Netherlands: Academic Press; p. 67–85.
- Schumm SA. 1985. Patterns of alluvial rivers. Annu Rev Earth Planet Sci. 13(1):5–27.
- Shahrood AJ, Menberu MW, Darabi H, Rahmati O, Rossi PM, Kløve B, Haghighi AT. 2020. RiMARS: an automated river morphodynamics analysis method based on remote sensing multispectral datasets. Sci Total Environ. 719:137336.
- Shrestha S, Imbulana N, Piman T, Chonwattana S, Ninsawat S, Babur M. 2020. Multimodelling approach to the assessment of climate change impacts on hydrology and river morphology in the Chindwin River Basin, Myanmar. Catena. 188:104464.
- Twidale CR. 2004. River patterns and their meaning. Earth Sci Rev. 67(3-4):159–218.
- Wang Y, Wu B, Zhong D. 2020. Adjustment in the main-channel geometry of the lower Yellow River before and after the operation of the Xiaolangdi Reservoir from 1986 to 2015. J Geogr Sci. 30(3):468–487.
- Xia HQ, Li DR, Zheng CY. 2011. A geographical event-based spatiotemporal data model and its application in land use. Sci Surv Mapping. 36(4):124–127.
- Xia J, Wang Y, Zhou M, Deng S, Li Z, Wang Z. 2021. Variations in channel centerline migration rate and intensity of a braided reach in the Lower Yellow River. Remote Sens. 13(9):1680.
- Xu H. 2006. Modification of normalised difference water index (NDWI) to enhance open water features in remotely sensed imagery. Int J Remote Sens. 27(14):3025–3033.
- Zhao Y, Zeng L, Wei Y, Liu J, Deng J, Deng Q, Tong K, Li J. 2020. An indicator system for assessing the impact of human activities on river structure. J Hydrol. 582:124547.
- Zheng K, Xie MH, Zhang JB, Xie J, Xia SH. 2022. A knowledge representation model based on the geographic spatiotemporal process. Int J Geographical Inf Sci. 36(4):674–691.