
 ?Mathematical formulae have been encoded as MathML and are displayed in this HTML version using MathJax in order to improve their display. Uncheck the box to turn MathJax off. This feature requires Javascript. Click on a formula to zoom.
Abstract
Understanding the negative effects of climate change and changes to land use/land cover on natural hazards is an important feature of sustainable development worldwide, as these phenomena are inextricably linked with natural hazards such as landslides. The contribution of this study is an attempt to develop a state-of-the-art method to assess the effects of climate change and changes in land use/land cover on landslide susceptibility in the Tra Khuc river basin in Vietnam. The method is based on machine learning and remote sensing algorithms, namely radial basis function neural networks–search and rescue optimization (RBFNN–SARO), radial basis function neural network–queuing search algorithm (RBFNN–QSA), radial basis function neural network–life choice-based optimizer (RBFNN–LCBO), radial basis function neural network–dragonfly optimization (RBFNN–DO). All proposed models performed well, with AUC value of >0.9. The RBFNN–QSA model performed best, with an AUC value of 0.98, followed by RBFNN–SARO (AUC = 0.97), RBFNN–LCBO (AUC = 0.95), RBFNN–DO (AUC = 0.93), and support vector machine (SVM; AUC = 0.92). The results show that both climate and land use/land cover change greatly in the future: Precipitation increases 18% by 2030 and 25.1% by 2050; the total production forest, protected forest and built-up area change considerably between 2010 and 2050. These changes influence landslide susceptibility: The area of high and very high landslide susceptibility decrease by approximately 100 and 300 km2 respectively in the study area from 2010 to 2050. The findings of this study can support decision-makers in formulating appropriate strategies to reduce damage from landslides, such as limiting construction in areas where future landslides are predicted. Although this study applies to a particular region of Vietnam, the findings can be applied in other mountainous regions around the world.
Introduction
Climate change and changes in land use/land cover (LULC) are two key ‘global changes’ and reflect the transformation from the natural to the artificial environment (Petrişor et al. Citation2020; Aouissi et al. Citation2021; Nguyen et al. Citation2022a). This process has significant effects on biodiversity (Nagendra et al. Citation2013; Seki et al. Citation2018), water resources (Gallart and Llorens Citation2003; Näschen et al. Citation2019), land and air resources (Braimoh and Vlek Citation2004), the climate system (Ojima et al. Citation1994), and particularly the intensity of natural hazards such as landslides (Pham et al. Citation2021b). Landslides cause approximately 1000 deaths per year worldwide. In Vietnam, two-thirds of the land is mountainous, and so the country regularly suffers from landslides. According to statistics from the Ministry of Agriculture and Development, from 2000 to 2015 there were roughly 250 flash floods and landslides, affecting 779 inhabitants and injuring 426 (Pham et al. Citation2020; Q-H Nguyen et al. Citation2021). Landslide research has thus been a priority among the local scientific community over recent decades and has featured prominently in discussions on sustainable development.
Changes in LULC are the result of several factors: natural demographic growth (Roose et al. Citation2013), migration, and economic and industrial development (Mottet and Roche Citation2009). Since its adoption of the Đổi Mới (renewal) policy in the 1980s, Vietnam has seen sustained urban growth as a result of relative economic liberalization, affecting most layers of society. The country has thus moved from a centralized and planned economy to a so-called socialist-oriented market economy (Nguyen et al. Citation2018). Economic development is accompanied by increased urbanization, with significant consequences for natural hazards, such as landslides, particularly in developing countries. Landslides are one of the world’s most dangerous and most frequently occurring natural hazards. In mountainous regions, they have caused significant damage to economies and human life (Ali et al. Citation2021; Al-Najjar and Pradhan Citation2021; Mandal et al. Citation2021). According to the World Bank, between 1995 and 2014, approximately 3.7 million km2 was affected by landslides, of which 820,000 km2 lay in areas marked as at high or very high risk of landslides. In the same period, 11,689 deaths and 163,658 injuries were recorded (Nguyen et al. Citation2019; Ali et al. Citation2021). With its mountainous territory, Vietnam is considered especially susceptible to landslides. According to the Meteorological and Hydrological Administration of Vietnam, approximately 300 flash floods and landslides occurred from 2000 to 2020, killing 943 people and causing billions of dollars in damage, particularly in the Central region (Q-H Nguyen et al. Citation2021).
A landslide is defined as the downward movement of a mass of rock, soil, or debris. The movement occurs suddenly in sloping areas and is triggered during heavy rain conditions and earthquakes, especially following land-use changes (Chen and Chen Citation2021). Therefore planning that takes into account the impacts of changes in LULC and climate can reduce the risk and consequences of landslides.
Previous studies have pointed out that the factors causing landslide-related problems can be divided into two main categories: geological and environmental. Geological factors include lithology, elevation, slope, aspect, and curvature and are considered static, i.e. they are relatively stable. Environmental factors, including LULC and distance to road are dynamic factors because they are change each year; this is particularly the case with LULC (Ali et al. Citation2021; Chen and Chen Citation2021; Pham et al. Citation2021a). Different types of LULC have different consequences on landslides. Previous studies have indicated that human activity can increase landslide frequency and intensity, particularly in mountainous regions (Reichenbach et al. Citation2014). Extensive deforestation can affect the rate of erosion caused by heavy rains and hence cause landslides. Changes in LULC establish new relationships with natural elements and influence the stability of slope and structure of soil (Pham et al. Citation2021b). On the other hand, some studies have highlighted the effects of climate change, particularly the impact of precipitation on the frequency and intensity of landslides/landslide hazard (Jakob and Lambert Citation2009; Crozier Citation2010; Rianna et al. Citation2014). In recent years, researchers have shown how important LULC and climate are in increasing the damage caused by landslides.
Previous studies have assessed the effects of climate change and changes to LULC on landslide frequency and intensity (Pham et al. Citation2021b; Hürlimann et al. Citation2022). Karsli et al. (Citation2009) assessed the effects of land-cover change on landslide frequency in the town of Ardesen in Turkey’s Rize province, using aerial photographs and GIS. The results showed that an increase in the number of buildings was the main cause of worsening landslides. Reichenbach et al. (Citation2014) assessed the effects of land-cover change on landslide susceptibility. The results showed how deforestation was one of the main causes of increased flood susceptibility in the Briga catchment of Italy. L Chen et al. (Citation2019) examined the effects of land-cover change from 1992 to 2013 on flood susceptibility in Zhushan Town, Xuan’en County, China using the logistic regression model. The results indicated that human activity, such as grassland surface transformation and deforestation, were two causes of increased landslide susceptibility. Liu et al. (Citation2021) monitored the effects of land-cover change from 1980 to 2019 in Lixian County, China using the random forest (RF) model, demonstrating how landslide susceptibility increased in regions used for agriculture and construction (Liu et al. Citation2021). Rabby et al. (Citation2022) examined the effects of land-cover change scenarios from 2010 to 2028 on landslide susceptibility in Rangamati district, Bangladesh by applying RF. The authors warned that future changes in inhabitants’ occupations may lead to increased landslide susceptibility. Similarly, Pham et al. (Citation2021b) studied the influences of changes of LULC and climate in Markazi Province in Iran using boosted tree (BT), RF, and extremely randomized tree (ERT) models. The results showed that the changes had had significant impacts on landslide susceptibility.
The methods and techniques for assessing the effects of climate change and LULC can be divided into two main groups: qualitative and quantitative. The qualitative approach comprises geomorphological methodologies and simple expert knowledge in assessing slope failure with precision (Achour et al. Citation2017). Although these methods have proven effective, they are very expensive, time consuming, and not suitable for application over large areas, because they require detailed geomorphological and geological information. The quantitative approach focuses on expressions and algorithms such as statistical models and machine learning. Currently, statistical models are popular. They focus on knowledge of the physical processes that drive the landslide phenomenon, such as spatial change in slope structure, elevation, and soil composition. Many studies also use remote sensing and GIS, combined with statistical or machine learning methods such as frequency ratio (Lee and Pradhan Citation2007; Shu et al. Citation2021), logistic regression (Sun et al. Citation2021), fuzzy logic (Pourghasemi et al. Citation2012; Abdı et al. Citation2021). Although these methods have achieved promising results in evaluating the effects of LULC and climate on landslide susceptibility, due to the complexity and non-linear characteristics of the landslide phenomenon, statistical models are limited (Li et al. Citation2021; Q-H Nguyen et al. Citation2021; Mehrabi Citation2022). In addition, several studies have pointed out that the predictive ability of statistical models is relatively weak and these methods cannot accurately analyze the complex relationships between conditioning factors and landslide locations.
Due to its very high accuracy and prediction capability, in the last few years, machine learning has received worldwide scientific attention and has become an increasingly important component in landslide spatial analysis. Examples include adaboost (BT Pham et al. Citation2021), multiboost (Pham et al. Citation2019a), bagging (Chen et al. Citation2018b), Kernel logistic regression (W. Chen et al. Citation2019), RF (Youssef et al. Citation2016; X Zhou et al. Citation2021), support vector machine (Pourghasemi et al. Citation2013; Hong et al. Citation2016), and artificial neural networks (ANN; Lee et al. Citation2003; Gameiro et al. Citation2021). The advantage of this method is their objective statistical capabilities, the ability to accurately quantitatively analyze the causes of landslides, and their potential for continuous updating. Machine learning models can also effectively present the complex patterns that are hidden in the huge dataset (Chen and Chen Citation2021; S Zhou et al. Citation2021). Tyagi et al. (Citation2022) used ANN to assess the effects of LULC in 2010, 2015, and 2020 on landslide susceptibility in the Tehri region of India. Rabby et al. (Citation2022) evaluated the effects of LULC in 2018 and 2028 on flood susceptibility in the Rangamati municipality of Bangladesh by applying ANN-based cellular automata. Liu et al. (Citation2021) applied the RF model to quantify the influence LULC in 1980, 2000, and 2018 on landslide susceptibility in Longnan City in China’s Gansu province. The methods and models mentioned above have a high predictive ability, but the performance of the model depends on the nature, scale, and availability of data from the study area. A model with good performance can play an important role in the sustainable development of a territory by determining the regions with high landslide susceptibility; however, selecting the appropriate model from hundreds of methods is a challenge for scientists, because no methods have yet been developed that can reliably outperform others. Studies on the relationship between landslide frequency and changes in LULC and climate are particularly rare. Also, such studies generally assess either the effects of LULC change or the effects of climate change; studies that examine both are still rare. Currently, there are only two such studies. The first Pham et al. (Citation2021b) used ERT, BT, and RF to assess the effects of LULC and climate change in 1990, 2020, and 2050 on landslide susceptibility in the Markazi province of Iran. Chowdhuri et al. (Citation2021) quantified the influence of land cover and climate change in 2040, 2060, 2080, and 2100 on the landslide susceptibility in the Upper Rangit River basin, Sikkim, India using binary logistic regression (BLR). These two studies concentrated on South and West Asia, while Southeast Asian countries, where climate change and LULC strongly influence landslide susceptibility, have not yet seen such studies.
HD Nguyen et al. (Citation2021) pointed out that natural hazard harm reduction strategies are most effective when continuously evaluated (from past to future). L. Chen et al. (Citation2019) highlighted that landslide damage reduction strategies are most effective when evaluated in relation to land cover and climate change. Roccati et al. (Citation2021) indicated that understanding the impacts of anthropogenic activity on landslide susceptibility is an important task in constructing appropriate strategies or policies to reduce landslide-related damage (Roccati et al. Citation2021). This study aims to fill some of the gaps in research by developing a novel methodology to assess the effects of changes in LULC and climate on landslides in the Tra Khuc river basin, Vietnam.
The objectives of this study are i) the prediction of precipitation in 2030 and 2050 using scenario 8.5, ii) the prediction of LULC in 2030 and 2050 by applying the CA-Markov model, and iii) landslide susceptibility prediction based on changes in LULC and climate using the machine learning algorithms RBFNN–SARO, RBFNN–QSA, RBFNN–LCBO, and RBFNN–DO. These are the most popular algorithms and are superior to other metaheuristic algorithms in terms of accuracy. In addition, they can balance the process of exploration and exploitation and therefore have the ability to converge faster than other models (Zhang et al. Citation2018; Rahman and Rashid Citation2019; Shabani et al. Citation2019; Khatri et al. Citation2020). These algorithms have already been successful in fields such as economic and transport.
Our initial hypothesis is that landslides in the study area have increased due to changes in LULC and climate, and that the models proposed in this study would outperform the reference model (namely SVM, a popular algorithm often used as a reference model (Yao et al. Citation2008; Chen et al. Citation2016). Although this study assessed landslide susceptibility in a particular watershed in Vietnam, the approach can be applied to any region where natural hazards, particularly landslides, are becoming more dangerous in the context of changes in LULC and climate.
Materials and data
Study area
The Tra Khuc River basin is located in the Central region of Vietnam, between 108°8'21′' and 108°56'37′' East and between 14°33'33′' and 15°15'35′' North (). The river itself is over 160 km long and the basin covers 3,703 km2 and is located east of the Truong Son mountain range. The topography is very complex, with an average elevation of 558 m and a slope of approximately 18.5%. It is divided into four main types of terrain: sandy coastal areas, plains, mountains, and highlands. The sandy zone accounts for about 3% of the area of the basin and has an elevation of 0–2 m. The plains represent about 21% and have an altitude of 10–20 m. The mountainous zone accounts for about 70% of the area of the basin. It is the eastern slope of the Truong Son Range and average altitude there is 500–700 m, although many peaks exceed 1000 m, including Hon Ba at 1146 m. The highlands are at elevations of 900–1600 m and include the Kong Plong and Kong Na Hung plateaus.
The climate of the study area has characteristics typical of the Central coastal region, with two distinct seasons. The dry season extends from February to August, and the rainy season September to January. The study area has an average rainfall of 2962 mm/year, with 70%–75% of annual rainfall concentrated in the rainy season. About 70% of the study area is covered in forest; however, in recent years, forest resources have been seriously degraded, both in terms of area and quality, due to agricultural development and the construction of dams. Most forest vegetation is sparse and consists largely of shrubs. The reduction in forested area leads to the instability of the slope, which contributes to the risk of landslides.
The study area is located in an area with very complex natural conditions. Landslides are tending to increase in both scale and frequency due to climate change and land use, causing serious consequences for people and economy. Many sizable sections of road have been destroyed in recent years, such as the national Highway 24 and provincial Road 622. In 2021, a landslide affected more than two thousand inhabitants and caused great damage to the economy. However, at present, there remain few studies on the impact of climate change and land use on landslides in the study area. Therefore, the results of this study are important in assisting local policymakers to developing sound strategies to reduce the human and economic consequences of landslides.
Geospatial Database
Landslide inventory
To construct a landslide susceptibility map, it is generally necessary to have two sets of data: inventory and conditioning factors (Pourghasemi et al. Citation2021). The construction of landslide models is necessary to fully understand the relationships between the locations of landslides and geo-environmental, climatic, hydrological, and anthropogenic conditions (Ali et al. Citation2021; Al-Najjar and Pradhan Citation2021; Mandal et al. Citation2021). The Tra Khuc River watershed is often affected by landslides following typhoons and heavy rain. Most landslides are shallow and occur on granite.
shows two shallow landslides that occurred in 2021 in the study area. The main reason in this case was extreme precipitation, a typhoon, and the topographical characteristics of the mountain.
Figure 1. The location of the Tra Khuc river basin in Vietnam.
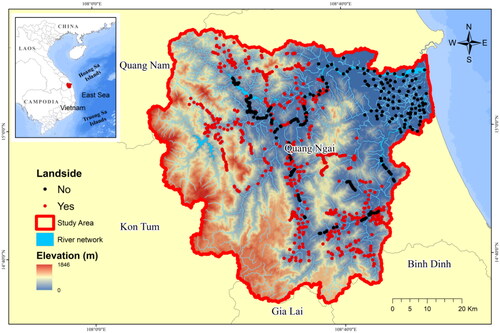
Figure 2. Shallow landslide occurring in Tra Khuc basin in 2021.
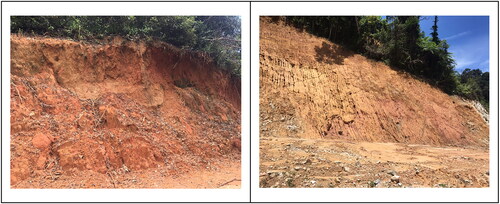
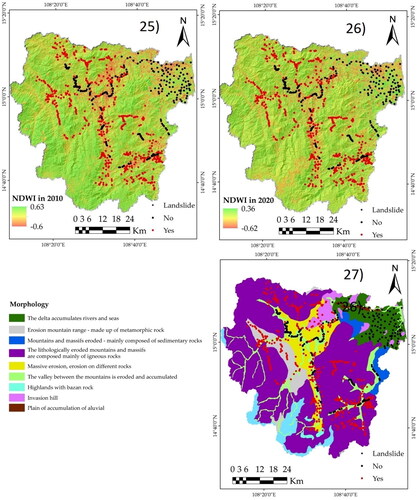
In this study, landslide locations were detected using high-resolution satellite images. In October of 2020 and 2021, Quang Ngai Province was hit by unprecedented precipitation, causing large landslides. Four Sentinel 2A images (before and after each landslide) were collected to detect landslide locations based on computing the normalized difference vegetation index (NDVI) using Ecognition software. These data are available at https://scihub.copernicus.eu/dhus/#/home. NDVI is one of the most popular indices for monitoring vegetation development, so it is also used to detect landslides. After the construction of the NDVI map, the RF algorithm was used to classify this map into two categories: vegetation and non-vegetation, and the map overlay technique was used to determine the landslide-affected regions. In 2021, a field mission was carried out to verify the landslide locations extracted from the satellite imagery and collect new landslide locations in the study area. The affected areas ranged in size from between a few cubic meters to several hundreds.
As the landslide susceptibility models in this study are binary classification models, the dataset was necessarily divided into two groups: landslide and non-landslide. In the literature there are currently no established methods of selecting non-landslide points, so in this study, 365 non-landslide points were randomly selected in low-elevation and low-slope regions, based on historical information, topographic maps, and data from the field mission. Non-landslide areas were mainly concentrated in the eastern region of the study area, which is untouched by landslides.
1044 points (679 landslide points and 365 points non-landslide) were finally detected to build the landslide susceptibility model. These data were randomly separated into two parts through coding on the Python platform: 70% of the data to train the models and 30% to validate. It should be noted that several different rates (90/10, 80/20, and 60/40%) were also tested, but the most accurate was 70/30%. This has also been substantiated in several previous studies (Pham et al. Citation2021a; Saha et al. Citation2021).
Conditioning factors
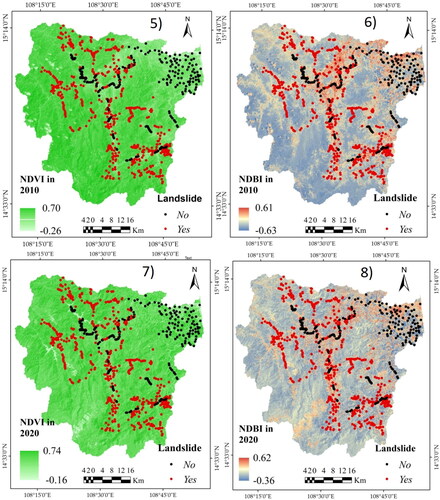
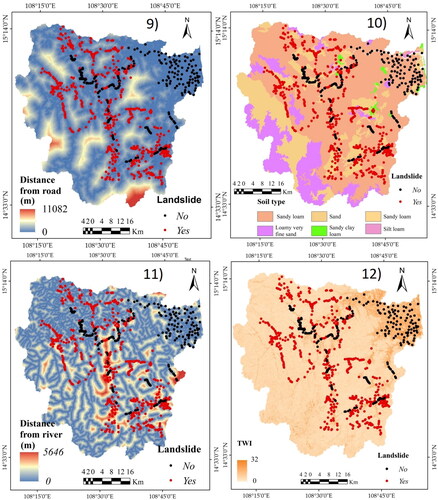
The selection of conditioning factors determines the accuracy of the prediction model (Chen and Chen Citation2021), although there are no universal guides for selecting conditioning factors, because in each case the factors depend on the availability of data; geo-environmental, climatic, and hydrological conditions; anthropogenic activities; and nature of the landslide phenomenon in the study area (Ali et al. Citation2021). In this study, 14 conditioning factors were selected to build the landslide susceptibility model, namely elevation, aspect, curvature, slope, NDVI, normalized difference built-up index (NDBI), normalized difference water index (NDWI), topographic wetness index (TWI), rainfall, distance to river, distance to road, distance to settlement, soil, and LULC ( and ). All thematic layers were processed in GIS using the WGS_1984_UTM_Zone_48N projection system.
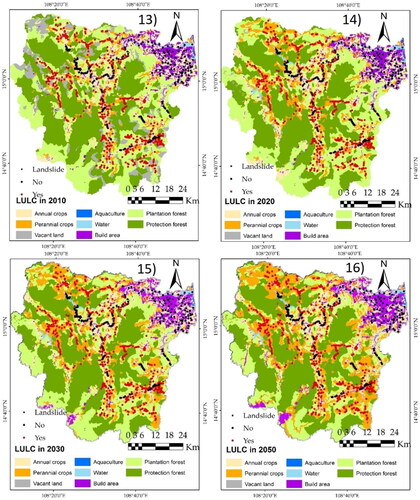
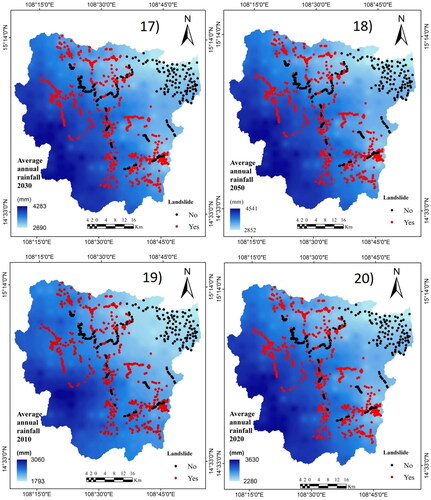
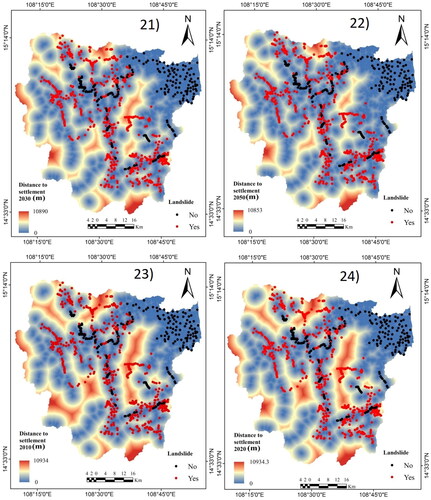
Figure 3. Landslide conditioning factors in the Tra Khuc river basin in Quang Ngai Province: 1) elevation, 2) curvature, 3) aspect, 4) slope, 5) NDVI in 2010, 6) NDBI in 2010, 7) NDVI in 2020, 8) NDBI in 2020, 9) distance from road, 10) soil type, 11) distance from river, 12) TWI, 13) LULC in 2010, 14) LULC in 2020, 15) LULC in 2030, 16) LULC in 2050, 17) average annual rainfall in 2030, 18) average annual rainfall in 2050, 19) average annual rainfall in 2010, 20) average annual rainfall in 2020, 21) distance to settlement in 2030, 22) distance to settlement in 2050, 23) distance to settlement in 2010, 24) distance to settlement in 2020, 25) NDWI in 2010, 26) NDWI in 2020, 27) morphology.
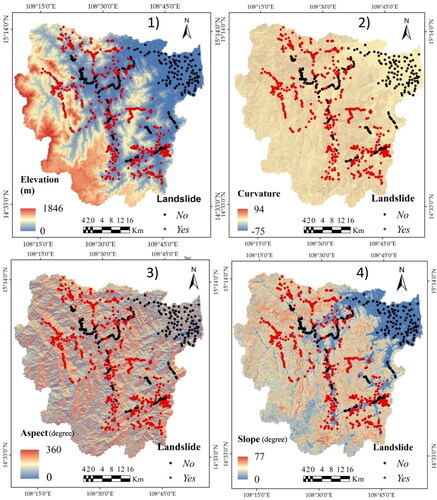
Elevation is a topographic factor that plays an essential role in landslide susceptibility modeling, because it influences slope instability. It is widely used in landslide susceptibility assessment studies (Devara et al. Citation2021; Dias et al. Citation2021). The elevation values range from 0 to 1460 m in the study area.
Slope was selected because it influences landslides both directly and indirectly, in terms of wind direction, precipitation value, surface runoff, and soil moisture. (Steger et al. Citation2021; Youssef and Pourghasemi Citation2021). The slope value in the study area ranges from 0° to 77°.
Curvature is an essential factor in the computation of the probability of landslides, because it directly influences water runoff and water accumulation on the slope (Ermini et al. Citation2005; Chen and Zhang Citation2021). In the study area, the curvature value ranges from −75 to 94.
Aspect is also a key factor, as it influences water evaporation by controlling soil moisture (Chauhan et al. Citation2010; Vojteková and Vojtek Citation2020). In the study area, the aspect ranges from 0° to 360°.
NDVI reflects the density of vegetation in the study area and has a role in regulating surface runoff and increasing soil cohesion in the petrographic mass (Pradhan et al. Citation2010; Avtar et al. Citation2011). In general, the NDVI value ranges from −1 to 1, and the higher the NDVI value, the higher the canopy density. In the study area, the NDVI ranges from −0.26 to 0.70 in 2010 and from −0.16 to 0.74 in 2020.
NDBI is used because it presents information about the distribution of infrastructure on landslide surfaces and indirectly influences soil resistance (Chang et al. Citation2020; Huang et al. Citation2020). In the study area, the NDBI ranged from −0.63 to 0.61 in 2010 and from −0.36 to 0.62 in 2020.
TWI was selected because it reflects the effects of topography on the capacity of soil saturation and infiltration. In addition, it indirectly influences the process of surface flow generation (Chen et al. Citation2017; Li et al. Citation2019). In the study area, the aspect ranges from 0–32.
NDWI describes surface moisture characteristics (Xu et al. Citation2015). When soil moisture is higher, probability of landslide occurrence is higher. In this study, the value of NDWI ranged from −0.6 to 0.64 in 2010 and from −0.62 to 0.36 in 2020.
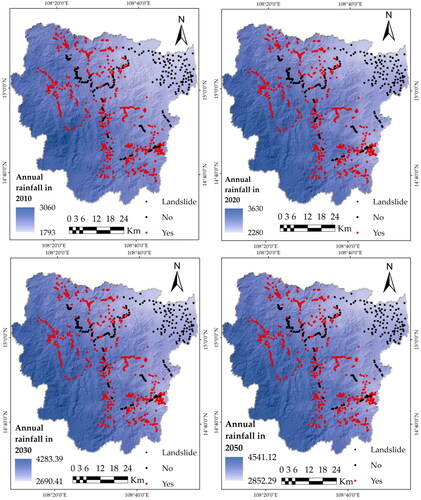
Rainfall is considered a trigger for the landslide mechanism, because it increases soil moisture and reduces soil consistency, all of these leading to landslide (Clerici et al. Citation2002). The study area is one of the regions with the highest precipitation in Vietnam, ranging from 1793 mm to 3060 mm per year in 2010 and from 2280 mm to 3630 mm per year in 2020.
Distance to river is an important hydrological factor on landslide occurrence because it controls slope stability and influences soil moisture (He et al. Citation2012; Wu et al. Citation2016). As mentioned below, the study area has a high hydrological network density with 1.35 km/km2. In this study, the value of distance to river ranges from 0 to 5646 m.
Distance to road and distance to settlement are two important anthropogenic factors. The construction of infrastructure in mountainous areas requires techniques such as cutting the slope, which leads to the change of initial geological characteristics and impacts on ground stability (Yalcin et al. Citation2011; Guo et al. Citation2015). In this study, the value of distance to road ranges from 0 to 11,082 m.
LULC represents human activity such as the building of infrastructure. Such activity has an important influence on the stability of the soil and the process of generating surface water flow (Xiao et al. Citation2019; Ngo et al. Citation2021). This study divided land use types into seven main categories: annual crops, perennial crops, plantation forest, aquaculture, open water, rural, and protected forest.
Soil type has crucial effects on natural hazards like landslides because it influences the physical characteristics of the soil, such as resistance, durability, and permeability, as well as the degree of weathering (Henriques et al. Citation2015; Youssef and Pourghasemi Citation2021).
Geological was selected to construct the landslide susceptibility model in this study because each formation exhibits different soil structure and permeability which influences the landslide (Moharrami et al. Citation2020; Ngo et al. Citation2021).
Methodology
Radial basis function neural network (RBFNN)
RBFNN is an artificial neural network that uses radial basis functions as activation functions (Orr Citation1996). They are connectionist models that are simple to implement, quite intelligible, and widely used for regression and classification. In this network, there are three layers: the input layer, the hidden layer composed of core functions, and the output layer. However, networks of radial basis functions often also include a non-linear activation function. Output weights can be trained using gradient descent. The input layer provides the input vector value for each unit in the hidden layer. In this study, the input layer included 1824 landslide and non-landslide points and 14 conditioning factors. Each neuron in the hidden layer contains a Gaussian that performs a kernel function. These neurons compute the distance from the input to their nuclei and respond by activating in proportion to this distance (Pham et al. Citation2018; Huang et al. Citation2022). The output of the network is simply a linear combination of the outputs of RBFNN neurons multiplied by the weight of their respective connections. The model produces landslide and non-landslide predictions. RBFNN has the advantage of solving non-linearity problems, thanks to a set of radial basis linear combinations which can train itself quickly (Chang and Chen Citation2003). This algorithm has been widely applied to solve complex environment-related problems, such as in flood and landslide susceptibility modeling. In this study, RBFNN was used to assess the effects of changing LULC and climate on landslide susceptibility.
Search and rescue optimization (SARO)
SARO was first introduced by Shabani et al. (Citation2019) and is inspired by human search and rescue operations. Searching is a systematic operation that uses available people and facilities to determine the locations of people in distress, while rescue is the act of bringing people in distress to safety. Humans can determine traces of clues relating to the whereabouts of lost people thanks to training they have received. The clues found have different values and provide different information about the subject. Members in the search team evaluate clues based on their training and provide clue information via communication equipment to others in the team. This process is represented by the following equation:
where M is the memory position matrix, X is the humans’ position matrix, while XN1 is the 1st dimension position for the Nth human.
Finally, team members search for all the information. Searches are divided into two main phases: social and individual. In the social phase, the members in the team seek solutions based on the location of the information found and quality of this information. This phase is represented by the following equation:
where X’i,j is the new position of the jth dimension for the ith human. While Ck,j is the position of jth dimension for the kth found clue.
In the individual search phase, searches are carried out independent of locations and information found by others. This phase is represented by the following equation:
More details on SAR are provided by Shabani et al. (Citation2019).
Queuing search algorithm (QSA)
QSA is a human-based metaheuristic algorithm first proposed in by Zhang et al. (Citation2018). It mimics the typical behavior and interactions of humans queuing, such as in a shop or waiting for public transport. The client group represents the search agents, and employees drive these search agents. The QSA algorithm works on the basis of five main principles (Zhang et al. Citation2018): i) The number of customers is limited and divided into three rows, and they are used to find the optimal solution in the QSA algorithm; ii) some procedures must be updated for the customer, while others may be optional; iii) better staff will serve more customers in a given period therefore, after each iteration, the number of individuals is evaluated based on each individual’s ability, and best individuals are used to determine local search regions; iv) individuals in the QSA are updated based on this individual or best kernels; (v) each customer’s services may be impacted by the customer, employees, or other customers. In QSA, exploration and exploitation was comprised three processes.
Business Process 1 was calculated by the following equation:
where N is the number of search agents and T1n is the fitness value for selected staff.
Business Process 2 was calculated by the following equation:
Xr1 and Xr2 are the states of two randomly selected clients. A is the staff for each tail considered, Cv is the level of confusion.
Business Process 3 was calculated using the following:
The details of the QSA algorithm are detailed in Zhang et al. (Citation2018). The algorithm has already been applied in fields such as engineering and economics.
Life choice-based optimization (LCBO)
LCBO is an optimization algorithm developed by Khatri et al. (Citation2020). It belongs to the class of human-based metaheuristic algorithms and simulates human decision-making. The deployment of LCBO consists of three steps: i) learning from the common best group, ii) identifying the next best person, and iii) reviewing mistakes. The first step is represented by the function below:
where k varies from 1 to n, and n equals the population’s square root. This step allows each person to learn from the best person in their group.
After learning from the best person, humans continue to learn more to reach future goals (Step ii). This process is simulated by the functions below:
where function f1 has a value of between 0 and 1 and f2 is between 1 and 0. r1, which equals 2.23, is a constant number. The X function shows the search agent’s best position, which was obtained from the previous round.
If the learning process encounters any problems, humans will review their actions to solve by evaluating or using alternate methods. This is Step iii and is demonstrated by the function:
The ability of LCBO was proven by benchmark testing for scalability and convergence with seven different techniques: ant lion optimization, particle swarm optimization, bat algorithm, cuckoo search algorithm, genetic algorithm, symbiotic organisms search, and flower pollination algorithm. LCBO is a novel optimization algorithm that has so far only been applied in a small number of studies in fields such as computer science (Gupta et al. Citation2022; Marimuthu et al. Citation2022) and medicine (Oyelade and Ezugwu Citation2022). Currently, we are not aware of papers relating to our field of study where LCBO has been used.
Dragonfly optimization (DO)
DO is metaheuristic optimization, first proposed by Mirjalili (Citation2016) and inspired by the hunting behavior of small dragonflies. There are over 3000 different species of dragonflies and their life cycle consists of two main stages: nymph and adult. DO simulates the natural foraging movements of dragonflies, consisting of exploitation and exploration phases. During the exploitation phase, a large number of dragonflies move in the same direction over long distances and scatter their predators. In the exploration phase, dragonflies form small groups and move around a small space in search of prey. DO works according to three main principles: separation, association, and cohesion. The purpose of separation is to avoid collisions with neighbors during the foraging activity. The separation can be computed by this equation:
where X is the position for the current individual and Xj is the position for the jth dragonfly.
Alignment relates to the adjusting of speed; from there, items can match neighboring items. It can be computed by:
where Ai is the alignment movement of individual i and V is the speed of dragonfly jth.
Cohesion is the tilt of the elements relative to the center of the swarm (Mirjalili et al. Citation2016). This process is calculated by the following equation:
where Ci is the cohesion for the ith individual, N is the neighborhood size, Xj is the position of jth dragonfly, while X is the position of the current dragonfly individual.
In the DO algorithm, the two complementary solutions to survival are moving around the prey and avoiding the enemy. When the dragonflies are heading towards their prey, at the same time the dragonflies must avoid the enemy (Aghelpour et al. Citation2021).
Support vector machine (SVM)
SVM is a supervised machine learning algorithm proposed by Vapnik et al. (Citation1995). This algorithm is widely used to solve classification problems. During the classification process, the SVM algorithm creates a hyperplane to divide the space into different domains, and each domain contains a type of data. In other words, SVM aims to convert two-dimensional data to a higher dimensional space and divide geographic objects into different groups (Yao et al. Citation2008; Pradhan Citation2013). The performance of SVM depends on the select parameters such as C and gamma. C is the main parameter of SVM and is used for the correct classification of the training samples to limit the maximization margin of the decision function. Gamma determines the number of samples required to build the hyperplane. With small gamma values, samples located far from the median will be used in the computation of the median. Normally, the SVM model can be improved by setting the gamma value higher and the C value lower. In this study, the value of C was 0.8, while the value of gamma was 0.1.
Prediction of land-use change in 2030 and 2050
In this study, land use in 2030 and 2050 was predicted using Land Change Modeler (LCM) in Terrset software. LCM works by quantifying historical changes in LULC and using the rate of those changes to predict LULC in the future, using Markov chain analysis. These processes were divided into five main steps (Khoshnood Motlagh et al. Citation2021; Leta et al. Citation2021): i) transition process analysis, ii) transition potential analysis, ii) LULC model construction, iv) submodel selection, and v) model validation. Land use in 2010 and 2020 were used as input data to the LCM model to predict land use in 2030 and 2050 ().
Figure 4. The methodology for Land use prediction.
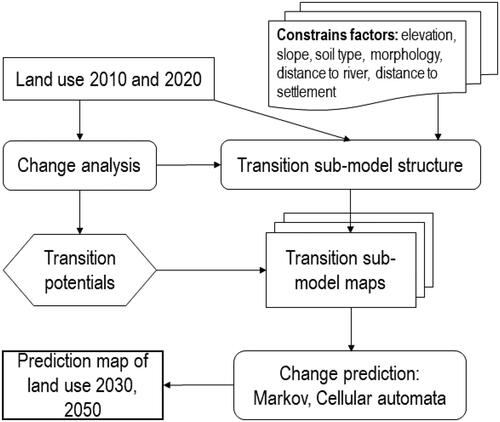
Alongside the maps from 2010 and 2020, various explanatory factors have been selected, which have been categorized into two main groups: accessibility and suitability (Garcia-Alvarez et al. Citation2019; HD Nguyen et al. Citation2021, Citation2022a). Accessibility comprises distance to river, distance to road, and distance to settlement. Suitability is described by elevation, slope, soil type, and morphology. These factors have been used in various previous studies. The distribution of each explanatory factor was measured by Cramer’s V value and the precision generated when constructing the transition position. The transition potential of each used was modeled using the multilayer perceptron (MLP) model. The accuracy of the LCM model is evaluated using the kappa index.
Prediction of climate change in 2030 and 2050
According to the fifth report from the IPCC, the four radiative forcing scenarios – RCP2.6, RCP4.5, RCP6.0, and RCP8.5 – have been confirmed. These scenarios were constructed from respective radiative forcings of 2.6, 4.5, 6.0, and 8.5 Wm−2. These scenarios represent different economic models that reflect greenhouse gas concentrations (Pham et al. Citation2021b). In this study, the RCP8.5 climate change scenario – which corresponds to a global temperature increase of approximately 1 °C by the end of the twenty first century – was selected. In the case of Vietnam, this would lead to precipitation in the Tra Khuc river basin increasing by 18% by 2030 and 25.1% by 2050 compared to the reference period (1986–2005). Precipitation in 2030 and 2050 was used as the proposed model input to assess the effects of LULC and climate change on landslide susceptibility.
Accuracy assessment
Model validation and performance evaluation are the two main steps of using the machine learning model. The goal of using training data is to reflect the fit of the model; validation data is used to objectively evaluate the fit of the model (Shahzad et al. Citation2022). The statistical indices receiver operating curve (ROC), AUC, RMSE, and mean absolute error (MEA) help to extract valuable information: i) quantitative assessment of the model’s prediction ability; ii) determination of which prediction methods yield the best predictions; iii) comparison of the prediction ability between models; iv) evaluation of the predictive ability of models to classify regions of high and very high landslide susceptibility, and regions safest from landslides; and v) evaluation of the effects of change in LULC and climate on landslide susceptibility. This knowledge is very important and can support decision-makers and planners in building appropriate strategies and policies to reduce the damage associated with future landslides.
The ROC curve is plotted by the true positive rate on the Y axis and false positive rate on the X axis. The area under the ROC curve also presents the model’s overall performance. The value of AUC varies from 0 to 1 and the closer the AUC value is to 1, the more accurate the model (Chen et al. Citation2018a; Fang et al. Citation2020).
where TP and TN are the number of properly classified landslide and non-landslide pixels. P and N are the landslide and non-landslide pixel count.
RMSE and MAE are two popular statistical indices for analyzing landslide susceptibility model performance. They measure the errors between the prediction value and the observation value (Pham et al. Citation2019b; Nguyen et al. Citation2020; Pham et al. Citation2020), as in following equation:
where m is the number of samples, Yiprediction is the prediction value at station i, and Yiobserved is the observed value at station i.
In this study, kappa was used to evaluate the precision of the land-use prediction model in 2030 and 2050. Cohen’s kappa coefficient is a statistic that allows to evaluate the similarity between observed precision and predicted precision (Chang et al. Citation2021). It is calculated by the following equation:
where Pp is the observed consensus value among the evaluators. P exp is the assumptive probability of consensus.
Data treatment steps
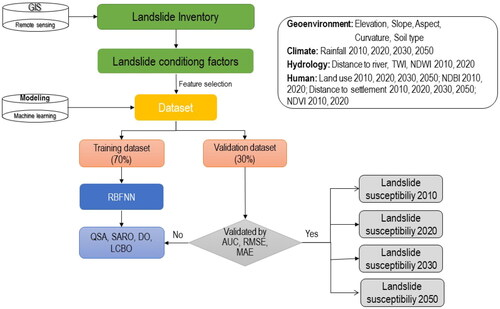
The methodology was split into four main stages: data collection and processing, building the models, model evaluation, and evaluation of the effects of changes in LULC and climate on landslide susceptibility ().
Figure 5. Flowchart of landslide susceptibility mapping.
Data collection and processing
The data in this study include 1854 landslide points and 20 conditioning factors, from 2010 and 2050. Data was collected from sources such as satellite images, Vietnam’s Ministry of Natural Resources and Environment, Quang Ngai Department of Natural Resources and Environment, and our field mission.
For the machine learning model, the performance of the classifier model depends on the selection appropriate input variables. The type of input data also greatly affects the accuracy of classification model, because each type of algorithm has a particular structure and is suitable for a particular data type. Typically, previous studies have normalized data in one of five ways: nominal, ordinal, ratio, min-max normalization, or interval. In this study, the min-max normalization method produced the most accurate result of the five. Normalization of input data assumes that the initial values of all data classes do not change; however, the input database has been normalized over similar ranges.
The max-min normalization was performed by dividing the data into two parts: 70% of the data was used to build the proposed models, and the remaining 30% was used to validate the models. These rates have been shown to be efficient in several previous studies.
Building the models
Four optimization algorithms were used to optimize the parameters of the RBFNN, namely QSA, SARO, DO, and LCBO. RBFNN is characterized by three layers: input, hidden, and output. This study used 1854 landslide and non-landslide points and 20 conditioning factors from 2010 and 2020 as the model input data. The output layer includes two classes: landslide and non-landslide. The most difficult problem is to determine the number of neurons in the hidden layer. This process includes two steps; the first is to initialize the parameters of the RBFNN algorithm using the trial-and-error method. The second is to optimize the parameters of RBFNN using QSA, SARO, DO, and LCBO. Optimization algorithms can solve local optimization problems and improve RBFNN's global search capability. The four optimization algorithms were used to compute the weights of RBFNN. For this topology, the neural network initialization parameters included 239 weight values. The objective of the four proposed algorithms was to decrease the RMSE values. For each model, the 239 values were determined by the structure of each algorithm, such as number of customers in QSA, locations of distressed persons in SARO, number of dragonflies in DO, and life cycle of a human in LCBO. Details of the RBFNN parameters are presented in .
Table 1. Source of the dataset.
Table 2. The parameters of RBFNN optimized by QSA, SARO, DO, and LCBO.
Model validation
The performance of the training model was evaluated using the validation data, through various statistical indices, namely RMSE, AUC, and MEA. In this study, a separate group with 547 landslide and non-landslide points was used to validate the models.
Evaluation of the effects of changes in LULC and climate on landslide susceptibility
After validation, the four proposed models were used to construct maps of landslide susceptibility for 2010 and 2020. This process was carried out by feeding the proposed models with the study area and value of the conditioning factors for 2010 and 2050. The output value was the landslide susceptibility index, which ranges from 0 to 1. These indices were divided into five categories (using the natural break method): very low, low, moderate, high, and very high. This method is based on Jenk’s optimization equation to reduce the variance within classes and maximize the variance between classes (Mehrabi et al. Citation2020; Moayedi et al. Citation2020; Mehrabi and Moayedi Citation2021; Moayedi et al. Citation2021). Finally, the landslide maps for 2010 and 2050 were compared to assess the effects of land cover and climate change on landslide susceptibility
Results
Prediction of LULC changes between 2010 and 2050
and present LULC in 2010, 2020, 2030, and 2050. The results show that the forested area of the Tra Khuc river basin increased slightly, with the area of production forest increasing by nearly 120 km2 from 2010 to 2020 and decreasing by approximately 80 km2 from 2020 to 2030 and 500 km2 from 2030 to 2050. Protected forest decreased by 30 km2 between 2010 and 2020 but then increases by 120 km2 between 2020 and 2030 and again, by 130 km2, by 2050. The short-lived decreases in both protected and production forest were mainly due to the transformation into land used for perennial crops. The increase is mainly due to local greening programs for bare land and barren hills. The change is concentrated in mountainous areas in the north and south of the study area.
Figure 6. LULC in 2010 and 2020 in Tra Khuc River basin, Vietnam.
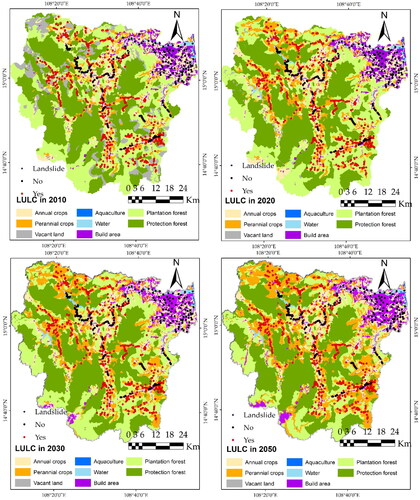
Table 3. Land use change from 2010 to 2020 in study area.
With regard to the changes in the total area of agricultural land, in 2050, the total area of agricultural production land is set to grow by 766.13 km2 compared to 2010 (a 17% increase), while the area of perennial crops increases to 757.56 km2. This is the major land-use change between 2010 and 2050, mainly concentrated in the foothills and valleys in the northwestern and central parts of the study area. The field survey results show that the reason for this change is that perennial crops bring higher economic value than production forest. Results of analysis of land-use change also show that the type of land used for annual crops decreases by more than 20 km2, mainly due to conversion into perennial crops and built-up urban and rural area. The total area of non-agricultural land sees little change. In 2050, the area of non-agricultural land will have grown by just 100 km2 compared to the 2010 figure, representing an increase of just 2%.
Predicting land-use changes using CA-Markov showed that, compared to the present, there will be a large increase in the area of plantation forest and perennial crops by 2050. These changes can lead to landslides in the Tra Khuc River basin.
Prediction of rainfall change between 2010 and 2050
shows the annual precipitation in the Tra Khuc catchment in 2010, 2020, 2030, and 2050. In 2010, annual precipitation ranged from 1793 to 3060 mm. The maximum increased to 3630 mm by 2020. According to RCP8.5, precipitation in 2030 will increase by 18% compared to the 2020 figure, to 2690–4283 mm, and by 2050 the increase on 2020 will be 25.1%, with a range of 2852–4541 mm. Precipitation is heavy in the western mountainous region and tends to decrease toward the coastal region because the region to the west has been influenced by the conversion phenomenon, a consequence of the topography of the Annamite range. This phenomenon is characteristic of the Central region of Vietnam. The increases in precipitation in the western region may cause changes in the area of high landslide susceptibility in that part of the study area.
Figure 7. The rainfall in the Tra Khuc basin between 2010 and 2020.
Spatial relationship
RF was used to assess the importance of each conditioning factor in the landslide susceptibility model. The higher the RF value, the greater the influence on the probability of the occurrence of landslides (Ali et al. Citation2021; Al-Najjar and Pradhan Citation2021). The RF values are shown in . The results show that slope is the most important factor for the occurrence of landslides, with an RF value of 0.21, followed by elevation (0.2). Most landslides occur in regions with high slope and high altitude. This feature makes it easier for models to distinguish landslide regions from non-landslide regions. In the study area, landslides occur in the west of the region, where slope or elevation is very high.
Figure 8. Relative importance of landslide conditioning factors using RF.
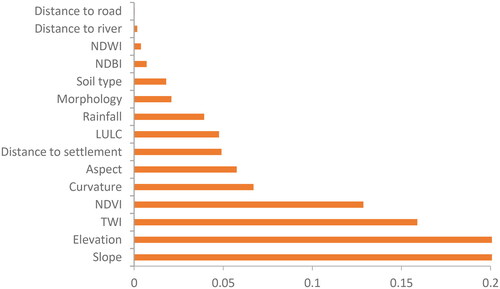
Coming third in importance was TWI, with an RF value of 0.16, followed by NDVI (0.13). It should be noted that in the Tra Khuc River basin, landslides mainly occur in the deforested region. Landslides occur in regions with low NDVI and TWI because the slope stability over these regions is very low. In decreasing order of importance, the remaining conditioning factors were curvature (0.07), aspect (0.06), distance to settlement (0.05), LULC (0.047), rainfall (0.04), morphology (0.02), soil type (0.18), NDBI (0.007), and NDWI (0.0038). With an RF value of 0, distance to road showed no influence on landslide occurrence.
Evaluating and comparing models
ROC has been used in various studies to assess natural hazards (Al-Najjar and Pradhan Citation2021). In this study, the ROC curve was used to evaluate the performance of all models (RBFNN–SARO, RBFNN–QSA, RBFNN–DO, RBFNN–LCBO, and SVM), as illustrated in . All models used the same set of training and validation data to compute AUC. The results show that all the proposed models performed well in assessing the effects of change in LULC and climate on landslide susceptibility. The RBFNN–QSA model obtained higher AUC values than the other models (0.98) in the case of both the training and validation datasets. The AUC values of those two datasets for the RBFNN–SARO model were 0.97 and 0.96 respectively. For the RBFNN–LCBO model, the results were 0.95 and 0.94; for RBFNN–DO, 0.93 and 0.93; for SVM, 0.93 and 0.92.
Besides the ROC curve, the indices RMSE and MAE were used to evaluate the performance of the proposed models (). The results show that the RBFNN–QSA model performed better than the other models in the training and validation data set with the lowest RMSE value (0.28), followed by SVM (0.29), RBFNN–SARO (0.3), RBFNN–LCBO (0.32), and RBFNN–DO (0.34). For the MAE index, the SVM model was most successful, with an MAE value of 0.15 for both training and validation datasets, followed by RBFNN–SARO (0.38), RBFNN–QSA (0.39), RBFNN–DO (0.4), and RBFNN–LCBO (0.42).
Table 4. Performance values for the proposed models.
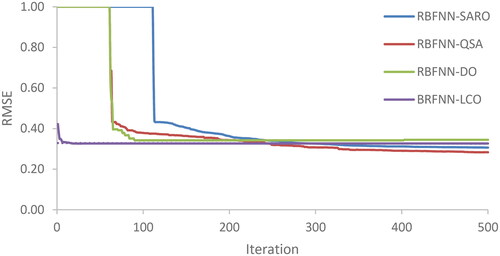
Each model was made for 500 iterations. The convergence curves of the proposed models are shown in . According to this chart, RBFNN-LCO showed the highest convergence rate: This model reached the lowest RMSE value in about the first 10 iterations. The RBFNN-DO model reached its lowest value after 100 iterations. Meanwhile, both RBFNN-QSA and RBFNN-SARO models optimize at iteration 350. It should be noted that the optimization algorithm used in this study is metaheuristic; the parameter optimization process of the RBFNN algorithm is divided into two phases: exploration and exploitation. During the exploration process, optimization algorithms identify potential solutions, so the RMSE value usually drops sharply and quickly. The exploitation process aims to find the optimal solution, so the RMSE value at this stage usually decreases slowly, and after a certain number of revolutions, the RMSE value stabilizes.
Figure 9. ROCs for the training data (top) and validation (bottom).
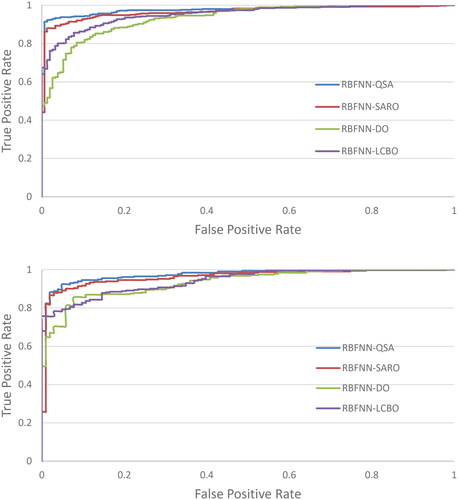
Figure 10. The convergence curves for the used models.
Landslide susceptibility under future LULC and climate change
and show the landslide susceptibility maps for 2010 and 2050, as produced using the RBFNN–SARO, RBFNN–QSA, RBFNN–DO, and RBFNN–LCBO models. For the RBFNN–SARO model, the area of high and very high landslide susceptibility increased from 54% to 59% between 2010 and 2020, and decrease to 57% in 2030 and 43% in 2050, while for the RBFNN–QSA model, these areas decreased from 45% to 35% between 2010 and 2020, and increase to 44.39% in 2030, then decrease again to 41% in 2050. The figures fell from 19 to 17% for the RBFNN–DO model between 2010 and 2020, and the decrease continues to 16.6% in 2030 and 16% in 2050. For the RBFNN–LCBO model, the decrease is from 29% to 26% between 2010 and 2020, to 25.9% in 2030, and further to 16.9% in 2050. While the area of moderate susceptibility does not differ greatly between the algorithms (about 300 km2), the difference is significant for the very low, low, high, and very high areas. The RBFNN-SARO results in both 2010 and 2050 produced the largest area of high and very high susceptibility of the four algorithms mentioned, along with the smallest area of low and very low susceptibility. Conversely, RBFNN–DO gave the largest area of low and very low susceptibility and the smallest high and very high result. When comparing the other two algorithms, it can be seen that the landslide susceptibility of RBFNN–QSA is concentrated at moderate and high levels while that of RBFNN–LCBO returned a larger area at low and moderate levels.
Figure 11. Landslide susceptibility mapping from 2010 to 2020 in study area.
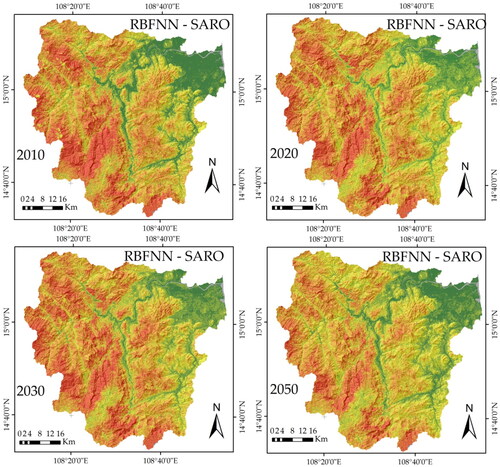
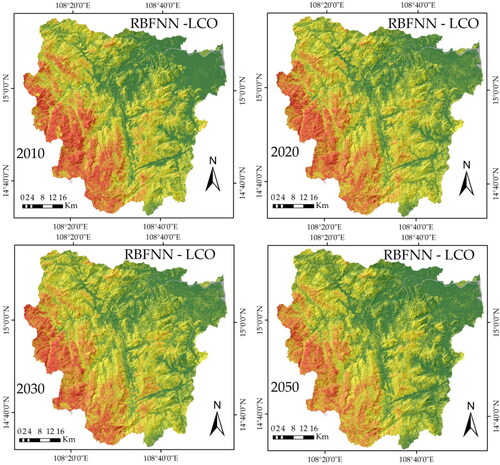
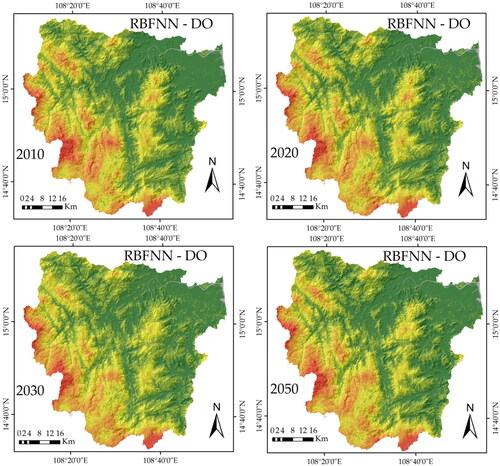
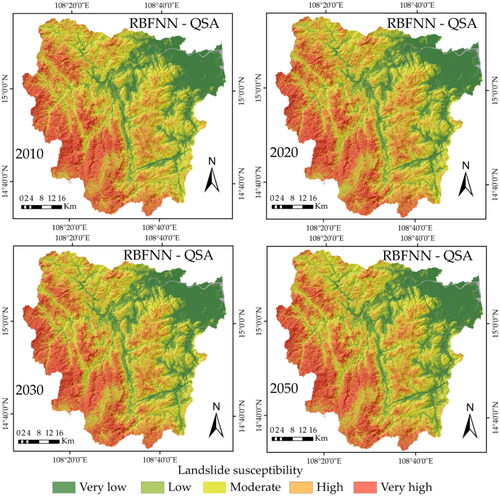
Table 5. Distribution of landslide susceptibility class obtained by RBFNN–SARO, RBFNN–QSA, RBFNN–DO, and RBFNN–LCBO.
The common trend of all four algorithms is for the high value to be distributed in the high mountainous areas in the west of the study area and the low value in the downstream delta and valleys between mountains. The distribution of this high value corresponds to the areas of forest and perennial crops on the land use maps of 2010 and 2050. This is also the primary living area of the rural population, especially the ethnic minorities upstream, where the living standards and infrastructure are lower than in the downstream coastal plain areas. Factors such as landslides add to the difficulty of daily life and economic development in this mountainous area.
Discussion
Changes in LULC and climate significantly affect natural hazards in general and landslides in particular (L. Chen et al. Citation2019; Pham et al. Citation2021b). Therefore, the evaluation of such effects has received increasing attention from the global scientific community, particularly as both urbanization and climate change accelerate. This study develops a novel approach to landslide risk assessment, which can support decision-makers in providing appropriate strategies for sustainable land use planning. Integrated management is an approach that explicitly recognizes the relationships between the various means of risk management in the context of economic, social, and climatic change. Although there are relationships between natural and social factors, these are rarely explored in detail. Our results highlight the importance of analyzing the relationships between LULC and climate change with landslide susceptibility for future risk management.
Several studies have pointed out that redundant or low-quality data can negatively influence the accuracy of prediction models; therefore, the pre-processing of data is considered essential (Bui Citation2019). In this study, RF filtered out non-useful factors for landslide prediction and concentrated on essential factors. The results show that slope and elevation were the most critical factors for the probability of occurrence of landslide in the study area, as they have crucial effects on the balance of the slopes and are responsible for their stability. Landslide occurrence tends to increase in the regions of high elevation and when the slope is less stable (Zhang et al. Citation2021).
TWI and NDVI were ranked third and fourth in importance because TWI represents the moisture and infiltration capacity of soil; the higher the value of TWI, the higher the probability of occurrence of landslides (Pham et al. Citation2021a). In the study area, landslides often occur after heavy rains, increasing soil moisture and reaching saturation. In recent years, landslides have increased in areas that have lost vegetation. The presence of vegetation on slopes helps to increase the mechanical stability of soil by strengthening the roots and reducing soil moisture by regulating precipitation (Saha et al. Citation2021). This has been highlighted by several previous studies in different regions (Jakob et al. Citation2005; Lehmann et al. Citation2019).
The effect on landslide occurrence of factors such as curvature, aspect, distance to settlement, LULC, and rainfall are ranked from five to nine respectively, as indicated by RF values. Distance to settlement is important because the construction of roads in mountainous areas requires cutting into slopes, which is considered one of the main reasons leading to the instability of slopes (Arabameri et al. Citation2021; Pham et al. Citation2021b). LULC is a factor reflecting the effects of human activities on landslide occurrence. Built-up and agricultural areas which are home to larger human settlements generally have a higher probability of landslide occurrence than other areas (Mandal et al. Citation2021). Finally, rainfall is a triggering factor for landslides (Hong et al. Citation2017). In the Tra Khuc River basin, landslides often occur after heavy rains, such as in 2020. The contribution of distance to road and distance to river on the occurrence of landslides in the region is relatively small, because the main causes of landslide in the study area are related to human activities such as deforestation, land-cover change, infrastructure construction, and rainfall. It should be noted that the model used to assess the effects of change in occupancy and rainfall on the probability of landslide occurrence in this study was data-driven: the distribution of data plays an integral role on model results.
The machine-learning method has proven effective in building a landslide susceptibility map and for the assessment of the change in LULC and climate on the occurrence of landslide susceptibility. However, the generalization problem remains in cases of limited data. Especially in landslide susceptibility mapping, data collection is very expensive and time-consuming. Al-Najjar and Pradhan (Citation2021) pointed out that models can correlate with missing data, so these models should be removed regardless of their performance. Various previous studies have tried sampling strategies or split sampling when building a model, to solve the challenges of limited data. In this study, several different techniques were used to reduce the influence of these issues. We used several satellite images with different dates to collect more landslide locations. In addition, optimization techniques have been widely used in the literature to reduce the effects of these issues.
Although RBFNN has the advantage of being simple to implement, requiring few computations, and giving acceptable results, the obtained solution is not optimal. Therefore, it is necessary to use optimization algorithms like QSA, SARO, DO, and LCBO to improve the performance of the RBFNN model. Our results confirmed our initial hypothesis that the models proposed in this study would outperform the reference models. RBFNN–QSA outperformed the others thanks to advantages in its ability to manage large amounts of data and the speed of data transfer between processes. In addition, QSA follows the first-in-first-out rule, so users can easily perform operations like insertion and deletion. Finally, QSA can be used easily with different data structures. The RBFNN–SARO model was the second best-performing, with an AUC value of 0.97, since SARO algorithms are easy to implement as they have simple concepts and formulas, and the number of parameters is small (Said et al. Citation2022). SARO has been shown to be effective in solving difficult optimization problems. Coming third, RBFNN–LCBO had a lot of advantages including a good balance between exploitation and exploration and the ability to handle the extremely difficult functions such as multimodal composite CEC. With an AUC value of 0.93, RBFNN–DO came in fourth place. Although DO is easy to implement, it has few parameters to adjust, and converges early; this algorithm gets easily stuck in a local optimization problem (Mirjalili Citation2016; Rahman et al. Citation2021).
The final results were unexpected because our hypothesis was that landslide occurrence in the study area has increased due to changes in LULC and climate change. This trend is typical of most mountain regions in the world where changes in LULC and climate change are both accelerating. Pham et al. (Citation2021) reported that the change in LULC and climate in the Kalvan watershed in Iran has led to an increase in the risk of landslides (Pham et al. Citation2021b). Persichillo et al. (Citation2017) showed that changes in agricultural land use were seen as one of the reasons leading to the landslide problem in Versa catchment in Italy (Persichillo et al. Citation2017). The study of Rabby et al. (Citation2022), carried out in the Rangamati municipality of Bangladesh, showed that changes in the vegetation surface and built-up area were the main causes of increasing landslide susceptibility. Bourenane and Bouhadad (Citation2021) analyzed the risk of landslide in the city of Constantine in Algeria. Their results underlined that the expansion of urban area caused an increased intensity of landslides (Bourenane and Bouhadad Citation2021). Zhu et al. (Citation2021) showed that climate change has caused an increase in extreme rainfall, which has contributed to landslide activity in the city of Yanguan, China (Zhu et al. Citation2021). Similarly, Kumari et al. (Citation2021) showed that climate change influences factors such as precipitation and temperature, which have significant effects on the stability of slope soil. This has caused an increase in landslides in Himachal Pradesh in India (Kumari et al. Citation2021).
However, in this study, although there is an increase in precipitation, which leads to a decrease in the stability of the slope in the study area, the increase in production forest and perennial crops improves overall stability, so landslide susceptibility decreases over time. This finding is backed up by Hürlimann et al. (Citation2022). Similarly, Shu et al. (Citation2019) pointed out that landslide susceptibility would decrease by about 48% in an area of very high landslide susceptibility in Val d‘Aran in the Spanish Pyrenees, due to an increase in forested area. Dymond et al. (Citation2006) indicated that increasing forest area is considered the key to reducing the landslide susceptibility in the Manawatu–Wanganui region of New Zealand. Malek et al. (Citation2015) reported that, in the context of climate change, reforestation has already been recognized as an important solution to improve slope stability in order to reduce landslide susceptibility in several regions of the world, such as southeast Romania’s Buzau County. Our study can add to this support for planners building strategies to reduce landslide damage in the context of climate change and LULC.
As many authors have pointed out, planning can help countering natural hazards, if it addresses the effects of changes in LULC and climate (HD Nguyen et al. Citation2021, Citation2022b). From this perspective, for the study region, we recommend the avoidance of construction in areas with high and very high probability of landslides. In addition, it is necessary to increase the forested area in these regions, to reduce landslide damage.
Our study provides additional evidence regarding the assessment of the effects of LULC changes and climate on landslide susceptibility. We have shown that remote sensing technology and machine learning are important tools in the assessment and monitoring of the effects of LULC and climate change on landslides at the regional level. Our study provides quantitative information on the dynamics of landslides to establish a basis for understanding the various aspects of these changes. The results of our study can contribute to a theoretical framework for developing strategies for sustainable land-use planning.
This study encountered general limitations when using topographic data. The DEM used in this study was constructed using a 1:10,000 topographic map. This DEM only simulates land surface, while DEMs constructed using other techniques such as LIDAR or UAV can reflect more detailed information, including slope and land cover. However, this technique is costly, which influences its ability to be widely applied. Various conditioning factors, such as NDVI, NDBI, and NDWI, were computed by Landsat 8 OLI image with a 30 m resolution. However, using Sentinel 2 A imagery can achieve greater accuracy. Finally, this study also encountered limitations related to the data of NDVI, NDBI, and NDWI used to build the flood susceptibility maps for 2030 and 2050: these data, despite being influential on landslide susceptibility, were unfortunately not available. So this may add some uncertainty to the conclusion of this study. Additionally, the use of machine learning to predict landslide susceptibility depends on an inventory map which contains landslide and non-landslide points. The more accurate the data, the better the quality of the predictive model. Although this data has been collected from multiple sources with the high accuracy, there is no universally established method to collect non-landslide points. In this study, these points were collected mainly in areas of low slope and altitude. So, in the future research, we tried to collect non-landslide points in the western mountain region. For this reason, the models proposed in this study may not correspond to reality. More collection of samples is needed in the future. In final, this method has some limitations when it is not possible to cover all variables affecting land use change because of the difficulty in accessing data and quantifying them spatially in the LCM model. Land use change depends on many other factors such as socio-economic planning, land use planning, policies that change in each development period of the country and territory. Therefore, using the past transition probability only partially predicts the future trend and this is also one of the limitations of the model. However, if understood in a more positive way, this study will help planners have an additional basis for better understanding the driving forces and come up with a reasonable land use plan. Or in another view, the prediction results may not be completely accurate with the future land use, but they can be considered as one of many scenarios corresponding to the rate of change of the previous period. Planners can consider these predictions as references for future planning adjustments or to contribute to the making of new plans.
Conclusions
This study assesses the effects of LULC change and climate change on landslide susceptibility in the Tra Khuc River basin using the machine learning algorithms RBFNN, SVM, RBFNN–SAR, RBFNN–QS, RBFNN–DA, and RBFNN–LCBO. The findings of this study can support decision-makers working in sustainable land-use planning.
In general, all the models proposed in this study performed well (AUC > 0.9), and outperformed the reference models. Among the models proposed, the RBFNN–QSA model performed best, with an AUC value of 0.98, followed by RBFNN–SARO (AUC = 0.97), RBFNN–LCBO (AUC = 0.95), RBFNN–DO (AUC = 0.93), and SVM (AUC = 0.92), respectively. They can be used to assess the effects of LULC and climate change on landslide susceptibility in any region in the world, particularly in areas with limited data.
The results show that rainfall increases by 18% in 2030 and 25.1% in 2050. In terms of LULC changes, plantation and protected forest areas decrease by about 400 km2 between 2010 and 2050. The area of perennial crops increases by about 800 km2 in the same period.
The proposed models predict that changes in LULC and climate in the 40-year period do have an effect on landslide susceptibility. The total area with high and very high landslide susceptibility decrease by between 100 and 300 km2, due to the increase in the area covered with vegetation. This demonstrates how protecting forests plays an important role in reducing landslide damage to humans and property.
Policymakers and planners can use the findings of our study to design and implement measures in regions with high and very high landslide susceptibility. Using our novel approach, the effects of changing LULC and climate on landslides can be reduced. The results of our study may also highlight the role of spatial planning in reducing the negative effects of landslides not only in Vietnam, but in countries around the world.
Apart from the effects on the landslide susceptibility, changes in LULC and climate also influence other natural hazards like flood susceptibility, so the models used in this study may be used in the future to assess the effects of climate change and land use on flood susceptibility.
Disclosure statement
The authors declare no conflict of interest.
References
- Abdı A, Bouamrane A, Karech T, Dahri N, Kaouachi A. 2021. Landslide susceptibility mapping using GIS-based fuzzy logic and the analytical hierarchical processes approach: a case study in Constantine (North-East Algeria). Geotech Geol Eng. 39(8):5675–5691.
- Achour Y, Boumezbeur A, Hadji R, Chouabbi A, Cavaleiro V, Bendaoud EA. 2017. Landslide susceptibility mapping using analytic hierarchy process and information value methods along a highway road section in Constantine, Algeria. Arabian J Geosci. 10(8):1–16.
- Aghelpour P, Mohammadi B, Mehdizadeh S, Bahrami-Pichaghchi H, Duan Z. 2021. A novel hybrid dragonfly optimization algorithm for agricultural drought prediction. Stoch Environ Res Risk Assess. 35(12):2459–2477.
- Al-Najjar HA, Pradhan B. 2021. Spatial landslide susceptibility assessment using machine learning techniques assisted by additional data created with generative adversarial networks. Geosci Front. 12(2):625–637.
- Ali SA, Parvin F, Vojteková J, Costache R, Linh NTT, Pham QB, Vojtek M, Gigović L, Ahmad A, Ghorbani MA. 2021. GIS-based landslide susceptibility modeling: a comparison between fuzzy multi-criteria and machine learning algorithms. Geosci Front. 12(2):857–876.
- Aouissi HA, Petrişor A-I, Ababsa M, Boştenaru-Dan M, Tourki M, Bouslama Z. 2021. Influence of land use on avian diversity in North African urban environments. Land. 10(4):434.
- Arabameri A, Chandra Pal S, Rezaie F, Chakrabortty R, Saha A, Blaschke T, Di Napoli M, Ghorbanzadeh O, Thi P, Ngo T. 2021. Decision tree based ensemble machine learning approaches for landslide susceptibility mapping. Geocarto Int. 37(16):1–35.
- Avtar R, Singh C, Singh G, Verma R, Mukherjee S, Sawada H. 2011. Landslide susceptibility zonation study using remote sensing and GIS technology in the Ken-Betwa River Link area, India. Bull Eng Geol Environ. 70(4):595–606.
- Bourenane H, Bouhadad Y. 2021. Impact of land use changes on landslides occurrence in urban area: the case of the Constantine city (Ne Algeria). Geotech Geol Eng. 39(6):1–21.
- Braimoh A, Vlek P. 2004. The impact of land‐cover change on soil properties in northern Ghana. Land Degrad Dev. 15(1):65–74.
- Bui Q-T. 2019. Metaheuristic algorithms in optimizing neural network: a comparative study for forest fire susceptibility mapping in Dak Nong, Vietnam. Geomat Nat Hazards Risk. 10(1):136–150.
- Chang F-J, Chen Y-C. 2003. Estuary water-stage forecasting by using radial basis function neural network. J Hydrol. 270(1–2):158–166.
- Chang X, Zhang F, Cong K, Liu X. 2021. Scenario simulation of land use and land cover change in mining area. Sci Rep. 11(1):1–12.
- Chang Z, Du Z, Zhang F, Huang F, Chen J, Li W, Guo Z. 2020. Landslide susceptibility prediction based on remote sensing images and GIS: comparisons of supervised and unsupervised machine learning models. Remote Sens. 12(3):502.
- Chauhan S, Sharma M, Arora MK. 2010. Landslide susceptibility zonation of the Chamoli region, Garhwal Himalayas, using logistic regression model. Landslides. 7(4):411–423.
- Chen L, Guo Z, Yin K, Shrestha DP, Jin S. 2019. The influence of land use and land cover change on landslide susceptibility: a case study in Zhushan Town, Xuan’en County (Hubei, China). Nat Hazards Earth Syst Sci. 19(10):2207–2228.
- Chen W, Chai H, Zhao Z, Wang Q, Hong H. 2016. Landslide susceptibility mapping based on GIS and support vector machine models for the Qianyang County, China. Environ Earth Sci. 75(6):1–13.
- Chen W, Peng J, Hong H, Shahabi H, Pradhan B, Liu J, Zhu A-X, Pei X, Duan Z. 2018a. Landslide susceptibility modelling using GIS-based machine learning techniques for Chongren County, Jiangxi Province, China. Sci Total Environ. 626:1121–1135.
- Chen W, Pourghasemi HR, Panahi M, Kornejady A, Wang J, Xie X, Cao S. 2017. Spatial prediction of landslide susceptibility using an adaptive neuro-fuzzy inference system combined with frequency ratio, generalized additive model, and support vector machine techniques. Geomorphology. 297:69–85.
- Chen W, Shahabi H, Shirzadi A, Hong H, Akgun A, Tian Y, Liu J, Zhu A, Li S. 2019. Novel hybrid artificial intelligence approach of bivariate statistical-methods-based kernel logistic regression classifier for landslide susceptibility modeling. Bull Eng Geol Environ. 78(6):4397–4419.
- Chen W, Shahabi H, Zhang S, Khosravi K, Shirzadi A, Chapi K, Pham BT, Zhang T, Zhang L, Chai H. 2018b. Landslide susceptibility modeling based on GIS and novel bagging-based kernel logistic regression. Appl Sci. 8(12):2540.
- Chen W, Zhang S. 2021. GIS-based comparative study of Bayes network, Hoeffding tree and logistic model tree for landslide susceptibility modeling. Catena. 203:105344.
- Chen X, Chen W. 2021. Gis-based landslide susceptibility assessment using optimized hybrid machine learning methods. Catena. 196:104833.
- Chowdhuri I, Pal SC, Chakrabortty R, Malik S, Das B, Roy P, Sen K. 2021. Spatial prediction of landslide susceptibility using projected storm rainfall and land use in Himalayan region. Bull Eng Geol Environ. 80(7):5237–5258.
- Clerici A, Perego S, Tellini C, Vescovi P. 2002. A procedure for landslide susceptibility zonation by the conditional analysis method. Geomorphology. 48(4):349–364.
- Crozier MJ. 2010. Deciphering the effect of climate change on landslide activity: a review. Geomorphology. 124(3–4):260–267.
- Devara M, Tiwari A, Dwivedi R. 2021. Landslide susceptibility mapping using MT-INSAR and Ahp enabled GIS-based multi-criteria decision analysis. Geomat Nat Hazards Risk. 12(1):675–693.
- Dias HC, Gramani MF, Grohmann CH, Bateira C, Vieira BC. 2021. Statistical-based shallow landslide susceptibility assessment for a tropical environment: a case study in the southeastern Brazilian coast. Nat Hazards. 108(1):205–223.
- Dymond JR, Ausseil A-G, Shepherd JD, Buettner L. 2006. Validation of a region-wide model of landslide susceptibility in the Manawatu–Wanganui region of New Zealand. Geomorphology. 74(1):70–79. https://www.sciencedirect.com/science/article/pii/S0169555X05002229.
- Ermini L, Catani F, Casagli N. 2005. Artificial neural networks applied to landslide susceptibility assessment. Geomorphology. 66(1–4):327–343.
- Fang Z, Wang Y, Peng L, Hong H. 2020. Integration of convolutional neural network and conventional machine learning classifiers for landslide susceptibility mapping. Comput Geosci. 139:104470.
- Gallart F, Llorens P. 2003. Catchment management under environmental change: impact of land cover change on water resources. Water Int. 28(3):334–340.
- Gameiro S, Riffel ES, De Oliveira GG, Guasselli LA. 2021. Artificial neural networks applied to landslide susceptibility: the effect of sampling areas on model capacity for generalization and extrapolation. Appl Geogr. 137:102598.
- Garcia-Alvarez D, Olmedo MTC, Paegelow M. 2019. Sensitivity of a common land use cover change (LUCC) model to the minimum mapping unit (MMU) and minimum mapping width (MMW) of input maps. Comput Environ Urban Syst. 78:101389.
- Guo C, Montgomery DR, Zhang Y, Wang K, Yang Z. 2015. Quantitative assessment of landslide susceptibility along the Xianshuihe fault zone, Tibetan Plateau, China. Geomorphology. 248:93–110.
- Gupta S, Thakur S, Gupta A. 2022. Optimized feature selection approach for smartphone based diabetic retinopathy detection. 2nd International Conference on Innovative Practices in Technology and Management (ICIPTM). IEEE. p. 350–355.
- He S, Pan P, Dai L, Wang H, Liu J. 2012. Application of kernel-based fisher discriminant analysis to map landslide susceptibility in the Qinggan River delta, Three Gorges, China. Geomorphology. 171:30–41.
- Henriques C, Zêzere JL, Marques F. 2015. The role of the lithological setting on the landslide pattern and distribution. Eng Geol. 189:17–31.
- Hong H, Pradhan B, Jebur MN, Bui DT, Xu C, Akgun A. 2016. Spatial prediction of landslide hazard at the Luxi area (China) using support vector machines. Environ Earth Sci. 75(1):1–14.
- Hong H, Chen W, Xu C, Youssef AM, Pradhan B, Tien Bui D. 2017. Rainfall-induced landslide susceptibility assessment at the Chongren area (China) using frequency ratio, certainty factor, and index of entropy. Geocarto Int. 32(2):139–154.
- Huang F, Chen J, Du Z, Yao C, Huang J, Jiang Q, Chang Z, Li S. 2020. Landslide susceptibility prediction considering regional soil erosion based on machine-learning models. ISPRS Int J Geo-Inf. 9(6):377.
- Huang J, Ling S, Wu X, Deng R. 2022. GIS-based comparative study of the Bayesian network, decision table, radial basis function network and stochastic gradient descent for the spatial prediction of landslide susceptibility. Land. 11(3):436.
- Hürlimann M, Guo Z, Puig-Polo C, Medina V. 2022. Impacts of future climate and land cover changes on landslide susceptibility: regional scale modelling in the Val d’Aran region (Pyrenees, Spain). Landslides. 19(1):99–118.
- Jakob M, Lambert S. 2009. Climate change effects on landslides along the southwest coast of British Columbia. Geomorphology. 107(3–4):275–284.
- Jakob M, Hungr O, Jakob DM. 2005. Debris-flow hazards and related phenomena. Berlin, Heidelberg: Springer.
- Karsli F, Atasoy M, Yalcin A, Reis S, Demir O, Gokceoglu C. 2009. Effects of land-use changes on landslides in a landslide-prone area (Ardesen, Rize, Ne Turkey). Environ Monit Assess. 156(1):241–255.
- Khatri A, Gaba A, Rana K, Kumar V. 2020. A novel life choice-based optimizer. Soft Comput. 24(12):9121–9141.
- Khoshnood Motlagh S, Sadoddin A, Haghnegahdar A, Razavi S, Salmanmahiny A, Ghorbani K. 2021. Analysis and prediction of land cover changes using the land change modeler (LCM) in a semiarid river basin, Iran. Land Degrad Dev. 32(10):3092–3105.
- Kumari S, Chauhan A, Shankar V. 2021. Assessment of climate change implications on landslides in mid and high hills of Himachal Pradesh, India. Arabian J Geosci. 14(14):1–15.
- Lee S, Pradhan B. 2007. Landslide hazard mapping at Selangor, Malaysia using frequency ratio and logistic regression models. Landslides. 4(1):33–41.
- Lee S, Ryu JH, Min K, Won JS. 2003. Landslide susceptibility analysis using GIS and artificial neural network. Earth Surf Process Landf. 28(12):1361–1376.
- Lehmann P, Von Ruette J, Or D. 2019. Deforestation effects on rainfall‐induced shallow landslides: remote sensing and physically‐based modelling. Water Resour Res. 55(11):9962–9976.
- Leta MK, Demissie TA, Tränckner J. 2021. Modeling and prediction of land use land cover change dynamics based on land change modeler (LCM) in Nashe watershed, upper Blue Nile Basin, Ethiopia. Sustainability. 13(7):3740.
- Li D, Huang F, Yan L, Cao Z, Chen J, Ye Z. 2019. Landslide susceptibility prediction using particle-swarm-optimized multilayer perceptron: comparisons with multilayer-perceptron-only, BP neural network, and information value models. Appl Sci. 9(18):3664.
- Li Y, Lin F, Lou L, Li J, Xu Z, Zhu S, Luo X, Huo G, Zhao Q. 2021. Performance analysis of landslide susceptibility assessment under different factor-filtering models. Arabian J Geosci. 14(12):1–14.
- Liu J, Wu Z, Zhang H. 2021. Analysis of changes in landslide susceptibility according to land use over 38 years in Lixian County, China. Sustainability. 13(19):10858.
- Malek Ž, Boerboom L, Glade T. 2015. Future forest cover change scenarios with implications for landslide risk: an example from Buzau Subcarpathians, Romania. Environ Manage. 56(5):1228–1243.
- Mandal K, Saha S, Mandal S. 2021. Applying deep learning and benchmark machine learning algorithms for landslide susceptibility modelling in Rorachu river basin of Sikkim Himalaya, India. Geosci Front. 12(5):101203.
- Marimuthu R, Thomas BA, Dcruz N, Hayar A. 2022. Choice-based recreation facility for smart cities. In: Rani, S., Sai, V., Maheswar, R. (eds) IOT and WSN based smart cities: a machine learning perspective. Switzerland: Springer. p. 257–273.
- Mehrabi M. 2022. Landslide susceptibility zonation using statistical and machine learning approaches in northern Lecco, Italy. Nat Hazards. 111(1):901–937.
- Mehrabi M, Moayedi H. 2021. Landslide susceptibility mapping using artificial neural network tuned by metaheuristic algorithms. Environ Earth Sci. 80(24):1–20.
- Mehrabi M, Pradhan B, Moayedi H, Alamri A. 2020. Optimizing an adaptive neuro-fuzzy inference system for spatial prediction of landslide susceptibility using four state-of-the-art metaheuristic techniques. Sensors. 20(6):1723.
- Mirjalili S. 2016. Dragonfly algorithm: a new meta-heuristic optimization technique for solving single-objective, discrete, and multi-objective problems. Neural Comput Appl. 27(4):1053–1073.
- Moayedi H, Mehrabi M, Bui DT, Pradhan B, Foong LK. 2020. Fuzzy-metaheuristic ensembles for spatial assessment of forest fire susceptibility. J Environ Manage. 260:109867.
- Moayedi H, Osouli A, Nguyen H, Rashid ASA. 2021. A novel Harris hawks’ optimization and k-fold cross-validation predicting slope stability. Engineering with Computers. 37(1):369–379.
- Moharrami M, Naboureh A, Gudiyangada Nachappa T, Ghorbanzadeh O, Guan X, Blaschke T. 2020. National-scale landslide susceptibility mapping in Austria using fuzzy best-worst multi-criteria decision-making. ISPRS Int J Geo-Inf. 9(6):393.
- Mottet É, Roche Y. 2009. L’urbanisation de la ville de ninh binh dans le delta du fleuve rouge (Vietnam): mise en perspective des forces et faiblesses de la gestion du risque d’inondation. VertigO-la Revue Électronique en Sciences de L'environnement. 8(3). https://doi.org/10.4000/vertigo.7782
- Nagendra H, Reyers B, Lavorel S. 2013. Impacts of land change on biodiversity: making the link to ecosystem services. Curr Opin Environ Sustain. 5(5):503–508.
- Näschen K, Diekkrüger B, Evers M, Höllermann B, Steinbach S, Thonfeld F. 2019. The impact of land use/land cover change (LULCC) on water resources in a tropical catchment in Tanzania under different climate change scenarios. Sustainability. 11(24):7083.
- Ngo PTT, Panahi M, Khosravi K, Ghorbanzadeh O, Kariminejad N, Cerda A, Lee S. 2021. Evaluation of deep learning algorithms for national scale landslide susceptibility mapping of Iran. Geosci Front. 12(2):505–519.
- Nguyen H-D, Pham V-D, Nguyen Q-H, Pham V-M, Pham MH, Vu VM, Bui Q-T. 2020. An optimal search for neural network parameters using the Salp swarm optimization algorithm: a landslide application. Remote Sens Lett. 11(4):353–362.
- Nguyen HD, Ardillier-Carras F, Touchart L. 2018. Les paysages de rizières et leur évolution récente dans le delta du fleuve gianh. Cybergeo: Eur J Geogr. 876. https://doi.org/10.4000/cybergeo.29826
- Nguyen HD, Dang DK, Nguyen Q-H, Bui Q-T, Petrisor A-I. 2022a. Evaluating the effects of climate and land use change on the future flood susceptibility in the central region of Vietnam by integrating land change modeler, machine learning methods. Geocarto Int. 1–36. https://doi.org/10.1080/10106049.2022.2071477
- Nguyen HD, Fox D, Dang DK, Pham LT, Viet Du QV, Nguyen THT, Dang TN, Tran VT, Vu PL, Nguyen Q-H. 2021. Predicting future urban flood risk using land change and hydraulic modeling in a river watershed in the central province of Vietnam. Remote Sens. 13(2):262.
- Nguyen HD, Quang-Thanh B, Nguyen Q-H, Nguyen TG, Pham LT, Nguyen XL, Vu PL, Thanh Nguyen TH, Nguyen AT, Petrisor A-I. 2022b. A novel hybrid approach to flood susceptibility assessment based on machine learning and land use change. Case study: a river watershed in Vietnam. Hydrol Sci J. 67(7): 1–19.
- Nguyen Q-H, Chou T-Y, Yeh M-L, Hoang T-V, Nguyen H-D, Bui Q-T. 2021. Henry’s gas solubility optimization algorithm in formulating deep neural network for landslide susceptibility assessment in mountainous areas. Environ Earth Sci. 80(11):1–10.
- Nguyen V-T, Tran TH, Ha NA, Ngo VL, Nadhir A-A, Tran VP, Duy Nguyen H, Ma M, Amini A, Prakash I. 2019. GIS based novel hybrid computational intelligence models for mapping landslide susceptibility: a case study at Da Lat City, Vietnam. Sustainability. 11(24):7118.
- Ojima D, Galvin K, Turner B. 1994. The global impact of land-use change. BioScience. 44(5):300–304.
- Orr MJ. 1996. Introduction to radial basis function networks. Technical Report, center for cognitive science, University of Edinburgh.
- Oyelade ON, Ezugwu AE. 2022. Characterization of abnormalities in breast cancer images using nature‐inspired metaheuristic optimized convolutional neural networks model. Concurr Comput: Pract Exp. 34(4):e6629.
- Persichillo MG, Bordoni M, Meisina C. 2017. The role of land use changes in the distribution of shallow landslides. Sci Total Environ. 574:924–937.
- Petrişor A-I, Sirodoev I, Ianoş I. 2020. Trends in the national and regional transitional dynamics of land cover and use changes in Romania. Remote Sens. 12(2):230.
- Pham BT, Jaafari A, Prakash I, Bui DT. 2019a. A novel hybrid intelligent model of support vector machines and the multiboost ensemble for landslide susceptibility modeling. Bull Eng Geol Environ. 78(4):2865–2886.
- Pham BT, Nguyen MD, Nguyen-Thoi T, Ho LS, Koopialipoor M, Quoc NK, Armaghani DJ, Van Le H. 2021. A novel approach for classification of soils based on laboratory tests using Adaboost, Tree and ANN modeling. Transp Geotech. 27:100508.
- Pham BT, Prakash I, Singh SK, Shirzadi A, Shahabi H, Bui DT. 2019b. Landslide susceptibility modeling using reduced error pruning trees and different ensemble techniques: hybrid machine learning approaches. Catena. 175:203–218.
- Pham BT, Shirzadi A, Bui DT, Prakash I, Dholakia M. 2018. A hybrid machine learning ensemble approach based on a radial basis function neural network and rotation forest for landslide susceptibility modeling: a case study in the Himalayan area, India. Int J Sediment Res. 33(2):157–170.
- Pham QB, Achour Y, Ali SA, Parvin F, Vojtek M, Vojteková J, Al-Ansari N, Achu A, Costache R, Khedher KM. 2021a. A comparison among fuzzy multi-criteria decision making, bivariate, multivariate and machine learning models in landslide susceptibility mapping. Geomat Nat Hazards Risk. 12(1):1741–1777.
- Pham QB, Chandra Pal S, Chakrabortty R, Saha A, Janizadeh S, Ahmadi K, Khedher KM, Anh DT, Tiefenbacher JP, Bannari A. 2021b. Predicting landslide susceptibility based on decision tree machine learning models under climate and land use changes. Geocarto Int.: 1–27.
- Pham VD, Nguyen Q-H, Nguyen H-D, Pham V-M, Bui Q-T. 2020. Convolutional neural network—optimized moth flame algorithm for shallow landslide susceptible analysis. IEEE Access. 8:32727–32736.
- Pourghasemi HR, Pradhan B, Gokceoglu C. 2012. Application of fuzzy logic and analytical hierarchy process (Ahp) to landslide susceptibility mapping at Haraz Watershed, Iran. Nat Hazards. 63(2):965–996.
- Pourghasemi HR, Jirandeh AG, Pradhan B, Xu C, Gokceoglu C. 2013. Landslide susceptibility mapping using support vector machine and GIS at the Golestan province, Iran. J Earth Syst Sci. 122(2):349–369.
- Pourghasemi HR, Sadhasivam N, Amiri M, Eskandari S, Santosh M. 2021. Landslide susceptibility assessment and mapping using state-of-the art machine learning techniques. Nat Hazards. 108(1):1291–1316.
- Pradhan B. 2013. A comparative study on the predictive ability of the decision tree, support vector machine and neuro-fuzzy models in landslide susceptibility mapping using GIS. Comput Geosci. 51:350–365. https://www.sciencedirect.com/science/article/pii/S0098300412003093.
- Pradhan B, Sezer EA, Gokceoglu C, Buchroithner MF. 2010. Landslide susceptibility mapping by neuro-fuzzy approach in a landslide-prone area (Cameron Highlands, Malaysia). IEEE Trans Geosci Remote Sens. 48(12):4164–4177.
- Rabby YW, Li Y, Abedin J, Sabrina S. 2022. Impact of land use/land cover change on landslide susceptibility in Rangamati municipality of Rangamati district, Bangladesh. ISPRS Int J Geo-Inf. 11(2):89.
- Rahman CM, Rashid TA. 2019. Dragonfly algorithm and its applications in applied science survey. Comput Intell Neurosci. 2019:1–21.
- Rahman CM, Rashid TA, Alsadoon A, Bacanin N, Fattah P, Mirjalili S. 2021. A survey on dragonfly algorithm and its applications in engineering. Evol Intell. 2021:1–21.
- Reichenbach P, Busca C, Mondini AC, Rossi M., 2014. The influence of land use change on landslide susceptibility zonation: the Briga catchment test site (Messina, Italy). Environ Manage. 54(6):1372–1384.
- Rianna G, Zollo A, Tommasi P, Paciucci M, Comegna L, Mercogliano P. 2014. Evaluation of the effects of climate changes on landslide activity of orvieto clayey slope. Procedia Earth Planet Sci. 9:54–63.
- Roccati A, Paliaga G, Luino F, Faccini F, Turconi L. 2021. GIS-based landslide susceptibility mapping for land use planning and risk assessment. Land. 10(2):162.
- Roose A, Kull A, Gauk M, Tali T. 2013. Land use policy shocks in the post-communist urban fringe: a case study of Estonia. Land Use Policy. 30(1):76–83.
- Saha S, Roy J, Pradhan B, Hembram TK. 2021. Hybrid ensemble machine learning approaches for landslide susceptibility mapping using different sampling ratios at east Sikkim Himalayan, India. Adv Space Res. 68(7):2819–2840.
- Said M, Houssein EH, Deb S, Ghoniem RM, Elsayed AG. 2022. Economic load dispatch problem based on search and rescue optimization algorithm. IEEE Access. 10:47109–47123.
- Seki HA, Shirima DD, Courtney Mustaphi CJ, Marchant R, Munishi PK. 2018. The impact of land use and land cover change on biodiversity within and adjacent to Kibasira Swamp in Kilombero Valley, Tanzania. Afr J Ecol. 56(3):518–527.
- Shabani A, Asgarian B, Gharebaghi SA, Salido MA, Giret A. 2019. A new optimization algorithm based on search and rescue operations. Math Probl Eng. 2019:2482543. https://doi.org/10.1155/2019/2482543
- Shahzad N, Ding X, Abbas S. 2022. A comparative assessment of machine learning models for landslide susceptibility mapping in the rugged terrain of northern Pakistan. Appl Sci. 12(5):2280.
- Shu H, Guo Z, Qi S, Song D, Pourghasemi HR, Ma J. 2021. Integrating landslide typology with weighted frequency ratio model for landslide susceptibility mapping: a case study from Lanzhou city of northwestern China. Remote Sens. 13(18):3623.
- Shu H, Hürlimann M, Molowny-Horas R, González M, Pinyol J, Abancó C, Ma J. 2019. Relation between land cover and landslide susceptibility in Val d‘Aran, Pyrenees (Spain): historical aspects, present situation and forward prediction. Sci Total Environ. 693:133557. https://www.sciencedirect.com/science/article/pii/S0048969719334771.
- Steger S, Mair V, Kofler C, Pittore M, Zebisch M, Schneiderbauer S. 2021. Correlation does not imply geomorphic causation in data-driven landslide susceptibility modelling–benefits of exploring landslide data collection effects. Sci Total Environ. 776:145935.
- Sun D, Xu J, Wen H, Wang D. 2021. Assessment of landslide susceptibility mapping based on Bayesian hyperparameter optimization: a comparison between logistic regression and random forest. Eng Geol. 281:105972.
- Tyagi A, Tiwari RK, James N. 2022. Mapping the landslide susceptibility considering future land-use land-cover scenario. Landslides. 20:65–76.
- Vapnik V, Guyon I, Hastie T. 1995. Support vector machines. Mach Learn. 20(3):273–297.
- Vojteková J, Vojtek M. 2020. Assessment of landslide susceptibility at a local spatial scale applying the multi-criteria analysis and GIS: a case study from Slovakia. Geomat Nat Hazards Risk. 11(1):131–148.
- Wu Y, Li W, Liu P, Bai H, Wang Q, He J, Liu Y, Sun S. 2016. Application of analytic hierarchy process model for landslide susceptibility mapping in the Gangu County, Gansu Province, China. Environ Earth Sci. 75(5):1–11.
- Xiao T, Yin K, Yao T, Liu S. 2019. Spatial prediction of landslide susceptibility using GIS-based statistical and machine learning models in Wanzhou County, Three Gorges Reservoir, China. Acta Geochim. 38(5):654–669.
- Xu K, Guo Q, Li Z, Xiao J, Qin Y, Chen D, Kong C. 2015. Landslide susceptibility evaluation based on BPNN and GIS: a case of Guojiaba in the Three Gorges Reservoir Area. Int J Geogr Inf Sci. 29(7):1111–1124.
- Yalcin A, Reis S, Aydinoglu A, Yomralioglu T. 2011. A GIS-based comparative study of frequency ratio, analytical hierarchy process, bivariate statistics and logistics regression methods for landslide susceptibility mapping in Trabzon, Ne Turkey. Catena. 85(3):274–287.
- Yao X, Tham L, Dai F. 2008. Landslide susceptibility mapping based on support vector machine: a case study on natural slopes of Hong Kong, China. Geomorphology. 101(4):572–582.
- Youssef AM, Pourghasemi HR. 2021. Landslide susceptibility mapping using machine learning algorithms and comparison of their performance at Abha Basin, Asir Region, Saudi Arabia. Geosci Front. 12(2):639–655.
- Youssef AM, Pourghasemi HR, Pourtaghi ZS, Al-Katheeri MM. 2016. Landslide susceptibility mapping using random forest, boosted regression tree, classification and regression tree, and general linear models and comparison of their performance at Wadi Tayyah Basin, Asir Region, Saudi Arabia. Landslides. 13(5):839–856.
- Zhang J, Xiao M, Gao L, Pan Q. 2018. Queuing search algorithm: a novel metaheuristic algorithm for solving engineering optimization problems. Appl Math Modell. 63:464–490.
- Zhang T, Fu Q, Wang H, Liu F, Wang H, Han L. 2021. Bagging-based machine learning algorithms for landslide susceptibility modeling. Nat Hazards. 110:823–846.
- Zhou S, Zhang Y, Tan X, Abbas SM. 2021. A comparative study of the bivariate, multivariate and machine-learning-based statistical models for landslide susceptibility mapping in a seismic-prone region in China. Arabian J Geosci. 14(6):1–19.
- Zhou X, Wen H, Zhang Y, Xu J, Zhang W. 2021. Landslide susceptibility mapping using hybrid random forest with GeoDetector and RFE for factor optimization. Geosci Front. 12(5):101211.
- Zhu D, Song K, Mu J, Huang H, Du H, Xiazhuang F, Sun C. 2021. Effect of climate change induced extreme precipitation on landslide activity in the Three Gorges Reservoir, China. Bull Eng Geol Environ. 80(2):781–794.