
 ?Mathematical formulae have been encoded as MathML and are displayed in this HTML version using MathJax in order to improve their display. Uncheck the box to turn MathJax off. This feature requires Javascript. Click on a formula to zoom.
Abstract
This study is an effort to spatially assess the air quality in Iraq. A statistical model was applied to predict air quality and determine the relationships of air pollutants with the Air Quality Index (AQI) in 2020. Remotely sensed and ground station data were used in this study. Three methods have been applied; spatial interpolation, Least Square (LS) statistical method, and Geographically Weighted Regression (GWR) model. Analysis revealed that air quality was unhealthy in Iraq. The northern part showed moderate air quality whereas contamination levels were high in most of the southern part of Iraq. Predictive (LS), and (GWR) models were developed. The resulting correlation coefficient R2 was equal to 0.88 and 0.85 for LS and GWR respectively. Accuracy evaluations were 95% and 94%. The results of the study have the potential to assist the related government departments and disaster management authorities in decision-making and urban air contamination risk reduction.
1. Introduction
A healthy human life requires healthy air (Luo et al. Citation2020). Polluted air leads to many diseases particularly respiratory and lung issues (Almetwally et al. Citation2020). Generally, air pollution indicators are used to specify the severity level of air contamination for exposed communities (Cheng et al. Citation2007). Accurate and effective prediction of the Air Quality Index (AQI) is one of the prerequisites for promoting public health, especially in urban areas (Wu & Lin, Citation2019). The main source of air pollution exposure estimation is monitoring from terrestrial networks, but due to increased coverage, monitoring is becoming limited, so GIS-based regression modeling of remotely sensed data is conveniently assisting in obtaining air quality information (Somvanshi et al. Citation2019). The most common predictor in remote sensing data modeling is the Aerosol Optical Depth (AOD) retrieval from MODIS products which is efficient in large areas for example (large cities, and countries). Otherwise, MODIS has a low spatial resolution that limits its application in small cities (Alvarez-Mendoza et al. Citation2019). The satellite observatory system not only provides real-time images of the Earth’s surface and atmosphere but also particles (PM) monitoring images on a spatio-temporal basis (Chudnovsky et al. Citation2017).
The randomness, lack of static, and erratic Air Quality Index (AQI) series bring difficulty in predicting AQI (Wang et al. Citation2017). The AQI includes data regarding particulate matter (PM) and Ozone (O3) besides, the main air contaminants are carbon dioxide (CO2), sulfur dioxide (SO2), and nitrogen dioxide (NO2) (Cheng et al. Citation2007; Jumaah et al. Citation2019). PM2.5 is mainly derived from burning processes and is responsible for the health effects of diseases and concomitant epidemics due to toxic components (Hamed et al. Citation2021). Particulate matter has been used to represent the API Air Pollutant Index for more than 20 years (Tella et al. Citation2021). Local differences exist in the distribution of urban pollutants (Liu et al. Citation2022). The elevated concentration of PM2.5 poses a threat to human health (Zhang et al. Citation2021), as exposure can affect the lungs and heart (Jumaah et al. Citation2018). Thus, it is essential to detect the main causes of urban air pollution to control their increasing levels, and thus requires adequate monitoring (Jumaah et al. Citation2021; Ameen et al. Citation2021). Iraq is an area known to be affected by significant concentrations of PM2.5 attributable to sources containing desert dust and surrounding pollution (Mirzaei et al. Citation2019; Li et al. Citation2021). Spatial AQ modeling and analysis can help improve decision-making to mitigate poor air quality (Tella et al. Citation2021).
More than 40% of Iraq’s land is covered by desert and on average 122 sand and dust storms occur annually. The wind pattern, climatic conditions, and terrain characteristics also contribute to the genesis of an intense dust storm (Chudnovsky et al. Citation2017) leading to air pollution (Al-Hasnawi et al. Citation2016; Abdulkadhim et al. Citation2017). Also, moisture, dryness, and soil moisture had the largest contribution to predicting dust source regions (Nafarzadegan et al. Citation2021). Currently, in the post-war era, industrial development taking place and adding contaminants to the air (Abdulkadhim et al. Citation2017). Iraq is characterized by frequent dust storms that affect the increase in the concentration of PM2.5 particles, as studies have indicated that dust storms increase the probability of increasing the concentration of particles by twenty-eight percent of the concentrations emitted from other sources (Farahani & Arhami, Citation2020).
Al-Salman & TaghiEbadi (Citation2021) also found that SO2, NO2, and CO2 are the main air pollutants in Iraq. Similarly, In Baghdad, many types of pollutants also have been detected by Rabee (Citation2015). The sulphur compounds were at dangerous levels posing risk to human health, and the concentrations of NO2 and volatile organic compounds were also high, which leads to smog formation. It is necessary to identify effective strategies to reduce air pollution in order to solve these problems (Chaichan et al. Citation2018). Furthermore, frequent and intensive fire incidents in Iraq resulted in the worsening of air pollution (Rasul et al. Citation2021). Furthermore, based on the large numbers of people that suffer from symptoms correlated to air pollutants in Iraq, many types of research confirmed the presence of prevalent air pollution in Iraq (Al-jarakh et al. Citation2021). Geographical information systems (GIS) are a suitable tool for building models and interpreting the spatial relationships among different aspects of air pollution (Jumaah et al. Citation2019). In particular, for the investigation of air pollution, Least Squares (LS) regression model is used for global average estimation, whereas the geographically weighted regression (GWR) technique is highly practical in describing non-stationary spatial features (Zhou et al. Citation2019).
The proportion of toxic gases is growing in the air which results in serious diseases like carcinogenic diseases and other respiratory diseases. Many various studies confirm that Iraq is suffering from a health emergency due to the high incidence of carcinogenic diseases, most of which are attributed to air pollution. Therefore, this study aims to assess the air quality spatially in Iraq and evaluate the performance of LS and GWR models to estimate AQI based on PM2.5, PM10, NO2, and SO2 from June to September 2020. So we proposed an alternative strategy to observe AQI using GIS-based regression models depending on data collected by ground stations, remote sensing technology, and GIS-based geostatistical analysis. Afterward, assessing AQI equations for each predicted model thus, the estimated values will describe the AQI levels, and the predictor parameters describe the spatial variability of air contaminant concentration properly well.
Air contaminants tend to have high concentrations in the warm seasons, which makes consideration of seasonal changes crucial to managing air quality (Balogun et al. Citation2021). Iraq is characterized by very high temperatures in the summer exactly in July and August. Therefore, the impact of meteorology on pollution at peak times can be studied. This approach has a high potential to verify air quality, exposure to different pollutants, and their health effects based on different pollution sources obtained in locations and areas that are inaccessible or have few ground monitoring stations. We reckon this study can offer insights, into air pollution controlling management in Iraq.
2. The study area Iraq
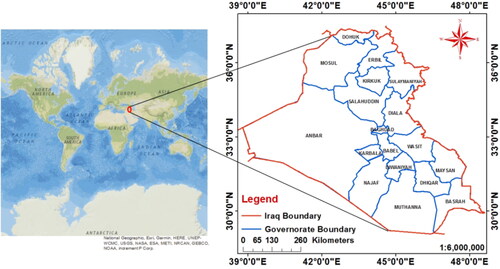
Relatively, the study area, Iraq is located in Western Asia. Geographically, it extends from 29° 5′ to 37° 22′ North latitudes and 39° 0′ to 48° 45′ East longitudes ().
Figure 1. The study area Iraq.
The total area of Iraq is about 438,317 km2. The largest city in Iraq is Baghdad, the capital of Iraq (Al-Quraishi & Negm, Citation2019). In Iraq, while the western and southern parts have much drier weather, the middle and southern parts have varying weather, extending from continental to arid. The mountains in the northern and northeastern parts have Mediterranean weather. The average temperature in winter is 16 °C. While, in summer, the climate is very hot where, whereas in July and August, the day temperatures reach over 43 °C but decrease to 26 °C at the night. Precipitations in Iraq extend from December to February. Sometimes, rainfalls extend in the northern and northeastern part’s from November to April (Hashim et al. Citation2021). Iraq’s air quality is contaminated extremely by contaminants emitted from various sources involving; automobiles, trucks, and power stations, and this contamination source is well known, it is oil and natural gas burning result (Kadhem et al. Citation2017).
The urban areas in Iraq are facing serious environmental problems, extending from air contamination to climate change impacts, low rainfall, water shortages, soil salinity, and water pollution that lead to the deterioration of the key ecosystems. It is thus important to go on studies and research on monitoring the contamination levels and apply models that estimate future levels.
3. Methodology
Along with the main tools for information managing and planning, GIS includes the analytical and statistical methods which have long been the basis of a Geographic Information System (Jumaah et al. Citation2019; Jumaah et al. Citation2022). The geographical distribution of environmental features is very useful in studying the causes of problems and developing prevention strategies. Due to the need for relevant information, interest is rising in tools for storing, managing, processing, and displaying different types of spatial data (Jumaah et al. Citation2019). Database management systems, statistical analysis packages, statistical models, image processing, and remote data transmission systems all have a role to play. However, linking different types of data, such as those related to the environment such as air pollution monitoring data is useful with Geographic Information Systems (GIS), where, ideally, these assorted tools and systems can be integrated (Jumaah et al. Citation2018).
This investigation is based on different categories of data; hourly air quality data, and meteorology for building models. Iraq climate data and historical hourly air quality information have been acquired from “The Global Air Quality” from an online open-source geo-database regarding air quality downloaded from the website; https://air-quality.com/place//6296425d?lang = en&standard = aqi_us.
Besides remotely sensed data which was used for validation. Remote sensing-based images have been downloaded from the NASA website by using the worldview application. represents remotely sensed data properties.
Table 1. Remotely sensed data properties.
Particles <2.5 µm consist of annual concentrations (µg per cubic meter) of ground-level PM2.5. This dataset groups AOD retrieval from multiple satellite instruments; MODIS the NASA Moderate Resolution Imaging Spectro-radiometer, MISR Multi-angle Imaging Spectro-Radiometer, and the SeaWiFS Sea-Viewing Wide Field-of-View Sensor. Sulphur dioxide SO2 data can be obtained from the Atmospheric Infrared Probe (AIRS), an instrument on board the Aqua satellite.
The average ground-level (NO2) grids from the GOM-2 retrieval satellite are a series of three-year consecutive NO2 average ground-level grids derived from the GOME Global Ozone Monitoring Experiment.
We first generated the models based on hourly AQI, PM2.5, PM10, SO2, and NO2 which were downloaded from the “The Global Air Quality” website. These data represent ground truth or ground station data. GIS-based spatial interpolation technique, Least Square Model, and Geographically Weighted Regression GWR gei-statistical model were adopted in this study.
The regressions were applied using Inverse Distance Weighted (IDW) results of each mentioned parameter. Then for testing and validation, we collected new data (remotely sensed data) of the same parameters from satellite images. The regression equation was applied again using remotely sensed data to calculate AQI based on remotely sensed data of (PM2.5, PM10, SO2, and NO2). So we called these newly calculated AQI estimated AQI based RS. The validation applied between AQI calculated from IDW results of ground station data (Estimated AQI) with the calculated AQI from remotely sensed data (Estimated AQI based RS).
represents the workflow. For spatial distributions, building models, and creating maps, ArcGIS 10.3 is used. The workflow involved; data collection, processing, and model prediction, and validation. Remotely sensed data were processed via ArcGIS-based ArcToolbox by converting raster to point in order to obtain the point data. Afterward, these data were used for spatial distribution map construction, and validation.
Figure 2. The workflow.
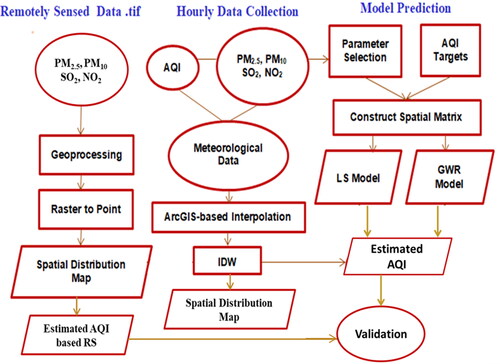
Moreover, Hourly data have been collected from ground stations. These data involved; AQI, PM2.5, PM10, SO2, and NO2 with meteorological data. Based on ArcGIS Toolbox via interpolation IDW method, the data was processed and a spatial distribution map was constructed. Then by constructing a spatial matrix, the LS and GWR models have been built and validation applied.
3.1. Gis-based interpolation processes
Spatial interpolation computes the value of points at positions that lack the sample value based on points of known values. It will be constructed based on spatial reliance, it measures the amount of correlation amongst close and distant points (Ajaj et al. Citation2017).
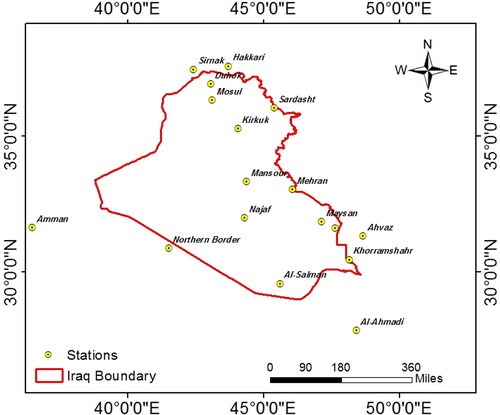
Here, the points layer is used as the input. The inputs should contain a numeric field to work as a base for the interpolation process. The interpolation tool is intended to work with points features that change slowly and gradually, such as temperatures and contaminations level, and is not proper for points that change very fast at short distances. We used hourly historical data of air quality data; AQI, PM2.5, and PM10, besides weather data of temperature and humidity. The spatial distribution maps have been constructed based on 17 stations along the study area ().
Figure 3. Ground stations.
Inverse Distance Weighted IDW geo-statistical process was adopted, to create the spatial distribution of AQI, PM2.5, PM10, temperature, and humidity. IDW is an ArcGIS interpolation tool that makes its performance more reliable based on its non-bias estimation (Tella and Balogun, Citation2021). After interpolation between sample points, the distribution maps have been created for each specified feature. The mathematical function of IDW interpolation is specified (Jumaah et al. Citation2019) in EquationEquation (1)(1)
(1) :
(1)
(1)
The function objective is to practice measurements i = 1, 2,…, n, set at point positions, to generate an estimate of the investigated value at a position,
where no values of observations at the location. Weights are generally attained by the inverse squared distance (exponent −2). Based on the equation,
is the distance by which the position s0 and the position
are separated.
In order to apply our models, we used some specific observations from IDW results. Exactly 40 points were picked randomly to build the models. These points represent the trained points. 70% of the data was used to construct models and 30% for accuracy evaluations. We depended on points obtained from images to evaluate the accuracy of our trained data.
3.2. Least Square LS processes
With the advancement of digital computers, statistical simulation models have become more achievable. The integration of GIS and environmental models is a clear, interesting, and promising development in environmental research. Proto-linear models, dynamics system applications to environmental problems, and even complex models have been developed. Mathematical models create an integration of existing knowledge in a logical context of rules, equations, and relationships to put together a representation of how the system works or behaves. Main process models include descriptions that define system behaviors with varying degrees of complexity. Simple linear regression LS is a generally used model in geographical and spatial analysis.
The function of least square (LS) for k independent feature is identified in EquationEquation (2)(2)
(2) (Tranmer & Elliot, Citation2008; Jumaah et al. Citation2019; Zhao et al. Citation2020):
(2)
(2)
Here, the is the dependent parameter that will be predicted,
identifies the independent variables,
identifies y-intercept which is a constant term,
are the slope coefficients for each independent variable, and
denotes the model error term. In our study in order to predict AQI by the LS method, we used the variables PM2.5, PM10, SO2, and NO2 as independent variables, thus AQI as the dependent variable. SO2 and NO2 themselves can be considered particulate matter, and also be photo-chemically transformed into another type of particulate matter. Identifying which variables are affected by multicollinearity and the power of the correlation can solve the multicollinearity problem. The Variance Inflation Factor (VIF) identifies a correlation between independent variables and the correlation strength. Statistically can calculate a VIF for each independent feature. VIFs begin at 1 and have no higher limit. The 1 value specifies that there is no correlation between one to another variable. While VIF from 1 and 5 refer to a moderate correlation. The VIFs of more than 5 refer to critical multicollinearity levels where questionable p-values and poor predictions will be.
3.3. Geographically Weighted Regression GWR processes
GWR is referring to the analysis of spatial variance relationships. Values in nearby geographic locations are likely to be correlated with each other through some specific spatial structure. The concept behind GWR is that variables can be predicted anywhere in a site-specific parameter-dependent and a set of one or more independent parameters that are recorded at sites for which position is known. The parameter surfaces predicted by GWR provide new sets of investigations on the general issue of feature changes and global information validity of behavior and also on the specific processes of the environment being investigated. Thus, by using it, it is possible to take into account local characteristics that were not known by a global approach. GWR EquationEquation (3)(3)
(3) is specified as (Jumaah et al. Citation2018; Zhao et al. Citation2020):
(3)
(3)
where y; is the dependent feature, x; is the independent feature, and
is the intercept,
is the slope coefficient, and
is the error term. In our study to predict AQI by the GWR method, we used the variables PM2.5, PM10, and NO2 as independent variables, thus AQI as the dependent variable.
4. Results
4.1. Resultant satellite maps
Based on the remote sensing images of PM2.5, SO2, and NO2, the resulting maps are shown in . Where shows a remotely sensed map of PM2.5. The PM2.5 concentrations are based on the MODIS image. The values of the spatial distribution of PM2.5 ranged between (0-99) μg/m3. represents a remotely sensed map of SO2. Spatial distribution of SO2 based on monthly concentrations of (Modern-Era Retrospective analysis for Research and Applications). The spatial distribution values of SO2 ranged between (0-35.005) μg/m3. represents the remotely sensed NO2 map. Spatial distributions of nitrogen dioxide are based on concentrations from GOME. The values of the spatial distribution of NO2 ranged from (0 to 6.918) μg/m3.
Figure 4. Spatial Distribution Maps of PM2.5 (a), SO2 (b), and (c) NO2.
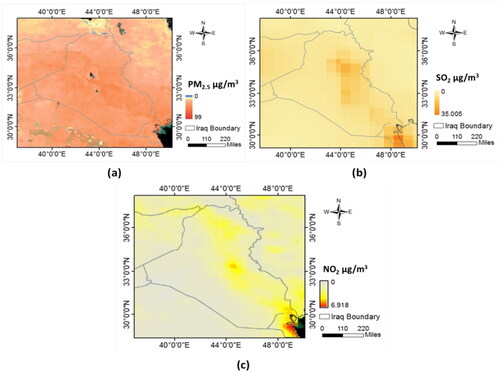
PM2.5 via remotely sensed image was within bad air quality. More regions ranged between 70 to 99 μg/m3, especially in the northwest and southeast parts of the country represented by unhealthy air. While other regions have some low pollution in terms of PM2.5 which is represented by unhealthy air for sensitive people. SO2 increased in the country center and some southwest parts while NO2 increased from northwest to southwest. No health issues with these increases.
4.2. Gis-based spatial interpolation results
The evaluation of air quality is made via , AQI breakpoints (Al-jarakh et al. Citation2021). represents AQI breakpoints where each pollutant has been represented with the permissible standard with color index and air quality descriptions. Moreover, represents the spatial distribution of the air quality, PM2.5, and PM10 in Iraq. The values for each contaminant were arranged as a category that ranged in specific colors from lower values to higher values. Processes resulting from the fulfilment of IDW from AQI, PM2.5, and PM10. Moderate to unhealthy AQI was concluded from the map of AQI spatial distribution. For PM2.5 the air was between good to unhealthy for sensitive people while PM10 ranged from good to unhealthy.
Figure 5. Spatial distribution of the air quality, PM2.5, and PM10 in Iraq.
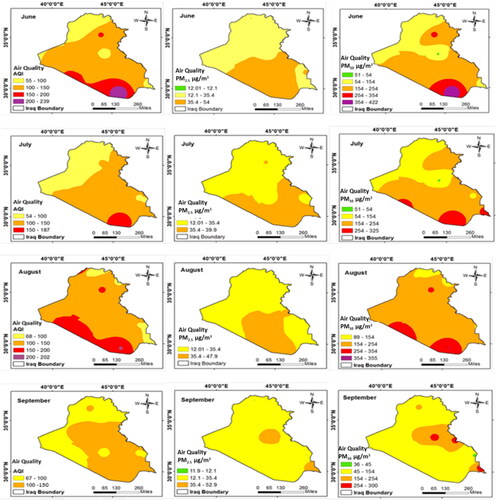
Table 2. AQI breakpoints.
In the same way, meteorological data were mapped. An IDW interpolation results map was generated for June-September temperature and humidity. represents the meteorological distribution map in Iraq from June to September 2020.
Figure 6. Spatio-temporal variation in temperature and humidity in Iraq (June to September 2020).
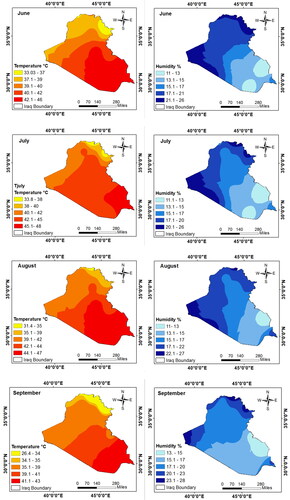
Based on and the period from June to September 2020, the air quality ranged as follows; AQI (54 to 239), PM2.5 (12.01 to 54), and PM10 (36 to 422). The description of air quality mostly ranged from moderate to unhealthy except in June and August due to the existence of very unhealthy air in the south. The PM2.5 values in the four months ranged from moderate to unhealthy for sensitive groups. Moreover, based on and the distribution of temperature and humidity in the same period of the study, the maximum temperature noticed in July and August by 48 °C and 47 °C respectively. The highest humidity was noticed in September by 28%. Otherwise, the humidity ranged from lower to higher values from south to north, except a small portion in the southeast has some raised humidity.
4.3. Least Squares LS model
Based on the conditions for building the regression models, the LS model was successfully built. represents the descriptive statistics generated by the LS model using hourly data from June to September 2020. The probability of all factors used in the model equation was less than 0.05. Also, The multiple R-value is equal to 0.94. The obtained R Square and Adjusted R Square were equal to 0.88 and 0.86 respectively. Moreover, the model was built with a standard error equal to 5.79. Besides, the estimated AQI ranged between (101.37 and 133.57). Air is unhealthy for sensitive groups. Furthermore, represents LS cross-validation. The resulting equation of the LS model is specified as EquationEquation (4)(4)
(4) ;
(4)
(4)
Figure 7. LS cross-validation.
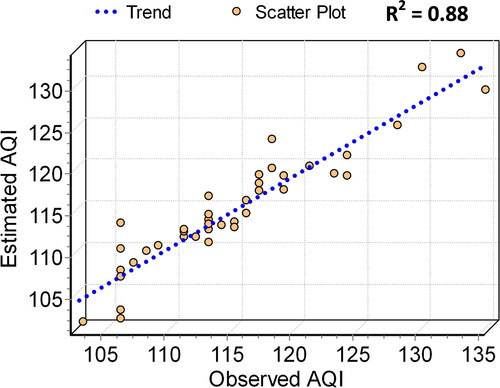
Table 3. Descriptive statistics generated by the LS model using hourly data.
4.4. Geographically Weighted Regression GWR model
The Estimated values of GWR were within (100.3 to 134.85). The air is described as moderate and unhealthy for sensitive groups. Moreover, the presented equation of GWR is specified as EquationEquation (5)(5)
(5) ;
(5)
(5)
Based on descriptive statistics generated by the GWR model using hourly data, R2 and R2 Adjusted are equal to 0.85, and 0.84 respectively. No correlation was obtained by SO2 in the GWR model so SO2 was out of the equation. represents GWR cross-validation.
Figure 8. GWR cross-validation.
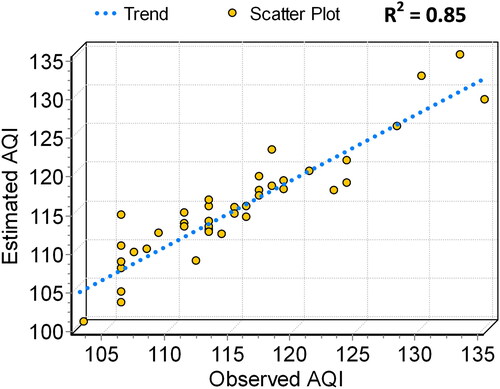
Table 4. Descriptive statistics generated by the GWR model using hourly data.
4.5. Accuracy evaluation results
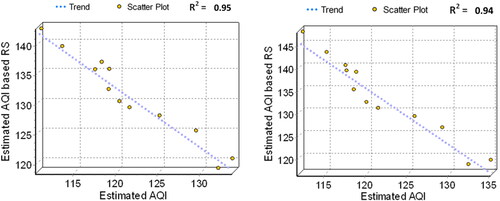
To test the acquired models, we applied accuracy ratings to both models using remote sensing data. We used the same equations to calculate the AQI at some specific points in the study area and then validated the models again using 30% of our observations. The accuracy evaluation results are shown in . Where the accuracies that were obtained were 95% and 94% for LS and GWR, respectively. This indicates how well the models can describe the variances. Here the relationships were negative due to the regression slope being negative. This means that (Estimated AQI) values increase when (Estimated AQI based RS) is decreased and vice versa.
Figure 9. Accuracy evaluation of; (a) LS model, and (b) GWR model.
5. Discussion
As presented from the results, the air quality is within the bad and unhealthy type of air. Based on the concentrations of PM2.5 showed bad air in the study area. However, the same air quality is shown in based on the spatial distribution of the historical data ranging between moderate to unhealthy for sensitive groups. Also, no health issues based on SO2, and NO2 remotely sensed images. The values are within good and healthy air types.
Otherwise, the hourly statistics of SO2 included some polluted values in some locations. Based on an Environmental Protection Agency EPA (from the table set by National Ambient Air Quality Standards NAAQS), https://www.epa.gov/criteria-air-pollutants/naaqs-table, NO2 was within standards but SO2 was not. Our records of NO2 ranged between (17- 93) µg/m3 and, SO2 ranged between (57-240) µg/m3.
For SO2 1 ppb is equal to 2.62 µg/m3 and for NO2 1 ppb is equal to 1.88 µg/m3 https://www2.dmu.dk/AtmosphericEnvironment/Expost/database/docs/PPM_conversion.pdf. Based on Shihab (Citation2021) SO2 and NO2 have a lower contribution to AQI with health impacts moderate to unhealthy. Based on the air quality is shown as unhealthy in the southeast and a small portion in the north of Iraq. The unhealthy air is exactly shown in Muthanna, Najaf, Anbar, Basrah, Baghdad, Wasit, and Kirkuk governorates. Hamed et al. (Citation2021) concluded the unhealthy air in Kirkuk. But the very unhealthy air was absolutely in Muthanna Governorate. shows high temperatures in the study area in the period of June to September 2020. Iraq suffers from high degrees of temperatures in summer sometimes, exceeding 50 °C. In this study, the temperatures ranged from low in the north to high degrees in the south of Iraq. Otherwise, the humidity ranged as high percentages in the northern parts with low rates in the southern parts. It’s known that high temperature and humidity correlate with air quality. High humidity increases the rate of harmful or toxic chemicals in the air.
As a result, that reduces air quality. In addition, microbial and viral organisms, which cause respirational infection also increase due to high and low humidity. Thus, low humidity as well results in airborne germs. High humidity and associated high temperatures are a combination that can be dangerous to health, especially to the very young and the elderly. According to reports, people are most comfortable when the relative humidity is between 20 and 60%, and the average recommended relative humidity indoors is usually 30 to 50%.
Understanding and forecasting the properties of air pollution is intricate due to the many different pollutants such as PM, NO2, and SO2, and their accumulative impacts and correlations with weather parameters, like temperature and humidity.
Creating models and linking spatial relationships have an impact on evaluating these pollutants and the extent of the relationships between them and exposure in different weather conditions.
Furthermore, from , the cross-validation of the obtained models shows high trends. The accuracy of estimating was determined as 88% and 85% for LS and GWR models respectively. A high description of variability can be obtained by the equations. Where estimated values are in the air range of moderate and unhealthy for sensitive groups.
Based on , the accuracy ratings of models have resulted in significant accuracies confirming the models well performance.
A better understanding of these continents as pollution in the air is highly important because these are most harmful to human health. The results of the study can assist decision-makers to develop more targeted air pollution regulations plans to protect human health and life.
6. Conclusion
The study concludes that the introduction of motorized vehicles and the increasing population are all contributing factors towards the increasing problem of air pollution. At this point, it is necessary to find ways to clean the air.
In this study, the hourly historical records of AQI, PM2.5, and PM10, have been used in order to show the air pollution in Iraq from June to September 2020. In addition remotely sensed data is used to show the spatial distribution of air quality for some pollutants such as SO2, NO2, and PM2.5. It is also concluded from the results of the pollutant distribution maps approved the poor air quality of Iraq from June to September 2020. AQI was in the range of moderate to very unhealthy air. PM2.5 levels ranged from good to unhealthy for some people who suffer from respiratory diseases. While PM10 resulted in good to very unhealthy air quality. Generally, the overall air quality in Iraq during this period is considered unhealthy air and causes health effects. Based on satellite images, the PM2.5 values were within bad air quality but had no health impact based on SO2 and NO2. Also, two statistical regression models have been developed and validated to estimate AQI. Regression coefficients resulted in R Square equal to 0.88 and 0.85 for LS and GWR models respectively. Models performance has resulted in 95% and 94% for LS and GWR respectively. The predicted values of AQI by the models are described as moderate air quality to unhealthy air quality for sensitive groups. The main air contaminants that exist in urban regions are CO2, NO2, SO2, hydrocarbons, and PM. These contaminants gradually result in severe health effects. Serious health problems can occur quickly when high concentrations of air pollutants are present. It is noteworthy that cytotoxicity may cause many cancers in the long term, and on the other hand, a small number of toxic substances may significantly affect the elderly, children, and those suffering from respiratory and heart diseases. According to research and studies, the main effects are mainly on the respiratory system, heart, eyes, skin, and others. The provided results and information from this study, imposes on the Iraqi and local governments to implement a strategic plan for the reduction of some pollutants emissions to avoid the general risks associated with air pollution.
Acknowledgment
We thank the anonymous reviewers for their valued notes on the previous version of the manuscript, which contributed to the improvement of this paper. The authors acknowledge the usage of the NASA Satellite imageries from the Worldview application and the use of historical hourly data from Air-Matters.
Disclosure statement
No potential conflict of interest was reported by the authors.
Data availability statement
The data used in this study are obtained from online sources via links; https://air-quality.com/country/iraq/6296425d?lang=en&standard=aqi_us, and https://go.nasa.gov/3zb30zr.
Additional information
Funding
References
- Abdulkadhim A, Dahlan NHM, Rahman RA. 2017. Air pollution and its governing legal administrative mechanisms in Iraq. JL Pol’y & Globalization. 62:82–88.
- Ajaj QM, Pradhan B, Noori AM, Jebur MN. 2017. Spatial monitoring of desertification extent in western Iraq using Landsat images and GIS. Land Degrad Develop. 28(8):2418–2431.
- Al-Hasnawi SS, Hussain HM, Al-Ansari N, Nutsson SK. 2016. The effect of the industrial activities on air pollution at Baiji and its surrounding areas, Iraq. ENG. 08(01):34–44.
- Al-Jarakh TE, Hussein OA, Al-Azzawi AK, Mosleh MF. 2021. June. Design and implementation of IoT based environment pollution monitoring system: a case study of Iraq. In IOP Conference Series: Materials Science and Engineering (Vol1105, No. 1, p. 012037). IOP Publishing.
- Almetwally AA, Bin-Jumah M, Allam, A, A. 2020. Ambient air pollution and its influence on human health and welfare: an overview. Environ Sci Pollut Res Int. 27(20):24815–24830.
- Al-Quraishi AMF Negm, A, M. 2019. Environmental remote sensing and GIS in Iraq, Springer, Cham: Springer-Water.
- Al-Salman AA, TaghiEbadi RM. 2021. Mitigation Strategies for Reducing of Air Pollutant, Case Study: al-Hilla City-Babylon Province/Iraq. Annals of the Romanian Society for Cell Biology. 25(4):7460–7469.
- Alvarez-Mendoza CI, Teodoro AC, Torres N, Vivanco V. 2019. Assessment of remote sensing data to model PM10 estimation in cities with a low number of air quality stations: a case of study in Quito, Ecuador. Environments. 6(7):85.
- Ameen MH, Jumaah HJ, Kalantar B, Ueda N, Halin AA, Tais AS, Jumaah SJ. 2021. Evaluation of PM2. 5 Particulate Matter and Noise Pollution in Tikrit University Based on GIS and Statistical Modeling. Sustainability. 13(17):9571.
- Balogun AL, Tella A, Baloo L, Adebisi N. 2021. A review of the inter-correlation of climate change, air pollution and urban sustainability using novel machine learning algorithms and spatial information science. Urban Clim. 40:100989.
- Chaichan MT, Kazem HA, Abed TA. 2018. Traffic and outdoor air pollution levels near highways in Baghdad, Iraq. Environ Dev Sustain. 20(2):589–603.
- Cheng W-L, Chen Y-S, Zhang J, Lyons TJ, Pai J-L, Chang S-H. 2007. Comparison of the revised air quality index with the PSI and AQI indices. Sci Total Environ. 382(2-3):191–198.
- Chudnovsky AA, Koutrakis P, Kostinski A, Proctor SP, Garshick E. 2017. Spatial and temporal variability in desert dust and anthropogenic pollution in Iraq, 1997–2010. J Air Waste Manag Assoc. 67(1):17–26.
- Farahani VJ, Arhami M. 2020. Contribution of Iraqi and Syrian dust storms on particulate matter concentration during a dust storm episode in receptor cities: case study of Tehran. Atmos Environ. 222:117163.
- Hamed HH, Jumaah HJ, Kalantar B, Ueda N, Saeidi V, Mansor S, Khalaf ZA. 2021. Predicting PM2. 5 levels over the north of Iraq using regression analysis and geographical information system (GIS) techniques. no. Geomatics Nat Hazards Risk. 12(1):1778–1796.
- Hashim BM, Al-Naseri SK, Al Maliki A, Sa’adi Z, Malik A, Yaseen ZM. 2021. On the investigation of COVID-19 lockdown influence on air pollution concentration: regional investigation over eighteen provinces in Iraq. Environ Sci Pollut Res. 28(36):50344–50362.
- Jumaah HJ, Kalantar B, Halin AA, Mansor S, Ueda N, Jumaah SJ. 2021. Development of UAV-Based PM2.5 Monitoring System. Drones, Vol. 5(3):60.
- Jumaah HJ, Ameen MH, Kalantar B, Rizeei HM, Jumaah SJ. 2019. Air quality index prediction using IDW geostatistical technique and OLS-based GIS technique in Kuala Lumpur, Malaysia. Geomatics Nat Hazards Risk. 10(1):2185–2199.
- Jumaah HJ, Ameen MH, Mohamed GH, Ajaj QM. 2022. Monitoring and evaluation Al-Razzaza lake changes in Iraq using GIS and remote sensing technology. The Egyptian Journal of Remote Sensing and Space Science. 25(1):313–321.
- Jumaah HJ, Mansor S, Pradhan B, Adam SN. 2018. UAV-based PM2.5 monitoring for small-scale urban areas. International Journal of Geoinformatics. 14(4):61–69.
- Kadhem JA, Reza KS, Ahmed WK. 2017. Alternative fuel use in Iraq: a way to reduce air pollution. EJERS. 2(5):20–30.
- Li J, Garshick E, Hart JE, Li L, Shi L, Al-Hemoud A, Huang S, Koutrakis P. 2021. Estimation of ambient PM2. 5 in Iraq and Kuwait from 2001 to 2018 using machine learning and remote sensing. Environ Int. 151:106445.
- Liu Y, Tian J, Zheng W, Yin L. 2022. Spatial and temporal distribution characteristics of haze and pollution particles in China based on spatial statistics. Urban Clim. 41:101031.
- Luo H, Guan Q, Lin J, Wang Q, Yang L, Tan Z, Wang N. 2020. Air pollution characteristics and human health risks in key cities of northwest China. J Environ Manage. 269:110791.
- Mirzaei M, Bertazzon S, Couloigner I. 2019. OLS and GWR LUR models of wildfire smoke using remote sensing and spatiotemporal data in Alberta. Spatial Knowledge and Information Canada. 7(2):3.
- Nafarzadegan AR, Ebrahimi-Khusfi Z, Kazemi M. 2021. ‘ Spatial characterization of dust emission prone arid regions using feature extraction and predictive algorithms. Appl Geogr. 133:102495.
- Rabee AM. 2015. Estimating the health risks associated with air pollution in Baghdad City, Iraq. Environ Monit Assess. 187(1):4203–4212.
- Rasul A, Ibrahim GRF, Hameed HM, Tansey K. 2021. A trend of increasing burned areas in Iraq from 2001 to 2019. Environ Dev Sustain. 23(4):5739–5755.
- Shihab AS. 2021. Assessment of ambient air quality of Mosul city/Iraq via Air Quality Index. J Ecol Eng. 22(10):241–250.
- Somvanshi SS, Vashisht A, Chandra U, Kaushik G. 2019. Delhi air pollution modeling using remote sensing technique. In: hussain C. (eds) Handbook of Environmental Materials Management. Springer, Cham, pp.p. 1–27.
- Tella A, Balogun AL. 2021. Prediction of ambient PM10 concentration in Malaysian cities using geostatistical analyses. Journal of Advanced Geospatial Science & Technology,. 1(1):115–127. https://jagst.utm.my/index.php/. jagst/article/download/9/7.
- Tella A, Balogun AL, Adebisi N, Abdullah S. 2021. Spatial assessment of PM10 hotspots using Random Forest, K-Nearest Neighbour and Naïve Bayes. Atmospheric Pollution Research,. 12(10):101202.
- Tranmer M, Elliot M. 2008. Multiple linear regression. The Cathie Marsh Centre for Census and Survey Research (CCSR), Vol. 5(5, no):1–5.
- Wang D, Wei S, Luo H, Yue C, Grunder O. 2017. A novel hybrid model for air quality index forecasting based on two-phase decomposition technique and modified extreme learning machine. Sci Total Environ. 580:719–733.
- Wu Q, Lin H. 2019. Daily urban air quality index forecasting based on variational mode decomposition, sample entropy and LSTM neural network. Sustainable Cities and Society. 50:101657.
- Zhang Z, Zeng Y, Yan K. 2021. A hybrid deep learning technology for PM 2.5 air quality forecasting. Environ Sci Pollut Res. 28(29):39409–39422.
- Zhao C, Jensen J, LR, Weaver R. 2020. Global and Local Modeling of Land Use Change in the Border Cities of Laredo, Texas, USA and Nuevo Laredo, Tamaulipas, Mexico: a Comparative Analysis. Land. 9(10):347.
- Zhou Q, Wang C, Fang S. 2019. Application of geographically weighted regression (GWR) in the analysis of the cause of haze pollution in China. Atmos Pollut Res. 10(3):835–846.