?Mathematical formulae have been encoded as MathML and are displayed in this HTML version using MathJax in order to improve their display. Uncheck the box to turn MathJax off. This feature requires Javascript. Click on a formula to zoom.
Abstract
In 2014, the State of Telangana in southern India began repairing and restoring more than 46,000 irrigation water tanks (artificial reservoirs) under the Mission Kakatiya project with an investment in excess of USD 2 billion. In this study, we attempted to map the temporal changes that have occurred in cropland areas and water bodies as a result of the project, using remote sensing imagery and applying land use/land cover (LULC) mapping algorithms. We used 16-day time series data from Landsat 8 to study the spatial distribution of changes in water bodies and cropland areas over the 2013–18 period. Ground survey information was used to assess the pixel-based accuracy of the Landsat-derived data. The areas served by these tanks were identified on the basis of training data and Random Forest algorithms using Google Earth Engine. Our spatial analysis revealed a substantial increase in cropped area under irrigation and expansion of water bodies over the study period. We observed a 20% increase in total tank area in 2017–18 and total cropland and irrigated area expansion of the order of 0.6 M ha and 0.2 M ha, respectively. A comparison of ground survey data and four LULC classes derived from Landsat temporal imagery showed an overall accuracy of 87%, significantly correlated with national agriculture statistics. Periodic monitoring based on remote sensing has proved to be an effective method of capturing LULC changes resulting from the Mission Kakatiya interventions. Higher-resolution satellite data can further improve the accuracy of estimates.
1. Introduction
Artificial water bodies, called irrigation tanks, are a significant source of irrigation in southern India, particularly Telangana State (Got Citation2021). These are large rainwater harvesting ponds that cater to the irrigation needs of croplands downstream. They provide multiple services such as irrigation of croplands, drinking water supply to rural and urban communities and livestock, fisheries, recharge of groundwater and flood control, to name a few (Renault et al. Citation2013). The benefits of irrigation tanks have been known in Telangana since the Kakatiya dynasty (1000–1323 AD) which built some of the oldest tanks in the region (Rao Citation1995, Kadapala et al. Citation2020). In addition to irrigation and drinking water supply, they also serve as flood moderators when there is heavy rainfall and as a mitigating mechanism during droughts (Davenport et al. Citation2020). Tanks also play a significant role in the sociocultural fabric of village communities; they are less capital-intensive and more widely distributed geographically than large irrigation projects and are more suitable for decentralized water management.
However, over time, the capacity of many of these irrigation tanks, especially the smaller and medium-sized ones, to provide these services dwindled due to poor maintenance, misuse and urbanization (Nag Citation2011). In 2014, the Government of Telangana (GoT) took up a State-led initiative named Mission Kakatiya to restore 46,531 tanks in 5 years, at the rate of 9,350 a year (Mkp Citation2021). The overall objective of Mission Kakatiya is to conserve water, enhance minor medium-sized irrigation infrastructure and strengthen community-based irrigation management.
Agricultural land use is dependent on the spatial distribution and performance of irrigation tanks located in the region. Conventional surveys and management of tanks and associated agricultural practices in the command area have made a technological leap to help decision-makers take quick action and prevent losses (Thiruvengadachari Citation1981, Shoushtarian and Negahban-Azar Citation2020, Van Vliet et al. Citation2021). Studies have reported efficient use of multi-spectral and multi-temporal data to map irrigated areas, LULC classes and crop types across diverse locations (Thenkabail et al. Citation2005, Velpuri et al. Citation2009, Qiu et al. Citation2017). Remote sensing is one such technology-driven tool that can produce accurate results economically. Satellite imagery, available at high temporal and spatial resolution, is specifically well-suited to application in agriculture (Atzberger Citation2013, Inglada et al. Citation2015). Information on spatial distribution of irrigation tanks and temporal changes in land-use can help decision-makers in preparing efficient plans for sustainable tank irrigation management.
Periodic monitoring of croplands is important for sustainable agricultural development and food security (Belgiu and Csillik Citation2018). Researchers have used the MODIS normalized difference vegetation index (NDVI), the land and surface water index (LSWI), the enhanced vegetation index and time series satellite data to map agricultural areas (Boken et al. Citation2004, Biggs et al. Citation2006, Gaur et al. Citation2008, Pervez and Brown Citation2010, Gumma et al. Citation2011, Murthy Reddi et al. Citation2017, Chen et al. Citation2018, Xiang et al. Citation2019) and seasonal changes in cropped area (Sakamoto et al. Citation2005). Some studies have used radar satellite imagery, both optical and radar satellite imagery, to map irrigated areas by identifying backscattering signals (Bousbih et al. Citation2018, Gao et al. Citation2018, Bazzi et al. Citation2019, Demarez et al. Citation2019, Orynbaikyzy et al. Citation2019, Pageot et al. Citation2020). Several cropland studies have successfully used time series satellite imagery with automated and semi-automated techniques at large scale over different time periods (Begue et al. Citation2014, Xiong et al. Citation2017, Gumma et al. Citation2022a). Data on land-use changes are important to understand and make decisions on cropping patterns and crop types (Singh Citation1989, Lu et al. Citation2004, Midekisa et al. Citation2017, Xiong et al. Citation2017). Many techniques and methods have been used to map irrigated areas, mainly index-based decision-tree irrigation models (Meier et al. Citation2018) and machine learning algorithms (Ferrant et al. Citation2017) as well as soil moisture signals (Kerr et al. Citation2016).
The present study proposes to map LULC changes in Telangana due to expansion of water bodies and irrigated areas during the 2013–2018 period, using 16-day time series imagery from Landsat 8. It would be interesting to understand the impact of Mission Kakatiya over this period. We made a systematic effort to map changes using high-throughput RS/GIS tools. Further, accuracy assessment was carried out using available ground survey data. The results were also compared and validated with subnational statistics provided by the Directorate of Economics and Statistics (DES) of the Government of Telangana.
2. Study area
Telangana is the 12th largest state in India in terms of both geographical area and population. It lies between 15°46′ and 19°47′ N latitude and 77°16′ and 81°43′ E longitude, and shares borders with the state of Maharashtra to the north and northwest, Karnataka to the west, Chhattisgarh to the northeast and Andhra Pradesh to the south and east. The State is located in a semi-arid zone of the Deccan Plateau in southern India (). The net agricultural cropped area occupies about 39.1% of the total geographical area of Telangana (). The long-term average annual rainfall is 713 mm, falling in a range of 700 mm to 1500 mm, 80% of which comes from the southwest monsoon and the rest from the northeast monsoon (Mospi Citation2016). The State has a tropical climate with slight variation depending on elevation, maritime influences and rainfall, which in turn influences the cropping pattern.
Figure 1. A map of Telangana showing the major rivers, districts and ground survey data.
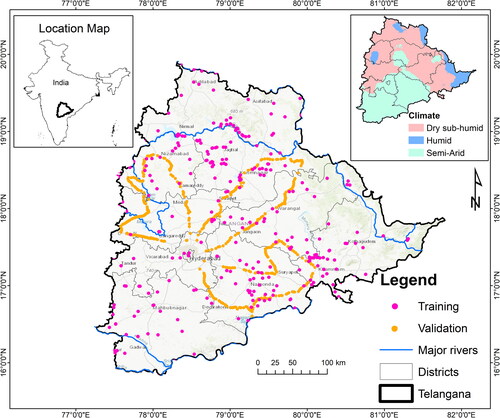
Table 1. Details of land use/land cover and irrigation tanks in Telangana, 2018.
Telangana is drained by several major and minor rivers with two major interstate river basins, the Godavari and the Krishna. They irrigate most of the area of the State and also supply water for domestic and commercial use. Apart from these two major rivers, nine small rivers (Bhima, Dindi, Kinnerasani, Manjeera, Manair, Penganga, Pranahita, Peddavagu and Taliperu) flow in the State. Telangana is reported to have lost nearly 0.29 million ha of tank-irrigated area during the 53-year period 1956–2009 due to human encroachments in the catchment and command areas of water bodies leading to land-use conversion (Pingle Citation2011).
3. Data and materials
3.1. Satellite imagery
We imported Landsat 8’s Operational Land Imager (OLI) top-of-atmosphere (TOA) satellite sensor data (cloud-free, 30 m resolution, 16-day time series) from Google Earth Engine (GEE). The data covered the rainy (kharif, Jun-Nov), post-rainy (Nov-Mar) and summer (Mar-Jun) seasons of the 2013–2018 period and were ortho-rectified and corrected for solar angle (USGS TOA product guide). The imagery consisted of seven broad bands (). It was not possible to get continuous 16-day cloud-free time series data for some months. All Landsat images retrieved from the GEE image collection have TOA reflectance values and one additional band called the quality assessment band (BQA). We used the cloud flag included in the BQA nominal product to remove the clouds (Scaramuzza et al. Citation2011) with a 20% threshold. To ensure cloud-free images, monthly mean composites (depending on the cloudiness of the selected region) were composed.
Table 2. Satellite image characteristics, image acquisition date and secondary data.
3.2. Ground data
Ground survey information was collected from 1,050 locations from the 14th to 22nd October, 2017 (; ) on the following characteristics: (a) geographical coordinates using GPS; (b) crops; (c) cropping intensity (monsoon, winter and summer) based on interviews with agricultural extension officers and farmers; (d) cropping patterns (crop combinations); (e) area scale (small, medium and large); (f) land cover categories (including trees, shrubs, grasses, water bodies and hills); and (g) landscape features. Sources and seasonality of irrigation were also noted at each location. The purpose of this exercise was to identify land-use classes accurately during the classification process and also to assess the accuracy of the final maps.
Figure 2. The method and approach used for assessing the impact of Mission Kakatiya in Telangana State of India.
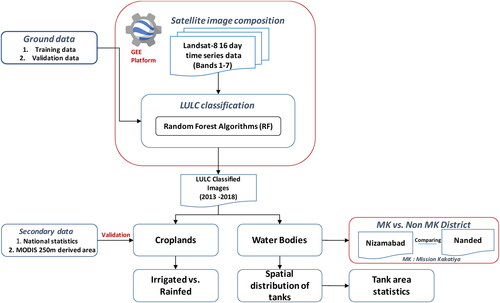
Table 3. Class-wise training and validation points.
As the spatial resolution of Landsat 8 is 30 m on each side, a minimum sampling unit of 90 m × 90 m (3 × 3 pixels of Landsat) was selected for ground data validation. The locations for ground data collection were selected based on their homogeneity and road access, the emphasis being on representativeness of the sample location in relation to the LULC classes and precise geo-location of the pixel. The LULC class names were assigned using a labeling protocol (Thenkabail et al. Citation2009, Gumma et al. Citation2014). Ground data were also collected from Google Earth Engine with the help of temporal high-resolution imagery ().
3.3. Agricultural census data
District-level crop data on agriculture, including source-wise irrigation data, were obtained from the Department of Economics and Statistics of the Government of Telangana. District-level statistics were computed based on sub-district/block-level data collected by agricultural extension officers.
4. Methodology
illustrates the approach and methodology we used to assess the LULC pattern with a view to capturing the influence of Mission Kakatiya interventions in the study area.
4.1. Processing of satellite data and LULC classification
4.1.1. Data composition
The entire process of LULC classification was carried out on the GEE platform. We used Landsat 8 as it has high spectral calibration data and provides guaranteed data in high spatial (30 m) and temporal resolution. We preferred TOA images to surface reflectance (SR) images due to low availability of the latter on the GEE platform (Foga et al. Citation2017). The imagery was stacked for the rainy (kharif), postrainy and summer seasons (mean of every 16 days, cloud-free) of every year (giving three season images per year). For example, for the rainy season from June to November, all the cloud-free images from that period were reduced to a single mean composite. The same procedure was conducted for the other seasons. Then, yearly imagery was generated from the stacking of the three seasonal images and clipped to the study area.
4.1.2. Data training
For LULC classification, initially six classes (barren, irrigated cropland, rainfed cropland, non-cropland, settlements and water bodies) of training random sample points were created with the help of ground data and through visual interpretation of temporal very high-resolution imagery (VHRI) for the period 2013–2018. We chose training points from areas where there was continuity of land use from 2013 to 2018 so that the machine can learn to identify such areas. Utilizing the same ground data for all the study years, we used more than 30 sample points for each class. For a class like water bodies, 30 sample points are sufficient to extract, but for other classes, especially croplands, we used more than 100 samples.
After training with the sample points, we applied the Random Forest classifier (RFC) (Liaw and Wiener Citation2002) on yearly composite imagery to get LULC-classified images. Then the six-class LULC images were further reclassified into four classes (irrigated cropland, rainfed cropland, water bodies and non-cropland) for a better understanding of changes relating to croplands and water bodies, the focus of our study. Each class has a different signature in each band. Especially, croplands are easily distinguishable from non-cropland as dynamic changes from sowing to harvesting can be observed in them whereas the pattern and sequence of changes is different in the non-cropland class. As for water bodies, they have the same signature throughout the season.
Details of the spatial distribution of LULC classes over the 2013–2018 period are presented in . In order to test the classifier accuracy, an accuracy assessment test was carried out using ground truth validation points.
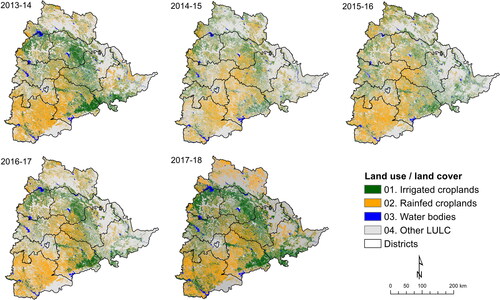
Figure 3. Spatial and temporal distribution of land use/land cover classes in Telangana.
4.2. Accuracy assessment and change detection of LULC classes
Out of the 1,050 ground sample points, we used 502 ground validation points to assess the accuracy of the mapped cropland area by generating an error matrix (). The columns of the error matrix represent the actual field information (ground data) and the rows of the error matrix correspond to a class in the LULC map (Congalton Citation1991). The error matrix is a multi-dimensional table with cells containing changes from one class to another. The statistical approach to accuracy assessment consists of different multivariate statistical analyses. Finally, kappa, which is designed to compare results from different regions or classifications, is measured (Cohen Citation1960). Each field-plot point was verified with an actual resultant LULC map (Gallego Citation2004). The overall classification accuracy was computed as a diagonal point divided by the total number of points.
Table 4. Land use/land cover area (ha) in Telangana from 2013 to 2018.
Change detection analysis was carried out to assess the LULC changes occurring from 2013 to 2018 due to the impact of Mission Kakatiya interventions. The final classified maps were used for change detection in relation to the 2013–14 LULC map. EquationEquation 1(1)
(1) was used to assess the changes from 2013–14 to 2014–15, 2015–16, 2016–17 and 2017–18. Changes were measured class-wise, for example, other LULC classes and agricultural lands based on 2013 is converted to other LULC.
(1)
(1)
where
is the change detection,
is the LULC for the ith year and
is the LULC for the jth year
4.3. Comparison of Landsat 30 m imagery with regional statistics and MODIS 250 m
The LULC map we generated showed irrigated croplands, rainfed croplands, water bodies and other LULC classes. Irrigated and rainfed cropland areas were extracted at the district level in order to relate them to district-level statistics produced by the state agriculture administration and the MODIS 250 m derived product. Yearly national statistical data, i.e. area irrigated and rainfed, was collected from the agricultural census (2013–2014) for cropland validation. Changes in water bodies were also monitored along with their sizes, and correlated with rainfall patterns.
We also used the land-use statistics of a neighboring area (Nanded in Maharashtra state) that had no Mission Kakatiya interventions so as to validate and assess the changes occurring in one of our study districts, Nizamabad in Telangana state.
5. Results and discussion
5.1. Spatio-temporal distribution of LULC changes
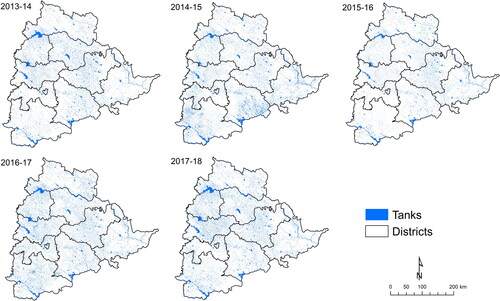
shows the spatio-temporal distribution of LULC classes in Telangana for the period 2013–2018. The southern part of the State shows rainfed cropland while central Telangana is mostly covered with irrigated areas, except in 2014–15 and 2015–16. There is a significant increase in the area covered by water bodies, from 294,748 ha in 2013–14 to 355,464 ha in 2017–18. We see a positive impact on irrigated cropland areas, up 7% from 2,060,890 ha in 2013–14 to 2,200,256 ha in 2017–18 (). The spatial distribution of water bodies is shown in .
Figure 4. Spatial and temporal distribution of water bodies in Telangana from 2013 to 2018.
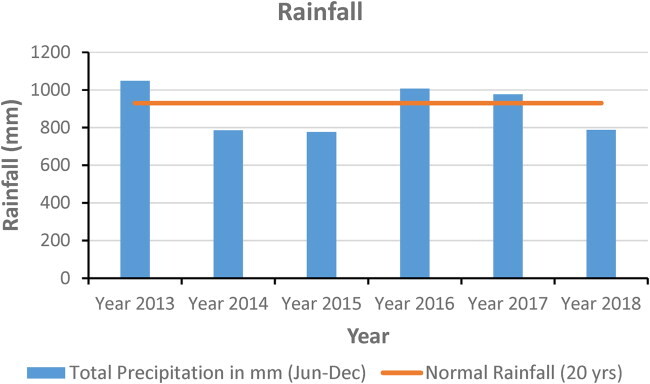
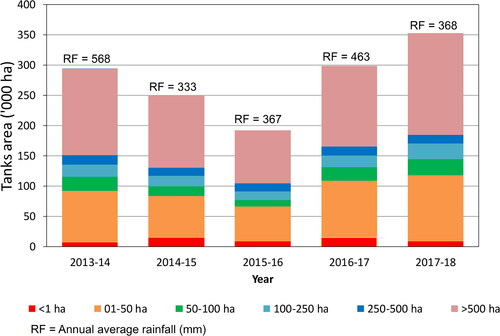
clearly depicts the increase in irrigated and cropland areas over the five years, and the sharp increase in area covered by water bodies from 2015–16 to 2016–17. This was synchronous with an increase in the total number of irrigated tanks rejuvenated during 2016–17 () as well as a good quantum of precipitation and its distribution that year. shows the area of irrigation tanks for all the study years in relation to the rainfall that year.
Figure 5. Temporal comparison of cropland area, irrigated area and water bodies in Telangana during 2013–2018.

Figure 6. Category-wise area of irrigation tanks and average annual rainfall (June to Oct) during 2013–18.
5.2. Comparison of cropland area derived from landsat, agriculture statistics and MODIS
The MODIS 250 m maps were derived from MODIS NDVI time series data. The time series composites were combined with ground data and spectral matching techniques to classify irrigated and rainfed croplands and other LULC classes. The 16-day composites from the daily acquisitions were then combined to make a time series dataset for a crop year. This provides a temporal profile of the crop-growing locations at the start of a season, during peak growth stage and on the harvest date of each season. The value of NDVI as a function of time also helps in identifying the type of crop in an eco-region based on certain peak thresholds for that crop. Our study applied a spectral matching technique, which is ideal for mapping irrigated areas (Thenkabail et al. Citation2007) and rice areas. The irrigated area fractions from coarse-resolution imagery were estimated at the sub-pixel level by multiplying the full-pixel area by the cropped-area fraction (Thenkabail et al. Citation2005, Gumma et al. Citation2011). However, classification with MODIS data has a greater possibility of producing mixed classes as the 250 m resolution, i.e. 6.5 ha, can lead to over- or underestimations of area. The risk of mixed classes is much less with high-resolution data.
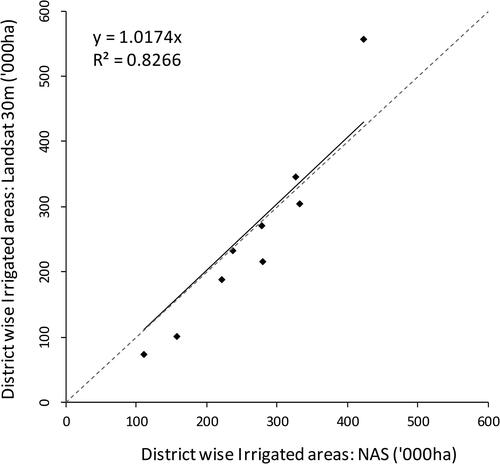
The sub-district statistical values of cropland and irrigated areas derived from satellite data were collated and compared with national agricultural statistics (NAS) across nine Telangana districts (). correlates Landsat 30 m data-derived irrigated area with NAS, showing a synchronous pattern for these districts and shows a strong correlation (R2 value 0.8).
Figure 7. Irrigated areas derived from Landsat 30 m and MODIS 250 m data compared with agricultural census data (NAS) in nine Telangana districts for the year 2013–14.
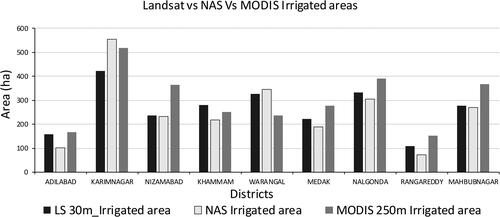
Figure 8. Correlation of Landsat 30 m-derived irrigated area with national statistical (NAS) data, 2013–14.
5.3. Accuracy assessment
To ascertain whether or not a known LULC class was correctly classified, we conducted a quantitative accuracy assessment based on the error matrix using ground survey data (which was not used in the LULC classification) for the year 2017–18. shows the error matrices for the 2017–18 classification. Accuracy was assessed using 502 ground survey locations. The rows are ground survey classes and the columns are land-use classes drawn from the classified images (). We found that the overall classification accuracy at 87%. User accuracy varied from 71% to 100% across the four LULC classes. Thus, combining all crop classes into one, the accuracy of croplands was very high (about 90%). The uncertainty of about 10% was due to inter-mixing among the classes.
Table 5. Accuracy assessment for the year 2017–18.
5.4. Discussion on LULC
Satellite remote sensing has been used extensively for LULC mapping at various scales (Tateishi et al. Citation2011, Gumma et al. Citation2018). Advances in remote sensing imagery and associated techniques have led to an increase in the use of these maps for specific applications. Mapping and monitoring of agricultural areas require special techniques as they have to reckon with seasonal changes (Pérez-Hoyos et al. Citation2017). Temporal variations in the NDVI patterns obtained for irrigated land-use classes enable a demarcation between (a) surface water-irrigated double-crop; (b) surface water-irrigated continuous crop; and (c) groundwater-irrigated mixed crops, etc. In our study, the question of cropping pattern was addressed by using season-specific time compositing of multi-date satellite data. Using a seasonal crop map with Landsat temporal data is an accepted technique (Gumma et al. Citation2020).
The LULC pattern of a region is a result of both natural and socioeconomic elements and their behavior in time and space. Satellite remote sensing can reveal changes that may help in evaluating the implementation of policies and development schemes such as the project for rejuvenation of irrigation tanks in Telangana during the 2014–2018 period. Estimation of surface water area including reservoirs and irrigation tanks (major, medium-sized and minor water bodies <1 ha) using satellite data can be very reliable. In our study, as expected, irrigated area under surface water bodies showed a significant relationship with total precipitation during that year. For instance, a sharp decline in rainfall witnessed in 2015–2016 led to a widespread drought in the State. Water bodies <1 ha in size decreased drastically due to poor rainwater catchment in 2014–2015 and 2015–2016. However, in 2016–17 and 2017–18, cumulative tank area expanded due to the contribution of water tanks that were restored under the Mission Kakatiya initiative, coupled with good rainfall distribution (). It is evident that the Mission Kakatiya interventions had a steady and positive impact on water recharge in tanks (across categories) in the State. Our estimate of the district-wise irrigated area using seasonal satellite composites showed very high agreement with the state agricultural statistics ().
The current study thus opens up an opportunity to develop a spatial monitoring system of key performance indicators (KPIs) of Mission Kakatiya. Regular monitoring of surface water bodies and irrigated/cropped area using higher-resolution data from Sentinel (10 m optical data) or commercial satellites can ensure efficient tracking of project interventions over time (Gumma et al. Citation2022b). The use of coarse resolution imagery such as MODIS 250 m and Landsat 30 m does have certain limitations.
5.5. Benefits of rejuvenating tanks
The benefits of Mission Kakatiya interventions included silt removal from the tank beds. High in valuable nutrients, silt can enhance the soil moisture retention capacity and boost farmers’ yields. Farmers who collected silt from tanks and applied it in their farms have benefited significantly. Application of silt not only helps in reducing soil erosion but also leads to better moisture retention capacity (Shah and Verma Citation2018). Studies on the impact of irrigation tank rejuvenation have identified the following benefits to farmers: (i) increase in soil water retention capacity; (ii) enhanced groundwater recharge; (iii) drinking water for cattle; (iv) reduction in fluoride content in groundwater; (v) use of silt as nutrient/fertilizer; (vi) increase in crop yield; and (vii) opportunity to earn carbon credits in the international market (Eptri Citation2015).
5.6. Expansion of water bodies and other changes
We performed change detection analysis for every crop year from 2013–14 to 2017–18 (; ) to document the changes in LULC and expansion of water bodies. We observed that 390,329 ha of land was converted from rainfed cropland to irrigated cropland; similarly 95,154 ha were converted from other LULC classes to water bodies; and conversion from other LULC classes to croplands accounted for about 1,833,900 ha. We noticed a significant change in 2016–17: conversion from rainfed cropland to irrigated cropland was about 395,324 ha; and the increase in waterbodies area was about 70,994 ha. This increase might have been due to it being the fourth year of the intervention and the fact that a good amount of rainfall with good distribution occurred that year.
Figure 9. Spatial distribution of land use/land cover changes for crop years from 2013–14.
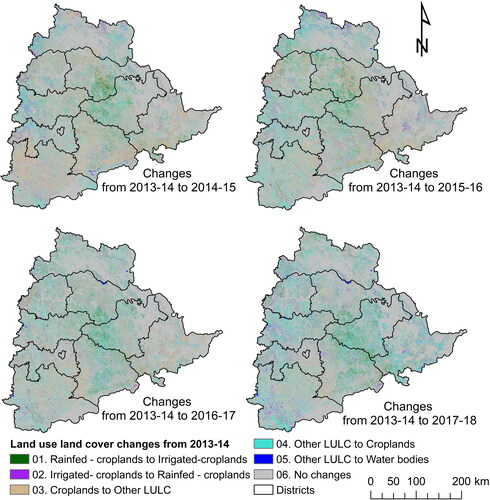
Table 6. Land use/land cover changes from 2013–14 to 2017–18.
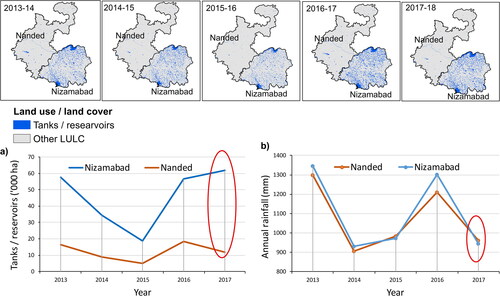
We compared Mission Kakatiya districts in Telangana State with a neighboring district of Maharashtra (as control) to assess the long-term impact of the project interventions. Nizamabad district in Telangana was compared with neighboring Nanded district in Maharashtra in regard to temporal changes in water bodies (see ). From 2013 to 2016, we observed a decrease in water body area due to recurrent droughts, followed by an expansion from 2016 to 2017 in both districts. But in 2017–18, there was a decrease in Nanded district and an increase in water body area in Nizamabad district. This disparity was due to the implementation of Mission Kakatiya in Nizamabad.
Figure 10. Spatial distribution of tanks/reservoirs in Nizamabad district (Mission Kakatiya district) of Telangana and Nanded district (non-Mission Kakatiya district) in Maharashtra.
Cropping intensity was monitored in the two districts for the crop years 2014–15 and 2018–19 ().
Figure 11. Spatial distribution of crop intensity in Nizamabad and Nanded districts, 2014–15 and 2018–19.
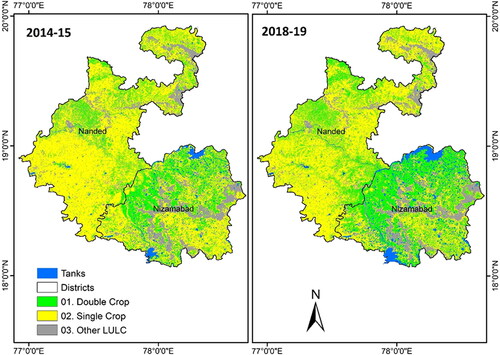
It was observed the crop intensity (i.e. conversion of single crop to double crop) increased in both districts but the tank area in Nizamabad increased more compared to Nanded (). The increase in crop intensity in Nanded was due to other kinds of irrigation or intervention.
Table 7. Area statistics of double crop in Nizamabad and Nanded districts.
6. Conclusions
Satellite remote sensing has dramatically altered the science of detecting changes in land use and land cover. The present study applied Landsat data to monitor surface water area (comprising of reservoirs and irrigation tanks – major, medium-sized and minor irrigation systems) and irrigated cropped area changes during 2013–2018 in Telangana State where a project called Mission Kakatiya is being implemented with a target of rejuvenating more than 45,000 tanks over a five-year period. Restoration and desiltation of tanks have showed a significant positive impact on surface water storage, expansion of irrigated area, recharge of the groundwater table and changes in the cropping pattern.
Spatial analysis indicated a substantial increase in cropped area under irrigation as well as expansion of water bodies over the study period. Seasonal rainfall and its distribution played a significant role in generating conspicuous LULC changes and shifts in the cropping pattern. The total tank area expanded from 294,748 ha in 2013–14 to 355,464 ha in 2017–18, resulting in an increase in total cropland and tank-irrigated areas to the tune of about 0.6 M ha and 0.2 M ha, respectively. A comparison of ground survey data and four land use/land cover classes derived from Landsat temporal imagery also achieved an overall accuracy of 87% with secondary data obtained from the state government.
The methods used in this study are recommended for identifying and delineating tanks and mapping LULC cover changes, etc. A primary and secondary database of maps and statistics can further help and guide the effective implementation of the Mission Kakatiya project in Telangana state. Application of higher-resolution satellite data/imagery can improve the accuracy of these estimates and generate robust evidence on the impacts of Mission Kakatiya.
Acknowledgements
This research was supported by the CGIAR Research Program on Water, Land and Ecosystems (WLE). We would like to thank Ms. Vineetha Pyla, Ms Bhavani P, Dr. P S Roy, Dr. Thomas Falk and Dr. Malsur Gurram for their suggestions and comments on manuscript at initial stage.
Disclosure statement
No potential conflict of interest was reported by the authors.
References
- Atzberger C. 2013. Advances in remote sensing of agriculture: context description, existing operational monitoring systems and major information needs. Remote Sens. 5(2):949–981.
- Bazzi H, Baghdadi N, El Hajj M, Zribi M, Minh DHT, Ndikumana E, Courault D, Belhouchette H. 2019. Mapping paddy rice using sentinel-1 sar time series in camargue, france. Remote Sens. 11(7):887.
- Begue A, Vintrou E, Saad A, Hiernaux P. 2014. Differences between cropland and rangeland modis phenology (start-of-season) in mali. Int J Appl Earth Obs Geoinf. 31:167–170.
- Belgiu M, Csillik O. 2018. Sentinel-2 cropland mapping using pixel-based and object-based time-weighted dynamic time warping analysis. Remote Sens Environ. 204:509–523.
- Biggs TW, Thenkabail PS, Gumma MK, Scott CA, Parthasaradhi GR, Turral HN. 2006. Irrigated area mapping in heterogeneous landscapes with modis time series, ground truth and census data, krishna basin, india. Int J Remote Sens. 27(19):4245–4266.
- Boken VK, Hoogenboom G, Kogan FN, Hook JE, Thomas DL, Harrison KA. 2004. Potential of using noaa-avhrr data for estimating irrigated area to help solve an inter-state water dispute. Int J Remote Sens. 25(12):2277–2286.
- Bousbih S, Zribi M, El Hajj M, Baghdadi N, Lili-Chabaane Z, Gao Q, Fanise P. 2018. 1953. Soil moisture and irrigation mapping in a semi-arid region, based on the synergetic use of sentinel-1 and sentinel-2 data. Remote Sens. 10(12):1953.
- Chen Y, Lu D, Luo L, Pokhrel Y, Deb K, Huang J, Ran Y. 2018. Detecting irrigation extent, frequency, and timing in a heterogeneous arid agricultural region using modis time series, landsat imagery, and ancillary data. Remote Sens Environ. 204:197–211.
- Cohen J. 1960. A coefficient of agreement for nominal scales. Educ Psychol Meas. 20(1):37–46.
- Congalton RG. 1991. A review of assessing the accuracy of classifications of remotely sensed data. Remote Sens Environ. 37(1):35–46.
- Davenport FV, Herrera‐Estrada JE, Burke M, Diffenbaugh NS. 2020. Flood size increases nonlinearly across the western united states in response to lower snow‐precipitation ratios. Water Resour Res. 56(1):1–19.
- Demarez V, Helen F, Marais-Sicre C, Baup F. 2019. In-season mapping of irrigated crops using landsat 8 and sentinel-1 time series. Remote Sens. 11(2):118.
- Eptri 2015., Environment protection training and research institute. State action plan on climate change for telangana state, submitted to ministry of environment, forests and climate change, government of india, new delhi. Environment protection training and research institute, survey no. 91/4, gachibowli, hyderabad – 500 032, www.Eptri.Com.
- Ferrant S, Selles A, Le Page M, Herrault P-A, Pelletier C, Al-Bitar A, Mermoz S, Gascoin S, Bouvet A, Saqalli M, et al. 2017. Detection of irrigated crops from sentinel-1 and sentinel-2 data to estimate seasonal groundwater use in south india. Remote Sens. 9(11):1119.,
- Foga S, Scaramuzza PL, Guo S, Zhu Z, Dilley RD, Jr, Beckmann T, Schmidt GL, Dwyer JL, Hughes MJ, Laue B. 2017. Cloud detection algorithm comparison and validation for operational landsat data products. Remote Sens Environ. 194:379–390.
- Gallego FJ. 2004. Remote sensing and land cover area estimation. Int J Remote Sens. 25(15):3019–3047.
- Gao Q, Zribi M, Escorihuela MJ, Baghdadi N, Segui PQ. 2018. Irrigation mapping using sentinel-1 time series at field scale. Remote Sens. 10(9):1495.
- Gaur A, Biggs TW, Gumma MK, Parthasaradhi G, Turral H., 2008. Water scarcity effects on equitable water distribution and land use in major irrigation project - a case study in india. J Irrig Drain Eng. 134(1):26–35.
- Got 2021., Mission kakatiya, government of telangana. https://missionkakatiya.Cgg.Gov.In/homemission. (accessed in 05 may 2021).
- Gumma MK, Thenkabail PS, Deevi KC, Mohammed IA, Teluguntla P, Oliphant A, Xiong J, Aye T, Whitbread AM. 2018. Mapping cropland fallow areas in myanmar to scale up sustainable intensification of pulse crops in the farming system. GISci Remote Sens. 55(6):926–949.
- Gumma MK, Thenkabail PS, Maunahan A, Islam S, Nelson A. 2014. Mapping seasonal rice cropland extent and area in the high cropping intensity environment of bangladesh using modis 500m data for the year 2010. ISPRS J Photogramm Remote Sens. 91:98–113.
- Gumma MK, Thenkabail PS, Muralikrishna IV, Velpuri MN, Gangadhararao PT, Dheeravath V, Biradar CM, Acharya Nalan S, Gaur A. 2011. Changes in agricultural cropland areas between a water-surplus year and a water-deficit year impacting food security, determined using modis 250 m time-series data and spectral matching techniques, in the krishna river basin (india). Int J Remote Sens. 32(12):3495–3520.
- Gumma MK, Thenkabail PS, Panjala P, Teluguntla P, Yamano T, Mohammed I. 2022a. Multiple agricultural cropland products of south asia developed using landsat-8 30 m and modis 250 m data using machine learning on the google earth engine (gee) cloud and spectral matching techniques (smts) in support of food and water security. GISci Remote Sens. 59(1):1048–1077.
- Gumma MK, Thenkabail PS, Teluguntla PG, Oliphant A, Xiong J, Giri C, Pyla V, Dixit S, Whitbread AM. 2020. Agricultural cropland extent and areas of south asia derived using landsat satellite 30-m time-series big-data using random forest machine learning algorithms on the google earth engine cloud. GISci Remote Sens. 57(3):302–322.
- Gumma MK, Tummala K, Dixit S, Collivignarelli F, Holecz F, Kolli RN, Whitbread AM. 2022b. Crop type identification and spatial mapping using sentinel-2 satellite data with focus on field-level information. Geocarto Int. 37(7):1833–1849.
- Inglada J, Arias M, Tardy B, Hagolle O, Valero S, Morin D, Dedieu G, Sepulcre G, Bontemps S, Defourny P, et al. 2015. Assessment of an operational system for crop type map production using high temporal and spatial resolution satellite optical imagery. Remote Sens. 7(9):12356–12379.,
- Kadapala BKR, Hakeem KA, Raghavendra K, Patel S, Kumar KP. 2020. Capacity estimation of irrigation tanks through remote sensing from uav platform. J Indian Soc Remote Sens. 48(10):1403–1411.
- Kerr Y, Wigneron J-P, Al Bitar A, Mialon A, Srivastava P. 2016. Soil moisture from space: techniques and limitations. Satellite Soil Moisture Retrieval. Elsevier:3–27.
- Liaw A, Wiener M. 2002. Classification and regression by randomforest. R News. 2(3):18–22.
- Lu D, Mausel P, Brondízio E, Moran E., 2004. Change detection techniques. Int J Remote Sens. 25(12):2365–2401.
- Meier J, Zabel F, Mauser W. 2018. A global approach to estimate irrigated areas–a comparison between different data and statistics. Hydrol Earth Syst Sci. 22(2):1119–1133.
- Midekisa A, Holl F, Savory DJ, Andrade-Pacheco R, Gething PW, Bennett A, Sturrock HJ. 2017. Mapping land cover change over continental africa using landsat and google earth engine cloud computing. PLoS One. 12(9):e0184926.
- Mkp 2021., Mission kakatiya, government of telangana. https://missionkakatiya.Cgg.Gov.In/. (accessed in 15 april 2021).
- Mospi 2016., Ministry of statistics and program implementation (mospi) statistical year book india.
- Murthy Reddi VR, Gumma MK, Pyla KR, Eadara A, Gummapu JS. 2017. Monitoring changes in croplands due to water stress in the krishna river basin using temporal satellite imagery. Land. 6(4):72.
- Nag K. 2011. Battleground telangana: chronical of an agitation. Gurugram, Haryana: Harper Collins publishers India.
- Orynbaikyzy A, Gessner U, Conrad C. 2019. Crop type classification using a combination of optical and radar remote sensing data: a review. Int J Remote Sens. 40(17):6553–6595.
- Pageot Y, Baup F, Inglada J, Baghdadi N, Demarez V. 2020. Detection of irrigated and rainfed crops in temperate areas using sentinel-1 and sentinel-2 time series. Remote Sens. 12(18):3044.
- Pérez-Hoyos A, Rembold F, Kerdiles H, Gallego J. 2017. Comparison of global land cover datasets for cropland monitoring. Remote Sens. 9(11):1118.
- Pervez MS, Brown JF. 2010. Mapping irrigated lands at 250-m scale by merging modis data and national agricultural statistics. Remote Sens. 2(10):2388–2412.
- Pingle G. 2011. Irrigation in telangana: the rise and fall of tanks. Economic and Political Weekly. Review Agric. 46(26/27):123–130.
- Qiu B, Lu D, Tang Z, Chen C, Zou F. 2017. Automatic and adaptive paddy rice mapping using landsat images: case study in songnen plain in northeast china. Sci Total Environ. 598:581–592.
- Rao PR. 1995. History and culture of andhra pradesh: from the earliest times to the present day: sterling Publishers Pvt. Limited. New Delhi. 110016(p):58–81.
- Renault D, Wahaj R, Smits S. 2013. Multiple uses of water services in large irrigation systems
- Sakamoto T, Yokozawa M, Toritani H, Shibayama M, Ishitsuka N, Ohno H. 2005. A crop phenology detection method using time-series modis data. Remote Sens Environ. 96(3-4):366–374.
- Scaramuzza PL, Bouchard MA, Dwyer JL. 2011. Development of the landsat data continuity mission cloud-cover assessment algorithms. IEEE Trans Geosci Remote Sens. 50(4):1140–1154.
- Shah M, Verma S. 2018. Reviving minor irrigation in telangana: midterm assessment of mission kakatiya. IWMI. 8.
- Shoushtarian F, Negahban-Azar M. 2020. Worldwide regulations and guidelines for agricultural water reuse: a critical review. Water. 12(4):971.
- Singh A. 1989. Digital change detection techniques using remotely sensed data. Int J Remote Sens. 10(6):989–1003.
- Tateishi R, Uriyangqai B, Al-Bilbisi H, Ghar MA, Tsend-Ayush J, Kobayashi T, Kasimu A, Hoan NT, Shalaby A, Alsaaideh B, et al. 2011. Production of global land cover data – glcnmo. Int J Digital Earth. 4(1):22–49.
- Thenkabail P, Gangadhararao P, Biggs T, Gumma M, Turral H. 2007. Spectral matching techniques to determine historical land-use/land-cover (lulc) and irrigated areas using time-series 0.1-degree avhrr pathfinder datasets. Photogramm Eng Remote Sens. 73(10):1029–1040.
- Thenkabail PS, Biradar CM, Noojipady P, Dheeravath V, Li Y, Velpuri M, Gumma M, Gangalakunta ORP, Turral H, Cai X, et al. 2009. Global irrigated area map (giam), derived from remote sensing, for the end of the last millennium. Int J Remote Sens. 30(14):3679–3733.
- Thenkabail PS, Schull M, Turral H. 2005. Ganges and indus river basin land use/land cover (lulc) and irrigated area mapping using continuous streams of modis data. Remote Sens Environ. 95(3):317–341.
- Thiruvengadachari S. 1981. Satellite sensing of irrigation pattern in semiarid areas: an indian study. Photogram Eng Remote Sens. 47:1493–1499.
- Van Vliet MT, Jones ER, Flörke M, Franssen WH, Hanasaki N, Wada Y, Yearsley JR. 2021. Global water scarcity including surface water quality and expansions of clean water technologies. Environ Res Lett. 16(2):024020.
- Velpuri NM, Thenkabail PS, Gumma MK, Biradar CB, Noojipady P, Dheeravath V, Yuanjie L. 2009. Influence of resolution in irrigated area mapping and area estimations. Photogramm Eng Remote Sens. 75(12):1383–1395.
- Xiang K, Ma M, Liu W, Dong J, Zhu X, Yuan W. 2019. Mapping irrigated areas of northeast china in comparison to natural vegetation. Remote Sens. 11(7):825.
- Xiong J, Thenkabail PS, Gumma MK, Teluguntla P, Poehnelt J, Congalton RG, Yadav K, Thau D. 2017. Automated cropland mapping of continental africa using google earth engine cloud computing. ISPRS J Photogramm Remote Sens. 126:225–244.
Appendix 1