
 ?Mathematical formulae have been encoded as MathML and are displayed in this HTML version using MathJax in order to improve their display. Uncheck the box to turn MathJax off. This feature requires Javascript. Click on a formula to zoom.
Abstract
Obtaining high-precision information on functional areas is very important in urban spatial management. It has become common to integrate social perception data and high-resolution remote sensing images to identify functional areas. Based on Point of Interest (POI) data, a scoring evaluation model is constructed to identify functional zones in built-up areas. Two weight values in the model, the POI area weight and normalized kernel density value, are used in the calculation of the impact score. Functional areas are identified by the proportion of the influence score associated with each function type. The information corresponding to 10 first-level and 29 s-level functional areas is obtained by integrating the classification results for natural attributes in high-resolution images and the social attribute functional areas in the scoring evaluation model. The overall accuracy is 87.2%, and the kappa coefficient is 0.86. The spatial structure characteristics of functional areas are analyzed based on spatial syntax, the location entropy index and so on. The main functions of each street core area and high-selectivity area are consistent with the function types, are associated with high location entropy index values and coincide with distribution centres with various functions. This study is conducive to enhancing urban spatial planning, management and decision support.
1. Introduction
Functional areas are spaces where people perform various social and economic activities, and they include industrial, commercial and residential areas (Obaco et al. Citation2020; Zhang et al. Citation2020). Functional area identification involves inferring the types of ways these spaces are used (Zhang et al. Citation2017a; Cao et al. Citation2020). Modern urban spatial planning and management rely on real-time and accurate functional area information (Andrade et al. Citation2020). However, high-precision urban functional area maps that can reflect urban changes in a timely and accurate manner to reflect the real state of a city are lacking (Hu et al. Citation2016), and mixed modes of land use increase the difficulty of mapping. Therefore, it is a challenge in urban research to quickly and accurately identify functional areas over large spatial ranges.
With the development of very-high-resolution (VHR) satellite technology, VHR imagery can provide detailed ground object information, such as spatial distribution, texture, shape and size information (Zhang et al. Citation2018; Wang et al. Citation2019). The methods used to identify functional regions based on VHR images include random forest (RF) (Zhan et al. Citation2014; Zhang et al. Citation2017b), object-oriented (Song et al. Citation2018), and convolutional neural network (Zhang et al. Citation2018; Zhou et al. Citation2020). An RF is composed of multiple decision trees and provides results based on majority voting among trees. The features used in the training and classification of convolutional neural networks are relatively comprehensive, and they include features such as colour, texture, shape and spatial relations, which are suitable for the classification of complex functional areas (Zhou et al. Citation2020). Object-oriented classification is easy to implement and can provide high accuracy without a large number of samples. Urban built-up areas are usually composed of man-made infrastructures with various social attributes, and there are limitations in distinguishing the social attributes of urban functions using only VHR images (Hu et al. Citation2016; Du et al. Citation2020; Zhong et al. Citation2020).
Social perception data can aid in effectively distinguishing different social attribute functions in built-up areas with similar spectral characteristics (Du et al. Citation2019; Zhou et al. Citation2020). For example, Wang et al. (Citation2016) estimated land use types (such as residential, commercial and business office areas) using time-trend models and geotagged social media data (Sina Weibo). Yu et al. (Citation2019) used the trajectory of a floating car to obtain the temporal and spatial travel characteristics of passengers, determined the main functional areas through clustering, and identified the functional attributes of transportation communities through POI attribute information.
POI data, which are characterized by rich information, excellent real-time performance and easy open-source access, are increasingly used in combination with VHR images to identify functional areas. Common fusion methods include semantic feature classification (Liu et al. Citation2017; Dong et al. Citation2020; Du et al. Citation2020) and multisource feature model training (Zhang et al. Citation2017b; Xing and Meng Citation2018; Cao et al. Citation2019). For example, Du et al. (Citation2020) obtained spectral feature words and landscape indicators from images through clustering, constructed a multisource dictionary by combining POI category words, used latent Dirichlet allocation (a conjugate prior probability distribution with polynomial form) to mine the semantic features of functional areas, and trained a classifier for classification. Based on spectral/texture attributes, landscape indicators, POI density and spatial patterns, and Weibo attributes derived from multisource data, Zhang et al. (Citation2017b) trained samples and classified them with an RF. In these studies, the spatial information associated with remote sensing and POI data was integrated into the functional area recognition framework to obtain accurate functional area maps. However, the existing models are relatively complex, require large amounts of data and accrue high costs, thus limiting their application (Hu and Han Citation2019). Additionally, most functional area types are not well classified at very small scales (such as a retail store or an administrative office), and spatial structure analyses of functional areas are often insufficient.
In this article, based on the detailed design of a two-level functional zone system, an effective scoring evaluation model is proposed to identify built-up functional areas according to the characteristics of POI data. This model includes the area weights of various POIs and normalized kernel density parameter weights. The area weights were obtained from building vector data and image features and were calculated based on the pairwise factor comparison method. The results were combined with normalized kernel density values to calculate the impact score of each function type to determine the functional zones of the built-up areas. Then, the recognition results were integrated at the result level based on the natural functional regions obtained from the remote sensing classification of VHR images and the social attribute functional areas in the scoring evaluation model with POI data. Finally, the functional structure of urban areas was analyzed based on the superposition of a functional area map and an analysis map produced with a spatial syntactic model. The mixing degree and spatial distribution characteristics of the functional areas were analyzed using location entropy, the mixing degree, the nearest neighbour index and standard deviation ellipsoids. This study provides a method for obtaining high-precision urban functional zoning information, and with the continuous improvement of remote sensing image resolution and the continuous increase in POI data, the research results will improve. This study is conducive to quickly assessing the urban spatial structure, implementing scientific urban planning, and promoting social and economic development.
2. Study area and data
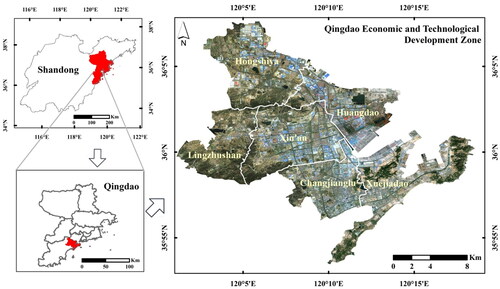
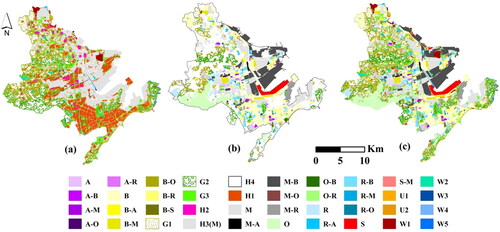
Qingdao is an important coastal city and an international port city in the province of Shandong, China. In this article, the Qingdao Economic and Technological Development Zone in Qingdao city is selected as the research area (), with a total area of 278.15 km2. It includes a petrochemical industrial area (Huangdao Street), an industrial area near a port (Xin’an Street), an ecological and efficient agricultural area (Lingzhushan Street), an administrative business centre area (Changjianglu Street and part of Xuejiadao Street), a comprehensive tourism area (part of Xuejiadao Street) and Hongshiya Street. Overall, many functions are provided in the study area, and the landscape is complex, including residential areas, shopping centres, ports and docks, cropland, forest and other social and natural attribute areas. Overall, the Qingdao Economic and Technological Development Zone provides good representativeness as a research region for the identification of secondary functional areas and functional structure analysis.
Figure 1. Geographical distribution map of the study area.
Multisource data, including remote sensing images, road network data, POI data and building vector data, were used in this study. The VHR remote sensing images were used to segment image objects and identify nonconstruction land use types. The road network data were used to divide urban areas into traffic analysis zones (TAZs) and to construct a model for spatial syntactic analysis. Based on the TAZs and image objects, the study area was divided into 6050 ‘street-object-level’ research units. POI data were used to identify different social functions within built-up areas; building vector data were used to establish mapping relationships with POIs to obtain the scale information of POIs.
A GF-2 image obtained in 2018 () with a spatial resolution of 2 m and three spectral channels were used for classification. Road network data were acquired from OpenStreetMap (OSM) in August 2019 and included important attribute information, such as road types and names, to facilitate road network processing. The 2018 AMAP POI data were obtained with a POI data download platform (http://www.poi58.com/), and the datasets included POI name, address, latitude and longitude, type and other attribute information. POI data were divided into 19 categories and 190 subcategories, with 44904 records in total after deleting duplicate POIs and POIs that were meaningless for the identification of functional areas, such as public restrooms, bus stations and bank ATMs. Building vector data were obtained from the Bowen Surveying and Mapping GIS Service Center and were derived from two major map suppliers in China (http://lbs.amap.com/, https://open.baidu.com/). These datasets included building floor and area information. After preprocessing steps, such as merging, a total of 7122 records were obtained.
3. Methodology
An objective scoring evaluation model based on POIs was constructed to identify social functions. The natural attribute functional categories extracted from VHR remote sensing images were combined to obtain a high-precision functional area distribution. The characteristics of the urban functional spatial structure were analyzed based on other geographic data (). The construction of the system of natural and social function types () was based on the ‘Code for the classification of urban land use and planning standards for development land’ and the images and ground features of the study area. The Code is a national standard in China and is often used in urban planning.
Figure 2. Technical flow chart of this article.
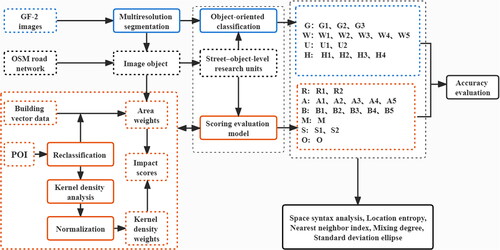
Table 1. Natural and social attributes of the functional type system.
The technical framework of this study is shown in . First, object-oriented classification technology was used to classify GF-2 images. Second, the OSM road network and image segmentation object were combined to generate street–object-level research units. The area weight was obtained based on the building vector data, image segmentation results and reclassified POIs, and the impact score of each POI was calculated combined with the kernel density weight; that is, the scoring evaluation model was constructed. According to the proportion of each type of POI in the street–object-level unit, the functional areas of construction land were identified, and the accuracy was evaluated. Finally, the functional type map of the study area was superimposed for spatial syntactic analysis, and the location entropy, mixing degree, nearest-neighbour index and standard deviation ellipse were used to analyze the urban functional structure and layout.
3.1. Object-oriented classification
Object-oriented classification is currently one of the most popular methods for extracting ground objects from remote sensing images based on their physical features (Yao et al. Citation2017). The classification process includes image segmentation and the establishment of classification rules. Because urban built-up areas are typically composed of various buildings with different social functions, it is difficult to quickly and accurately identify different social attributes from images alone (Zhang et al. Citation2017b; Du et al. Citation2020) therefore, construction land was extracted as the first class in this stage of the analysis process.
Multiresolution segmentation can generate multiscale and high-quality results and is widely used in remote sensing applications. This approach can be used to select the most suitable segmentation scale for each type of ground object and to extract ground object information at different scales and in different layers. The process of multiscale segmentation includes band weighting, homogenization factor weighting (shape factor and compactness) and the determination of the optimal segmentation scale for various ground objects. In this study, the weight of each band of GF-2 was set to 1, the shape parameter was set to 0.3, and the compactness was set to 0.5. The ESP (estimation of scale parameters) evaluation tool was used to estimate the optimal scale (Dragut et al. Citation2010). According to the peak value of the rate of change (ROC) curve (), the potential optimal segmentation scales were determined to be 85, 100, 110, 145, 195, 210, 260, 290, 365 and 390. Based on the above scales, the segmentation method that best preserved the boundaries of each type of ground feature was determined through repeated comparison, and the layer scale was identified as the best segmentation scale for ground objects ().
Figure 3. Evaluation of the optimal ESP segmentation scale.
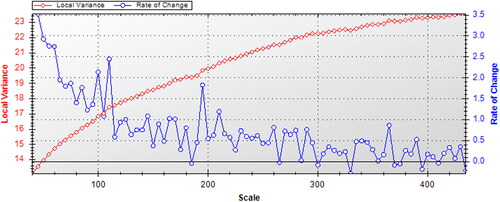
Table 2. Optimal segmentation scale and extraction rule set for various types of ground objects.
According to the optimal scale, the land class samples to be extracted were selected from each layer, and the associated land class attributes were considered. Ground object types and feature values were then derived to select features suitable for distinguishing each type of ground object from others. The characteristic values derived in this study included spectral features (mean, standard deviation, brightness and maximum difference of each band), texture features (mean, standard deviation, variance, homogeneity, contrast, dissimilarity, entropy, angular second moment and correlation) and shape characteristics (area, length, width, L/W, main direction, asymmetry, compactness, roundness, rectangular fit, shape index and density). A rule set was established by comparing the screening degrees of various features for each type of ground object (). Attributes were manually assigned for the ground classes with few ground objects or those that were difficult to extract based on the established rules. In the classification process, for scales from large to small, the ground object classes were extracted and passed to the lower layer, which reduced the workload and the potential for misclassification. The unclassified objects were uniformly assigned to the class ‘urban construction land’, and appropriate corrections were made.
3.2 Scoring evaluation model
3.2.1. POI reclassification
POIs of the same initial type may have differing properties. For example, ‘residential annex’ and ‘dormitory’ could be classified as residential buildings (residential properties) or university dormitories (education and culture). Additionally, the ‘company’ class includes both commercial service companies and industrial and mining enterprises. Reclassification can solve the problem of same-type diversity among POIs and improve the accuracy of functional area identification. Therefore, POI data can be reclassified according to the functional area classification system listed in .
Table 3. Weight value and average area for each functional classification system.
3.2.2. Area weights
The spatial connections between POIs and building vector data were established, and 10 539 matching records were obtained as the ‘sample database’. According to the actual numbers of various POIs, 2% to 40% of the samples were selected from the sample database by category, totalling 2943 samples. For POI subclasses with insufficient samples, spatial connections were established with image objects to calculate their average area; these subclasses included football fields, basketball courts and certain administrative areas (villages). Then, POI subclasses with similar scales corresponding to each secondary class were merged, and the average area was obtained () to reduce the weight complexity and calculation error. Finally, the weight values Z1 of various POIs were obtained via pairwise factor comparison. In this method, the sum of the ratios of various POIs was set to 1, the ratios were obtained by pairwise comparison, and the results for various POIs were added separately to obtain individual area weights ().
3.2.3 Kernel density analysis
The functional properties of a research unit are related to the POIs within the unit and influenced by the functions of nearby POIs. In kernel density analysis, the closer things are, the more closely related they are, and the density of POIs in the area around a given point can be calculated. Therefore, the kernel density value is selected as another weight. For points of interest x1, x2,…, xn, the formulas for kernel density estimation are as follows:
(1)
(1)
(2)
(2)
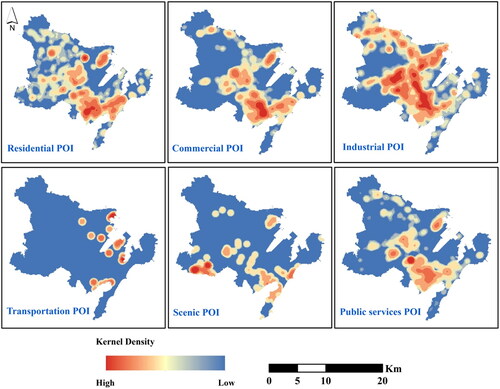
where K is the quadratic kernel function proposed by Silverman (Citation1986), n is the number of points within the selected range, x–xi is the distance between x and xi, and h is the bandwidth. Hinneburg (Citation1998) found that the kernel density analysis results generated based on bandwidths in a certain interval are similar and that selecting bandwidths in this interval could enhance the determination of spatial distribution characteristics. Based on this approach, the bandwidth interval was determined to be [800 m, 900 m] in this article. The default bandwidth of kernel density analysis in ArcMap is 859 m, which is within the selected bandwidth range. Therefore, the bandwidth of 859 m was selected to conduct kernel density analysis for various POIs (), and the kernel density values were extracted and normalized to obtain the weight value set Z2.
Figure 4. Normalized kernel density maps of various POIs.
The total impact score Z is the sum of the area weights Z1 and the normalized kernel density values Z2. Spatial connections were established between POIs with total impact scores and research units, and 1404 connection relationships were obtained. Functional areas were identified according to the proportions of impact scores for various POIs in each research unit. To obtain detailed functional types, the scale was set to 50%, and mixed functional areas accounted for 22.6% of the total area. When the proportion of the impact score of a certain type of POI in a unit was greater than or equal to 50%, the unit was classified as an area with a single function; otherwise, the area was considered a mixed area of two or three functions, with the sum of the proportions exceeding 50%.
3.3. Space syntax
Space syntax theory is used for the quantitative analysis and description of buildings and urban spatial structures (Hillier and Hanson Citation1984). In this study, an axis model was established to analyze the connections between urban spaces and functions. A quantitative description of the urban spatial structure was obtained by measuring the integration degree, selection degree, control value and intelligibility of the entire study area and each street in the study area (Alalouch et al. Citation2019; Agirbas Citation2020; Esposito et al. Citation2020).
The integration degree represents spatial accessibility, and the core area based on the integration degree is the region with the strongest centrality. Roads associated with a high degree of choice are main roads, which are conducive to the gathering of people and are often located in areas with many public facilities. The control value reflects the degree to which a functional area affects its surroundings. The connection value is the number of roads to which a road connects. Commercial activities tend to occur along streets with high connectivity and control values (Xu et al. Citation2021). Streets with high selectivity and connectivity have the potential to form commercial streets and blocks. Intelligibility reflects people’s perception of the local areas of a city. The greater the degree of intelligibility is, the more reasonable the network structure in the area and the easier the spatial structure is to recognize and use (Esposito et al. Citation2020). Moreover, people in these areas will quickly begin to use new activity spaces.
3.4. Other functional structure analysis methods
To reveal the dominance of the various functions along each street in the study area and the degree of mixing and spatial distribution characteristics of various functions, the location entropy index (Q), mixing index (M) (Long and Liu Citation2013), nearest-neighbour index (NNI) and standard deviation ellipse analysis method were applied. When the location entropy index Q > 1.5, the selected function is relatively established and advantageous in the region. When 1<Q < 1.5, the functional dominance is higher than the average level in the region. When Q < 1, the functional effect is below average. When NNI < 1, the selected POIs are clustered and highly distributed in space, and the smaller the NNI is, the higher the aggregation degree is. When NNI = 1, the corresponding POIs are randomly distributed. When NNI > 1, the corresponding POIs are evenly distributed (Tian and Sha Citation2010). The direction and length of the major and minor axes of a standard deviation ellipsoid reflect the main/subtrend direction and the dispersion degree of a function in space, respectively (Zhao et al. Citation2018). The formulas for the above indices are as follows:
(3)
(3)
(4)
(4)
(5)
(5)
(6)
(6)
(7)
(7)
where eK–A is the area ratio of function A in region K to the area of function A in the study area, eK is the ratio of area K to the total research area, n is the type of POI in the selected research unit, pi is the proportion of POIs of the i-th type in the research unit, d(NN) is the average measured nearest distance, d(ran) is the theoretical nearest distance, dj is the distance between point j and the nearest point, N is the number of type-i POIs, and S is the area of the study region.
4 Results and analysis
4.1. Identification results of functional areas
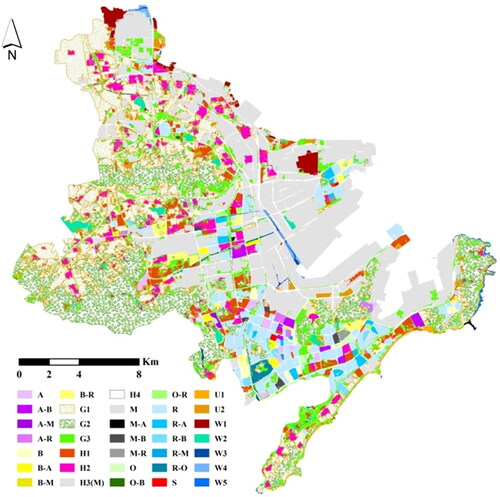
The results of object-oriented classification based on remote sensing images are shown in . Adjacent objects of the same type were merged to obtain 4273 objects. By combining objects and TAZs, 6050 street–object-level research units were obtained. is a functional area map that was produced with the scoring evaluation model for the identification of secondary functional areas related to construction land. The final distribution map of functional areas () was obtained by combining the functional types related to natural attributes obtained via object-oriented classification and the functional types related to social attributes extracted with the POI scoring evaluation model.
Figure 5. Results of functional area identification: (a) Object-oriented classification diagram, (b) Identification map obtained with the scoring evaluation model, and (c) Final result of functional area identification.
To evaluate the accuracy of functional area identification, a random sampling scheme was used to collect and verify samples in the study area, which included 524 natural attribute units and 836 social attribute units. Based on GF-2 imagery, POIs and AMAP information, 1360 units were identified manually, and the identification results were evaluated to determine the real functional type. The evaluation results indicate that the overall accuracy of the natural attribute function used in object-oriented classification is 95%, the producer’s accuracy is greater than 85%, and the user’s accuracy for other land categories is greater than 90%, except in rural residential areas. The overall accuracy of the scoring evaluation model is 82%, and the kappa coefficient is 0.8 for social attribute functional areas in built-up areas. High recognition accuracy was achieved for education and culture, health care, commercial services, other business services and industry classes, and the corresponding producer’s accuracy and user’s accuracy values were greater than 80%. Residential and commercial areas (retail commerce, accommodations and catering) were easily confused in some cases because there are many commercial support facilities located near residential areas. After the integration of the two results, the overall accuracy of the final functional area distribution map reached 87.2%, and the kappa coefficient was 0.86; thus, the proposed approach meets the needs of most applications, such as urban planning.
4.2. Advantage analysis of the scoring evaluation model
The scoring evaluation model considers the influence of the POI area and density on functional area recognition and obtains high accuracy. To explore the advantages of the proposed model, the functional regions of model recognition considering only the number of POIs were used for comparison. For example, frequency density (FD) and category ratio (CR) were constructed to identify unit function types. FD is the ratio of the number of each type of POI in the unit to the total number of each type of POI, and CR is the frequency density ratio of each type of POI in the unit. Finally, functional areas were identified according to the CR of various POIs in the unit. The identification criteria are the same as above. The information of functional areas is shown in , and the overall accuracy of social function is 55.5%. Therefore, the scale and density differences of POIs are taken into account in the scoring evaluation model, which improves the identification accuracy of functions.
Figure 6. Results of frequency density and category ratio in identifying functional areas.
4.3. Space syntax analysis
As shown in , the higher the global integration is, the stronger the agglomeration. Xin’an Street and Changjianglu Street are the dominant agglomerations in the study area and are the core areas based on the integration degree. The main functional types in these areas are industry and commerce. The spatial layout in the southwest and northeast sections of Xuejiadao Street and along Lingzhushan Street is scattered, and the main function types are parks and squares, cropland and forest. Except for Hongshiya Street, all streets are highly connected with the core areas, making the core areas easily accessible; overall, the area is characterized by weak vertical connections and strong horizontal connections. The R2 value of the intelligibility of the development zone is 0.48, greater than 0.4, and values greater than the average of the global integration degree account for 52.2% of all values. Therefore, the spatial structure of the study area is easy to understand, and the street network tends to have an axis structure with a single core.
Figure 7. Spatial syntax analysis diagram: (a) Global integration map of the development zones, (b) Global selection degree map of the development zones, (c) Global integration degree map of streets, (d) Functional areas on both sides of streets with high selectivity and commercial potential.
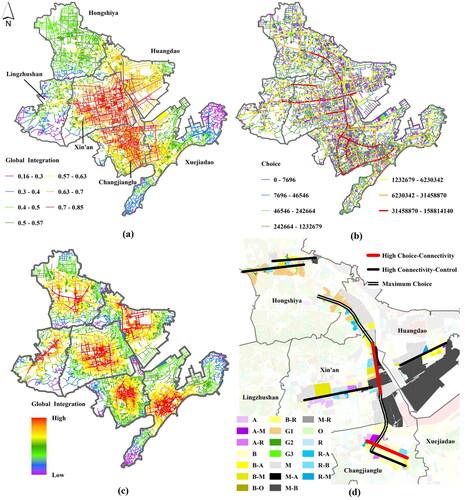
shows the global selection degree. The main functions on both sides of roads with high selection degrees are industry, education and culture, accommodations and catering, retail commerce and residential. Superposition , which is a distribution map of functional areas, residential community POIs, education POIs, culture and medical POIs, shows that most POIs are distributed on roads with a high integration degree, indicating that the spatial structure can facilitate the movement of residents from home to production spaces, such as cropland areas, companies, and factories, as well as to public facilities for education, culture and medical care services. As shown in , Jiangshan North Road, Jiangshan Middle Road and Jiangshan South Road have the highest global selectivity values and thus facilitate the gathering of people. There are four streets connected from north to south, and industrial, commercial, residential and cropland areas are mainly distributed on both sides of these roads. According to the parameter indices, the five roads are characterized by high connectivity and control values and tend to be associated with commercial activities. Additionally, two roads display high selectivity and connectivity and have the potential to form commercial streets.
4.4. Other functional structure analyses
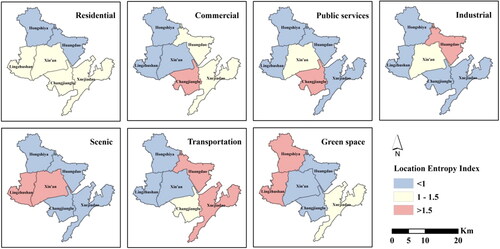
The location entropy index maps of various functions are shown in . The locational entropy index of residential function is greater than 1 in most streets, so it is higher than average in most streets of the development zone. Huangdao Street, Changjianglu Street and Xuejiadao Street have transportation degrees higher than the average level, which is related to the distribution of ports and docks. The street with the most notable advantages regarding commercial and public service functions and the most mature development is Changjianglu Street. There is a large area of cropland along Hongshiya Street, and only the ‘green space’ functional value was higher than the average level along this street. The ‘landscape’ and ‘green space’ along Lingzhushan Street exhibit high degrees of dominance, followed by residential areas, and industrial areas are nondominant; moreover, the environment is good and liveable near this street. The streets with mature industrial development are Huangdao Street and Xin’an Street.
Figure 8. Maps of various functions and the entropy distribution along each street.
In the study units with POIs, units with a mixing degree between 0 and 0.2 account for 46.8% of all units, and the functional types are mostly green space and industrial and rural residential areas with large areas and low degrees of mixing. The proportion of research units with a mixing degree between 0.2 and 0.5 is 87.6%, and many of these areas involve commercial functions; the research units with a mixing degree ranging from 0.5 ∼ 0.8 have balanced distributions of various functions, except the traffic function. The units with mixing degrees ranging from 0.8 ∼ 1 provide mainly residential and public functions, and the units with mixing degrees greater than 1 are mainly residential, indicating that residential functions are highly preferred and dominant in these areas. There are 3 streets for which the unit area of the mixing degree exceeds 0.8, accounting for more than 40% of all streets; from largest to smallest, these streets are Huangdao Street, Xin’an Street and Xuejiadao Street. Relatively complete functional development has been achieved along these streets.
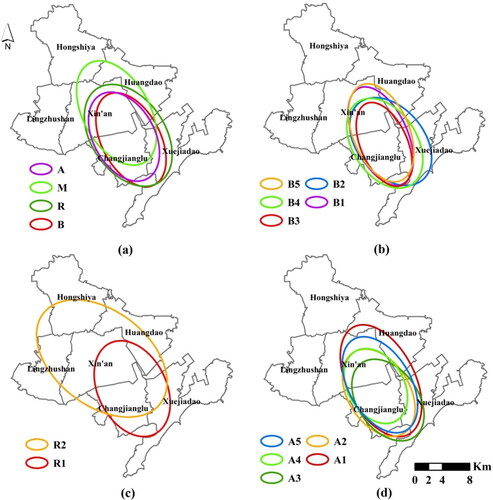
The distribution patterns and characteristics of commercial, residential, industrial and public service functions were analyzed based on mean nearest-neighbour distance analysis and standard deviation ellipsoids. The nearest-neighbour index values were all less than 1, indicating that the spatial distributions of various functions are generally characterized by agglomeration. The centre of the standard deviation ellipse reflects the distribution of the centre of gravity of functions. For example, shows that the centre of gravity of commercial and residential functions is located along Changjianglu Street, the centre of industry is located along Xin’an Street, and the centre of public service is located along Changjianglu Street, which is adjacent to the boundary with Xin’an Street. shows that the centre of gravity of retail commerce and other commercial services is close to the boundary between Changjianglu Street and Xin’an Street and that the centre of gravity of accommodations and catering is near the boundary between Changjianglu and Xuejiadao Street. The centre of the distribution of rural residential areas is located along Xin’an Street (), and the centres of gravity of administrative offices, medical care facilities and other public service centres are close to the boundary between Changjianglu Street and Xin’an Street ().
Figure 9. Standard deviation ellipsoids for four main functional areas.
5. Discussion
The POI-based scoring evaluation model proposed in this study is suitable for urban built-up areas and can be used to accurately identify functional areas. Most existing models combine the physical features of VHR images with the density attributes of POIs (Zhang et al. Citation2017b) or functional semantics (Liu et al. Citation2017; Du et al. Citation2020). VHR images generally provide the basis for functional area recognition, and POI data are often used as supplements to image-based interpretation methods (Hu et al. Citation2016; Andrade et al. Citation2020). The two composite weight sets (POI area weights and normalized kernel density weights) in the scoring evaluation model proposed in this study are both interpretable and can be used as references in other study areas due to their high generality. The obtained social attribute functions can be integrated with the results of VHR image-based classification at the result level to form high-precision functional region distribution maps covering entire study regions.
Most functional areas are identified at the generalized semantic level, and the functional types are generally residential areas, commercial areas, public service areas, green spaces and other first-level functional areas (Zhang et al. Citation2017a; Citation2017b; Xing and Meng Citation2018; Bao et al. Citation2020; Dong et al. Citation2020; Xu et al. Citation2020; Zhang et al. Citation2020). In this article, commercial areas are subdivided into retail commerce, accommodations and catering, commercial services, recreation and other business services, and public service areas, which are subdivided into administrative office, education and culture, sports, healthcare and other public service classes. Additionally, green spaces include forests, grasslands and cropland areas, as determined from the current land use map issued by the Chinese government. Secondary functional zoning is considered because it best reflects the details of the distribution of functional areas.
The spatial syntax analysis results with geographical coordinate information were combined with the functional distribution information to provide valuable information for planners. The internal spatial structure of each street in the study area can facilitate the movement of residents from their homes to production spaces such as cropland areas, companies, factories, and various public service facilities. The main functions of each street core area and high-selectivity area are consistent with the obtained function types, are characterized by a high location entropy index and coincide with the distribution centres of various functions. Space syntax analysis indicated that the core areas in Qingdao are Xin’an Street and Changjianglu Street, with single-core structures. The mean nearest distance analysis showed that the functional distribution is characterized by general clustering, and the main clusters are consistent with the centres of gravity determined from the standard deviation ellipsoids. The above analysis suggests that space syntax analysis provides an accurate method for functional structure assessment and yields valuable information for evaluating the urban functional structure and making planning decisions.
There are still some limitations of this study related to generating detailed functional area distributions throughout the entire study region. First, the reclassification of POIs can reduce semantic errors associated with the POI data, which can improve the recognition accuracy (Jiang et al. Citation2015; Yi et al. Citation2019) however, the automation level of this classification process is low, and the classification results are greatly affected by the professional knowledge of classifiers. In the future, text classification algorithms, such as the naive Bayes model, can be considered for the automatic reclassification of POIs. Second, there are many retail buildings, restaurants, hotels and other commercial service facilities near residential areas, which influence the local functional scores and skew classification toward ancillary commercial facilities and not residential areas, which may be inaccurate. In future studies, these facilities will be grouped into residential categories through POI address information in text classification, and we will continue to improve the weight system to potentially solve this problem.
6 Conclusions
The effects among different functional areas influence the spatial structure of urban areas and socioeconomic development. To assess the urban spatial structure and implement scientific urban planning, planners must understand the distribution of various functional areas. However, complex and heterogeneous urban landscapes and land use patterns pose challenges for functional area mapping. In this article, POI data are used to construct a scoring evaluation model to identify functional zones in built-up areas. The impact score based on functional area division with the proposed model is calculated as the sum of the area weights of various POIs and the normalized kernel density values. The area weights are based on building vector data, image segmentation and object sampling and are calculated via pairwise factor comparison, which is generally unaffected by subjective factors and can be directly used in other urban areas.
Combined with the object-oriented classification results obtained with VHR images, the recognition information for 10 first-level and 29 s-level functional areas is obtained. This information reflects the distribution of functional regions in detail, and a high-precision functional partitioning map of the whole region is obtained. Compared with that of the method that considers only the number of POIs, the overall accuracy is significantly improved. Functional structure analysis is performed using spatial syntax, location entropy index, mixing index, nearest-neighbour index and standard deviation ellipsoid methods to reveal the mixing degrees and distribution characteristics of functional areas. Moreover, the value of using functional area identification information in urban analysis is verified. In this study, functional area information is obtained over a large area in a short time, which is conducive to the real-time analysis of the functional area distribution and supports planning decisions. In future research, we will use a text classification algorithm for the automatic reclassification of POIs, enhance the weight system to improve the accuracy of residential area identification and increase the automation degree and generality of the model.
Data availability statement
The authors confirm that the data supporting the findings of this study are available within the article.
Disclosure statement
No potential conflict of interest was reported by the authors.
Additional information
Funding
References
- Agirbas A. 2020. Characteristics of social formations and space syntax application to quantify spatial configurations of urban regeneration in Levent, Istanbul. J Hous Built Environ. 35:171–189.
- Alalouch C, Al-Hajri S, Naser A, Al Hinai A. 2019. The impact of space syntax spatial attributes on urban land use in Muscat: implications for urban sustainability. Sustain Citi Soc. 46.
- Andrade R, Alves A, Bento C. 2020. POI mining for land use classification: a case study. ISPRS Int J Geo-Inf. 9.
- Bao HQ, Ming DP, Guo Y, Zhang K, Zhou KQ, Du SG. 2020. DFCNN-based semantic recognition of urban functional zones by integrating remote sensing data and POI data. Remote Sens. 12(7):1088.
- Cao K, Guo H, Zhang Y. 2019. Comparison of approaches for urban functional zones classification based on multi-source geospatial data: a case study in Yuzhong District, Chongqing, China. Sustainabil. 11(3):660.
- Cao R, Tu W, Yang CX, Li Q, Liu J, Zhu JS, Qiu GP. 2020. Deep learning-based remote and social sensing data fusion for urban region function recognition. ISPRS J Photogramm Remote Sens. 163:82–97.
- Dong XY, Xu Y, Huang LP, Liu ZG, Xu Y, Zhang KY, Wu GF. 2020. Exploring impact of spatial unit on urban land use mapping with multisource data. Remote Sens. 12(21):3597.
- Dragut L, Tiede D, Levick SR. 2010. ESP: a tool to estimate scale parameter for multiresolution image segmentation of remotely sensed data. Int J Geograph Inform Sci. 24(6):859–871.
- Du S, Du S, Liu B, Zhang X, Zheng Z. 2020. Large-scale urban functional zone mapping by integrating remote sensing images and open social data. Gisci Remote Sens. 57(3):411–430.
- Du SJ, Du SH, Liu B, Zhang XY. 2019. Context-enabled extraction of large-scale urban functional zones from very-high-resolution images: a multiscale segmentation approach. Remote Sens. 11(16):1902.
- Esposito D, Santoro S, Camarda D. 2020. Agent-based analysis of urban spaces using space syntax and spatial cognition approaches: a case study in Bari, Italy. Sustainabil. 12(11):4625.
- Hillier B, Hanson J. 1984. The social logic of space. Cambridge; New York: Cambridge University Press.
- Hinneburg A. 1998. An efficient approach to clustering in large multimedia databases with noise. Know Discov Data Minin. 98:58–65.
- Hu TY, Yang J, Li XC, Gong P. 2016. Mapping urban land use by using landsat images and open social data. Remote Sens. 8(2):151.
- Hu YF, Han YQ. 2019. Identification of urban functional areas based on POI data: a case study of the Guangzhou economic and technological development zone. Sustainabil. 11(5):1385.
- Jiang S, Alves A, Rodrigues F, Ferreira J, Pereira FC. 2015. Mining point-of-interest data from social networks for urban land use classification and disaggregation. Comput Environ Urban Syst. 53:36–46.
- Liu XP, He JL, Yao Y, Zhang JB, Liang HL, Wang H, Hong Y. 2017. Classifying urban land use by integrating remote sensing and social media data. Int J Geograph Inform Sci. 31(8):1675–1696.
- Long Y, Liu X. 2013. Automated identification and characterization of parcels (AICP) with OpenStreetMap and Points of Interest.
- Obaco M, Royuela V, Vitores X. 2020. Identifying functional urban areas in ecuador using a varying travel time approach: FUAs in Ecuador: a varying travel time approach. Geog Anal. 52:107–124.. https://onlinelibrary.wiley.com/doi/10.1111/gean.12190.
- Silverman BW. 1986. Density estimation for statistics and data analysis. London.
- Song JC, Lin T, Li XH, Prishchepov AV. 2018. Mapping urban functional zones by integrating very high spatial resolution remote sensing imagery and points of interest: a case study of Xiamen, China. Remote Sens. 10(11):1737.
- Tian GJ, Sha MQ. 2010. The spatial pattern of guangzhou metropolitan area industry based on point data and GIS. Progress Geograph. 29(4):387–395.
- Wang XY, Zhong YF, Zhang LP, Xu YY. 2019. Blind hyperspectral unmixing considering the adjacency effect. IEEE Trans Geosci Remote Sens. 57(9):6633–6649.
- Wang YD, Wang T, Tsou MH, Li H, Jiang W, Guo FQ. 2016. Mapping dynamic urban land use patterns with crowdsourced geo-tagged social media (Sina-Weibo) and commercial points of interest collections in Beijing, China. Sustainabil. 8(11):1201.
- Xing HF, Meng Y. 2018. Integrating landscape metrics and socioeconomic features for urban functional region classification. Comput Environ Urban Syst. 72:134–145.
- Xu SY, Qing LB, Han LM, Liu M, Peng YH, Shen LF. 2020. A new remote sensing images and point-of-interest fused (RPF) model for sensing urban functional regions. Remote Sens. 12(6):1032.
- Xu ZT, Liang JZ, Xu WX. 2021. Research on correlation between Fuzhou road network form and retail commercial space layout based on spatial syntax. J Geomat. 46(S1):5–10.
- Yao Y, Li X, Liu XP, Liu PH, Liang ZT, Zhang JB, Mai K. 2017. Sensing spatial distribution of urban land use by integrating points-of-interest and Google Word2Vec model. Int J Geograph Inform Sci. 31(4):825–848.
- Yi DS, Yang J, Liu JJ, Liu YS, Zhang J. 2019. Quantitative identification of urban functions with fishers’ exact test and POI data applied in classifying urban districts: a case study within the sixth ring road in Beijing. ISPRS Int J Geo-Inf. 8(12):555.
- Yu BB, Wang ZH, Mu HW, Sun L, Hu FN. 2019. Identification of urban functional regions based on floating car track data and POI data. Sustainability. 11(23):6541.
- Zhan XY, Ukkusuri SV, Zhu F. 2014. Inferring urban land use using large-scale social media check-in data. Network Spatial Econ. 14(3–4):647–667.
- Zhang C, Sargent I, Pan X, Li HP, Gardiner A, Hare J, Atitinson PM. 2018. An object-based convolutional neural network (OCNN) for urban land use classification. Remote Sens Environ. 216:57–70.
- Zhang XY, Du SH, Wang Q. 2017a. Hierarchical semantic cognition for urban functional zones with VHR satellite images and POI data. ISPRS J Photogramm Remote Sens. 132:170–184.
- Zhang XY, Du SH, Zheng ZJ. 2020. Heuristic sample learning for complex urban scenes: Application to urban functional-zone mapping with VHR images and POI data. ISPRS J Photogramm Remote Sens. 161:1–12.
- Zhang Y, Li QZ, Huang HP, Wu W, Du X, Wang HY. 2017b. The combined use of remote sensing and social sensing data in fine-grained urban land use mapping: a case study in Beijing, China. Remote Sensing. 9(9):865.
- Zhao HB, Yu DF, Miao CH, Li GH, Feng YB, Bie QL. 2018. The location distribution characteristics and influencing factors of culturai facilities in Zhengzhou based on POI data. Sci Geograph Sinica. 38(9):1525–1534.
- Zhong YF, Su Y, Wu SQ, Zheng ZD, Zhao J, Ma AL, Zhang LP. 2020. Open-source data-driven urban land-use mapping integrating point-line-polygon semantic objects: a case study of Chinese cities. Remote Sens Environ. 247.
- Zhou W, Ming DP, Lv XW, Zhou KQ, Bao HQ, Hong ZL. 2020. SO-CNN based urban functional zone fine division with VHR remote sensing image. Remote Sens Environ. 236.