
 ?Mathematical formulae have been encoded as MathML and are displayed in this HTML version using MathJax in order to improve their display. Uncheck the box to turn MathJax off. This feature requires Javascript. Click on a formula to zoom.
Abstract
Mongolian pasture plays an essential role in the national economy. Reliable pasture biomass estimation is indispensable to support the agricultural sector and also sustainable livelihood in the country. The aim of this study is to determine an appropriate method to estimate and map pasture biomass in a forest-steppe area of Mongolia. For this purpose, machine learning methods such as random forest (RF), support vector machine (SVM), and partial least squares regression (PLSR) were compared. As data sources, spectral indices derived from Sentinel-2B image of 2019 and field-measured biomass sample datasets were used. To determine the optimal spectral predictor variables, initially, 20 spectral indices were evaluated using the PLSR. Of these, five indices (i.e. ATSAVI2, EVI, GRVI, IPVI and MSR) with the highest correlation coefficients (r ≥ 0.94) were considered for further analysis. These indices were also examined and validated by a variable importance analysis. Then, the RF, SVM, and PLSR models were applied to predict and map pasture biomass using the selected five indices. The PLSR method demonstrated the highest accuracy with coefficient of determination (R2) =0.899 and root mean square error (RMSE)=10.560 g/m2. The SVM technique showed the second highest accuracy with R2=0.837 and RMSE = 12.881 g/m2. The RF model gave the lowest accuracy with R2=0.823 and RMSE = 13.430g/m2. Our research showed that different machine learning models might be applied (because in all cases R2>0.82) for a pasture biomass estimation and mapping in the selected test site, but the best result could be achieved by the use of the PLSR.
1. Introduction
Pastureland plays an important role for the Mongolian animal husbandry, because they are grazing home to over 60 million livestock (NSO Citation2021). It makes up more than 70% of total land area of the country and represents the largest remaining contiguous area of common pastureland in the world. In recent years, the Mongolian pastureland has been seriously deteriorated and pasture yields have decreased. The severe droughts, unregulated land use, and growing number of livestock have been the main factors for the pastureland degradation in most places of the country (Amarsaikhan Citation2017). In addition, pasture condition and yields are very much dependent on the time duration of growing season. Generally, Mongolia’s pasture has a very short growing season, influenced by the highly changing temperatures, and varying precipitation. Due to all of these influencing factors, pasture growth usually begins in mid-May and discontinues after mid-August (Environmental impact assessment Citation2012).
In recent years, the status of pasture condition in Mongolia has been debated with different discussions, including various advanced methods for monitoring and evaluation of pasture carrying capacity and some other indicators (Special Report Citation2017). The carrying capacity is a measurement of how much forage a piece of ground can produce on an average year. It is expressed as the maximum number of livestock that can be grazed for a specific time period without compromising the future production capacity (Meehan et al. Citation2018). The carrying capacity is an important factor that influences the human environment and sustainable development in pastoral areas (Zhang et al. Citation2019). One of the determinants of the pasture carrying capacity is the above ground biomass (AGB). The accurate and timely quantification of pasture biomass has a potentially significant role in helping herders and planners achieve effective grazing management practice (Chen et al. Citation2021).
The estimation of biomass is a challenging task, especially in areas with complex landscapes and varying environmental conditions, and it requires accurate and consistent measurement methods (Kumar et al. Citation2015). The AGB can be evaluated by the use of ground-based conventional methods and modern remotely sensed technology (Chen et al. Citation2018; Chiarito et al. Citation2021). Traditional field methods include visual estimation, cut-dry-weigh, rising plate meter (Hakl et al. Citation2012) and field spectrometry (Psomas et al. Citation2011). There are also some commercially available vehicle-mounted techniques based on height detection (King et al. Citation2010). However, these methods can be labor-intensive, time-consuming and unsuitable for studies of large areas in comparison with the current remote sensing (RS) technology (Chen et al. Citation2021). The RS-based biomass evaluation techniques can provide effective operational tools for assessing the state and changes of AGB in a target area (Lourenco 2021). They can also be used for prompt mapping and cost-effective monitoring of pasture biomass. These capabilities of RS have been increased, especially, with the launch of Sentinel-1,2 satellites (Kumar and Mutanga Citation2017; Wang et al. Citation2019). The images acquired by the Sentinel-1,2 are free of charge, and have higher spatial and temporal resolutions compared to many traditional satellites (e.g. Landsat series) (Song et al. Citation2021).
Generally, RS-based biomass estimates use four types of remotely sensed datasets, including, optical, microwave, hyperspectral, and lidar images with different spatial resolutions. Of these, optical images have wide applications for biomass estimation and the most commonly used datasets include low-resolution AVHRR and MODIS (Li et al. Citation2018), medium-resolution Landsat and SPOT (Gasparri et al. Citation2010; Zhu and Liu Citation2015), and high-resolution IKONOS, Quickbird and Worldview images (Takahashi et al. Citation2010). The low-resolution images have been found to be more effective for biomass estimation at the national and global scales, but they have not been used much, because of the accuracy and difficulty in linking these datasets with field measurements (Chen et al. Citation2021). The high-resolution images can be useful; however, they are expensive to acquire, and affected by terrain shadows, resulting in errors for the biomass estimation (Vaglio et al. Citation2014). In contrast, medium-resolution datasets have been widely used in combination with sample plot data for the AGB estimation at a regional scale, because of the easy access, availability and low cost (Otgonbayar et al. Citation2018). Recently, unmanned aerial vehicles (UAVs) have started to receive more attention in biomass estimation, as they provide very high-resolution images with accuracies ranging from decimeters to centimeters. The studies have shown that very high-resolution multispectral imageries obtained from UAVs can be very useful in assessing not only AGB but for accurate measuring other important biophysical parameters in pasturelands (Matese et al. Citation2015; Zhang et al. Citation2018; Lussem et al. Citation2019; Bazzo et al. Citation2023).
Over the years, different biomass estimation techniques such as RF, SVM, artificial neural network (ANN), cubist, K-nearest neighbour (KNN), Bayesian network, vegetation indices (VI)s, linear or nonlinear regression models have been developed and applied to optical datasets (Lu Citation2005; Mills Citation2011, Cui et al. Citation2012; Wang et al. Citation2017; Filho et al. Citation2020; Zeng et al. Citation2021). Many authors have used either one or combination of these methods and made different judgments. For example, Xie et al. (Citation2009) evaluated grassland aboveground dry biomass in Xilingol River Basin, Inner Mongolia, China using Landsat ETM + data. They applied ANN and multiple linear regression (MLR) models, and concluded that the ANN method provided more accurate estimation than the MLR. Edirisinghe et al. (Citation2011) evaluated the biomass of grazing pasture in Australia using RS-based NDVI and regression model and judged that the model produced good outputs. Grant et al. (Citation2013) estimated biomass in two grassland ecoregions of Alberta, Canada, using 8 VIs derived from SPOT imagery and several transformation models, and underlined that renormalized NDVI and transformed VI provided satisfactory results. Rasanen et al. (Citation2017) applied site-specific and cross-site empirical regressions to map the vegetation AGB using high resolution images and highlighted that the results were acceptable. Zeng et al. (Citation2021) evaluated the grassland AGB in the Three-River Headwater Region, China using RS and other ancillary datasets. For the study RF, cubist, ANN and SVM models have been applied and emphasized that the RF method had the best performance.
In Mongolia, different RS-based pasture biomass studies have been conducted since the mid-1980s (Amarsaikhan Citation2019). One of the first satellite-based research was conducted by Adyasuren (Citation1989), and in the study, the relationships between ground-based biomass measurement and NOAA AVHRR reflectance values were explored. Although, henceforth, a great number of investigations related to the Mongolian pasture, its condition, carrying capacity and dynamics have been carried out (Purevdorj et al. Citation1998; Erdenetuya Citation2004; Javzandulam et al. Citation2005; Karnieli et al. Citation2006; Bat-Oyun et al. Citation2010; Narangarav and Lin Citation2011; Hilker et al. Citation2014; Lamchin et al. Citation2015; Bayaraa et al. Citation2021), the country still lacks advanced methods to predict and map pasture biomass for its planning and management (Otgonbayar et al. Citation2018).
Over the last two decades, a great number of satellite data-based vegetation spectral indices have been developed and investigated by different authors for various test sites (Anderson et al. Citation1993; Todd et al. Citation1998; Clevers et al. Citation2007; Zhang et al. Citation2007, Edirisinghe et al. Citation2011; Fang et al. Citation2011, Alexandridis et al. Citation2014, Dusseux et al. (Citation2015); Otgonbayar et al. Citation2018; Wang et al. Citation2020; Zeng et al. Citation2020). Nonetheless, there are a very few investigations related to the Mongolian case. Kogan et al. (Citation2004) estimated pasture biomass in Mongolia using vegetation health indices derived from NOAA AVHRR data (biomass anomaly R2 = 0.658). Javzandulam et al. (Citation2005) revealed that EVI and biomass values were better correlated than the NDVI for a mountain steppe zone. Sternberg et al. (Citation2011) explored the relationships between field-survey data and NDVI to examine desertification processes in a dryland region. Lamchin et al. (Citation2016) selected NDVI, TGSI (topsoil grain size index), and land surface albedo (as indicators for representing land surface conditions from vegetation biomass, landscape pattern, and micrometeorology) in order to conduct land cover change and desertification assessments in a steppe area. Bayaraa et al. (Citation2021) compared linear regression models between above-ground pasture biomass and seven such indices as NDVI, RDVI, GDVI, SAVI (soil-adjusted vegetation index), OSAVI (optimized soil adjusted vegetation index), ARVI (atmospherically resistant vegetation index), and EVI. As seen, different VIs and individual spectral bands along with other advanced methods are widely used for an improved biomass estimation. However, the research conducted by Otgonbayar et al. (Citation2018) showed that the VIs have better performances than the individual bands. Therefore, this study aims (a) to investigate the applicability of different RS-based VIs to biomass estimation in Mongolia and determine the optimal VIs based on the regression algorithm, and (b) to estimate and map pasture biomass using machine learning methods and determine the appropriate method through comparison of the results.
2. Materials and methods
2.1. Study area
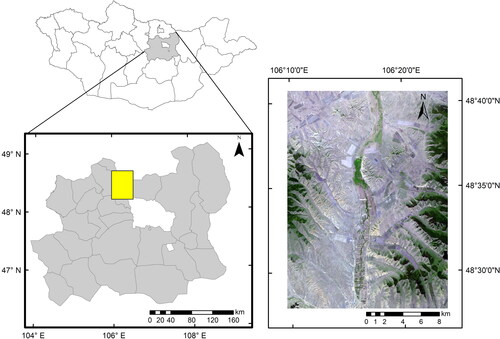
The test site was selected in Bornuur soum of Tuv aimag, situated in 100 km to the north-west from Ulaanbaatar, the capital city of Mongolia (). Although, the soum is spread over an area of more than 1140 sq.km, the study area chosen for the present study extends from the west to the east about 17.3 km and from the north to the south about 23.8 km. It occupies western part of the Khentii Mountain range, which is one the three major mountain ranges in the country. In terms of physical geography, the soum area belongs to a forest-steppe zone and land cover mainly includes such classes as perennial grasses, coniferous forest, perennial forb species (i.e. Stipa krylovii Roshev., Carex duriuscula C.A. Mey., Leymus chinensis Trin., Artemisia Frigida Willd), soil, and agricultural field (Hugjliin Citation2010). The altitude range is between 1000 m and 1500 m with the average altitude of 1100 m above sea level. The soil in this area is fertile and suitable for crop production. The mean annual precipitation is between 200 and 250 mm. It has a cool summer and harsh winter. Mean annual temperature in July is +20 °C, while it is −30 °C in January (Bornuur soum Citation2020).
Figure 1. Location of study area.
2.2. Satellite data preprocessing
In the present study, we selected an orthorectified Sentinel-2B image acquired on July 09, 2019 to estimate the pasture AGB (). Sentinel-2B images have 13 spectral bands and different processing levels (Sentinel-2 User Handbook Citation2015). For our research, data with processing level-2A has been used and downloaded from the ESA’s Copernicus Open Access Hub (https://scihub.copernicus.eu/dhus/#/home). Using the metadata associated with the satellite imagery, initially, radiometric correction was applied to improve the quality of the image. Dark object subtraction was applied for atmospheric correction, which was intended to remove the atmospheric effects. Both radiometric and atmospheric corrections were performed using Semi-Classification Plugin of QGIS. It was not necessary to thoroughly georeference the selected Sentinel-2B data, because the image was in a correct WGS84/UTM zone 48 N system.
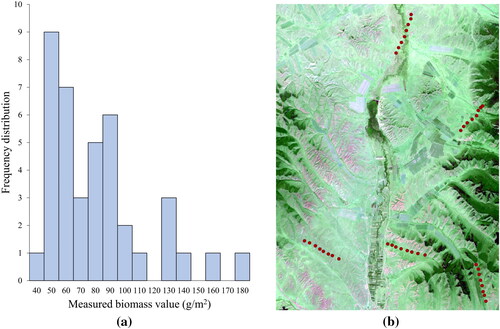
Figure 2. Frequency distribution of the field-measured biomass for the 40 selected sample plots (a), and locations of sampling sites on the Sentinel-2B image (b).
2.3. Field measurement
At the beginning of July 2019, fieldwork was conducted and different sample plots with various biomass conditions were selected. Usually, pasture vegetation in this area reaches its maximum production at the beginning of August (Tserendash Citation2006). Our field survey revealed that pasture vegetation had not reached its maximum height and production, yet. Therefore, selections of the sample plots were mainly based on the distribution of pasture vegetation with similar conditions. The sampling locations were recorded using a handheld global positioning system (GPS) and biomass from each plot was manually collected byb cutting grass to the ground surface in a 70 cm x 70 cm area. The samples were air-dried in the field and oven-dried for 24 h at 80 °C before weighing. Then, the weights were converted to g/m2 and the values of biomass ranged from 39.23 g/m2 to 176.73 g/m2 with a mean biomass value of 77.08 g/m2 having three levels: low, medium, and high biomass. Frequency distribution of the field-measured biomass for the 40 selected sample plots and locations of sampling sites positioned on the Sentinel-2B image are shown in , b.
2.4. Variable determination
Generally, vegetation and soils have been found useful in measuring biophysical properties of different vegetation communities. The underlying reason behind the usage of VIs is that they are important spectral indicators defined to enhance spectral features sensitive to a vegetation property, while reducing different undesired effects (Dorigo et al. Citation2007). With the advent of modern RS technology, spectral bands can be combined in numerous ways to create various VIs, and most of them are successfully used as predictors for vegetation variables along with a variety of statistical models.
In the current study, one of the main research requirements was to determine the appropriate independent variables. So, we have selected 20 indices commonly used for different vegetation analysis (). For the calculation of these VIs, blue, green, red, near infrared (NIR), and short-wave infrared (SNIR) ranges of the electro-magnetic spectrum have been used. In order to thoroughly consider only pasture, non-pasture areas including the agricultural fields and forest areas had been masked and removed from the original Sentinel-2B data before determining the variables. For determination of the masks, boundaries of these classes were screen digitized in ArcGIS system after applying a maximum likelihood decision-rule.
Table 1. Vegetation indices used for the study.
2.5. Machine learning algorithms
In the current study, we used such machine learning methods as a PLSR, RF and SVM for estimation of the pasture biomass in the selected test area.
The PLSR is a quick, efficient and optimal regression method based on covariance. The principle of PLSR is to firstly decompose explanatory variables into a few non-correlated latent variables or components using information contained in the response variable; then to regress the new components against the response variable (Lu et al. Citation2016). In our study, we applied XLSTAT software and the correlation coefficients (r), RMSE and coefficients of determination (R2) between predicted and measured biomass were the criteria used to select the best model with optimal number of components.
The RF is a family of tree-based models; in the first one, data are stratified into homogeneous subsets by decreasing the within-class entropy, whereas in the second one, a large number of regression trees are constructed by selecting random bootstrap samples from the discrete or continuous datasets (Pflugmacher et al. Citation2014). The advantage of RF is that it can run effectively on large data sets, relatively robust to outliers, and efficient to complex training data (Hastie et al. Citation2009; Rodriguez-Galiano et al. Citation2012). For each tree, approximately two-thirds of the original data was randomly chosen to build the tree, and the remaining data was used for estimating out-of-bag error and calculating variable importance. In our study, RF was applied to develop biomass estimation using field measured biomass as reference data and Sentinel-2B image derived spectral indices as predictors.
The SVM algorithm transforms the original space and constructs an optimal hyperplane in multi-dimensional feature space, which divides the data into different classes with the largest possible margin of separation. In the field of digital image processing, it is an important statistical learning algorithm with the ability to work well on noisy data, develop necessary support vectors and use relatively small training sample data to produce comparatively higher estimation accuracy than other classification approaches (Sluiter and Pebesma Citation2010; Lu et al. Citation2016). In the present study, the biomass estimation was performed by applying this technique to field measured biomass and Sentinel-2B image derived spectral indices.
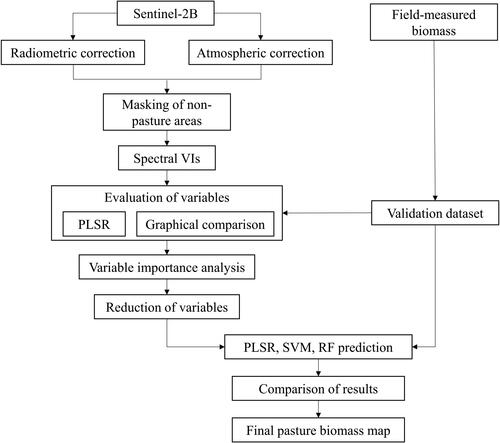
The selected machine learning methods have been used to remotely estimate the pasture biomass in the selected test area. In each model, the spectral indices with highest r values were considered to be independent variable and field measured biomass values were the dependent variable. For implementation of the models, R software was selected. The flowchart of the applied method is shown in .
Figure 3. The flowchart of the applied method.
3. Results and discussion
In Bornuur soum, many factors such as soil types, precipitation, temperature, land-use, human activities, terrain aspect and slope can influence vegetation growth, carrying capacity, and species composition. Especially, terrain aspect and slope can affect sun illumination and moisture distribution that directly influence plant photosynthesis and biomass accumulation as well as measuring of biophysical properties. Also, different soil types have different physical structures and nutrient components, directly influencing the vegetation growth. Climate conditions, particularly precipitation distribution and temperature are important factors that affect vegetation vigor. For example, an accumulated precipitation in Bornuur soum in July 2019 was recorded 30.8 mm, while temperature was +22 °C (Bornuur soum Citation2019). Moreover, different human activities also influence the soil degradation, vegetation area disturbance and destruction. Thus, various natural, geographical and human-induced factors influence the biomass condition in the selected study site.
In the present study, initially, based on the indices shown in , the correlations between the field measured biomass and spectral indices have been estimated using the PLSR model. The resulting correlation coefficients matrix is shown in . As seen from , there are 17 indices (i.e. ATSAVI2, CVI, DVI, EVI, GARI, GDVI, GNDVI, GRVI, GVMI, IPVI, MNDVI, MSAVI, MSR, RDVI, TDVI, TVI, and VARI) with r values greater than 0.90. It is also seen that there are 5 indices (i.e. ATSAVI2, EVI, GRVI, IPVI, and MSR) with r ≥ 0.94 and all of them have been calculated by the use of visible and NIR bands. For calculation of the ATSAVI2, IPVI, and MSR, red and NIR bands have been used, while for creation of the GRVI, green and NIR bands were applied. For formation of the EVI, blue, red and NIR bands were selected. These explain the extensive use of these bands for creation of spectral indices in different forms. Among the highly correlated VIs, the MSR (r = 0.947) can be considered the best index to explain the ground biomass. Compared to other high correlation indices, the EVI demonstrated the second highest result to describe the AGB.
Table 2. Correlation coefficients matrix for the selected VIs and biomass.
As known, the traditional VIs mainly used visible and NIR portions in the optical range, because NIR-based indices have strong relationships with vegetation biomass, with R2 ranging from 0.60 to 0.94 (Poley and McDermid Citation2020). Since the launch of satellites with SWIR bands, the usage of the SWIR region has been intensified among the RS community. For instance, Hill et al. (Citation2016) retrieved fractional cover of photosynthetic vegetation, non-photosynthetic vegetation and bare soil for tropical savannah based on linear unmixing of the two-dimensional response envelope of NDVI and ratio (SWIR) 32 indices derived from MODIS data. Castro and Garbulsky (Citation2018) developed different spectral normalized indices to accurately predict some characteristics in forage species using visible, near and middle infrared ranges. In order to accurately model the biomass of arid steppe area in Algeria, Benseghir and Bachari (Citation2021) used different VIs combining visible and NIR OLI bands, visible and SWIR OLI bands, and also NIR and SWIR OLI bands.
In the case of our study, we used the SWIR bands of Sentinel-2B for calculation of 4 different indices. As could be seen from , it is seen that among the VIs determined by the use of SWIR portions of the electromagnetic spectrum, the GVMI and MNDVI have the highest correlations (r = 0.916), whereas the AFRI has the lowest correlation (r = 0.78). For creation of the GVMI and MNDVI, NIR and SWIR2 bands have been selected, while for calculation of the AFRI, NIR and SWIR1 were used. This indicates that a combination of NIR and SWIR2 bands can be used for development of proper spectral indices to evaluate AGB in pasture areas, but a combined use of NIR and SWIR1 is not suitable for assessing pasture biomass values. Nevertheless, they can still be applied along with other high correlation indices for proper pasture biomass estimation and mapping.
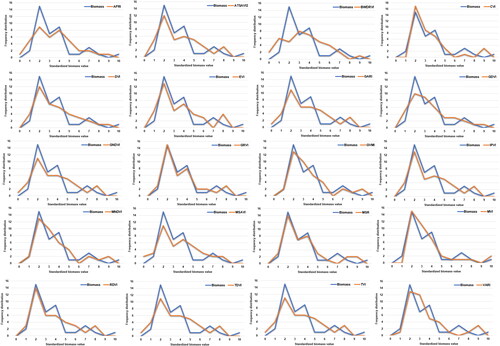
To support the conducted analysis, compared evaluation was carried out graphically illustrating the relationship between the field measured biomass and determined VIs. In practical applications of RS image analysis, such comparisons are important for accurate determination of the appropriate variables. As could be seen from the research, the initial spectral indices and biomass values have been represented in different units. As a result, it was difficult to identify them in the same space. Therefore, to overcome this problem the variable values were standardized by the use of the following formula:
(1)
(1)
Where X is the observed variable; mean and SD are the mean and standard deviations.
After the standardization, all values have been ranged from −1.5 to 3.5. We divided the new values into 11 groups with a 0.5 interval to present them in a graph relating to the number of measurements. The comparison of the standardized biomass and VI values are shown in . As seen from , the GRVI and MSR indices have very high overlaps with the measured biomass, while the ATSAVI2, CVI, EVI, IPVI, RDVI indices have the second highest relationship with the dependent variable. Thus, it is seen that the relationship between the biomass and VI values of all five spectral indices having the highest r values (0.94 or more) can be graphically illustrated and validated.
Figure 4. Relationship between the field measured biomass and VI values.
After investigating the relationships among the dependent and independent variables, the selected RF, SVM and PLS methods have been used to classify the determined 5 spectral indices (i.e. ATSAVI2, EVI, GRVI, IPVI, and MSR) with the highest r values. The classification outputs (i.e. biomass maps) are shown in .
Figure 5. The estimated biomass maps using: (a) PLSR, (b) SVM, (c) RF model.
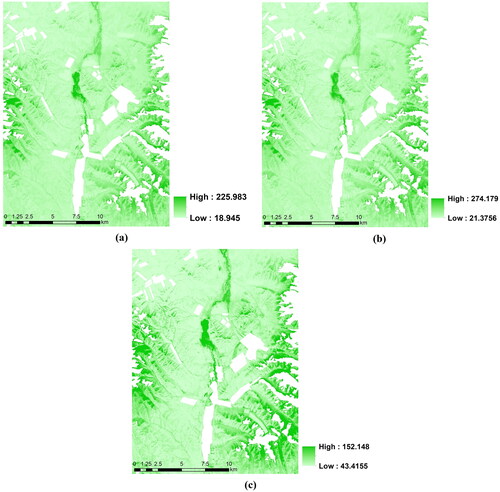
Furthermore, to evaluate the quality of the applied models, two broadly used statistical measurements, coefficient of determination (R2) and root mean square error (RMSE) (Richter et al. Citation2012) have been used. The most common interpretation of R2 is how well the model fits the observed data, and a higher coefficient indicates a better fit for the model. The RMSE provides information about the performance of a model by allowing a comparison of the actual difference between the estimated and observed values, and the smaller the value, the better the performance of the used model.
As seen from , among the selected models, the PLSR method demonstrates the highest accuracy, because it results in R2=0.899 and RMSE = 10.560 g/m2. The performance of the SVM technique shows the second highest accuracy having R2=0.837 and RMSE = 12.881 g/m2. In contrast, the RF model results in the lowest accuracy. Here, both coefficient of determination (R2=0.823) and root-mean-square error (RMSE = 13.430g/m2) exhibit lower values compared to the other two methods.
Table 3. Summary statistics (R2 and RMSE) for the selected biomass prediction methods.
In case of the entire Mongolian pastureland, Otgonbayar et al. (Citation2018) applied PLSR and RF models along with the selected spectral indices to estimate pasture biomass. In their study, the PLSR result showed a satisfactory correlation between field measured and estimated biomass with R2= 0.750 and RMSE = 101.10 kg ha−1. The RF regression gave slightly better results with R2=0.764 and RMSE = 98.00 kg ha−1. As seen, R2 values of both models are lower and RMSE values are highly scattered compared to the results of our estimations.
Thus, in the case of the selected test site (i.e. forest-steppe zone), the result of the PLSR method is superior to the other techniques. In recent years, a number of livestock has been substantially increased in many regions of Mongolia. Therefore, the final output biomass map derived from this study could be accurately used for pasture/land use planning and management in Bornuur soum. Nevertheless, other two models can also be used for other cases, because of their high accuracies and lower RMSEs.
Conclusion
In this research, an appropriate model for predicting pasture biomass in Bornuur soum of Tuv aimag, Mongolia was defined by comparing the PLSR, RF, and SVM methods. To determine the optimal spectral predictor variables, initially, 20 spectral indices were calculated using visible, NIR, SWIR1, and SWIR2 bands of Sentinel-2B image of 2019. These indices were evaluated using the PLSR method. For the training, reference biomass datasets collected from 40 sample plots were used. The PLSR revealed seventeen indices with r > 0.90, and five indices with r ≥ 0.94, accordingly. Then, compared evaluation was carried out graphically illustrating the relationships between the field measured biomass and spectral indices. The comparison confirmed the relationships between the biomass and VI values, including the indices with the highest r values. These five most important spectral indices were ATSAVI2, EVI, GRVI, IPVI, and MSR, and they were based on the visible and NIR bands. By combining these indices in the selected models, their specific contribution to the high-quality outputs, could be increased. The RF, SVM and PLS methods were applied to classify the five VIs. When the results of the classifications for predicting pasture biomass and producing appropriate maps were compared, the PLSR technique showed the highest accuracy, resulting in R2 of 0.899 and RMSE of 10.560 g/m2. The SVM technique gave the second-best result having R2 of 0.837 and RMSE of 12.881 g/m2. The performance of the RF model was not sufficient enough compared to the other two methods and it demonstrated the lowest accuracy (R2 = 0.823 and RMSE = 13.430g/m2). In practice R2 values of greater than 0.8 could still be considered good enough to evaluate the selected models. Therefore, it was concluded that the PLSR should be used for the pasture biomass estimation and mapping in a forest-steppe zone of Mongolia, although other methods such as RF and SVM could also be considered.
Disclosure statement
The authors have no potential conflict of interest or no competing interests to declare.
References
- Adyasuren T. 1989. Remote sensing technology for evaluation of biomass in Mongolia, PhD thesis. Ulaanbaatar, Mongolia; p. 156.
- Alexandridis T, Oikonomakis N, Gitas I, Eskridge K, Silleos N. 2014. The performance of vegetation indices for operational monitoring of CORINE vegetation types. Int J Remote Sens. 35(9):3268–3285.
- Amarsaikhan D. 2017. Environmental studies of Mongolia using advanced spatial techniques. Proceedings of the International Conference on Natural Condition and Territorial Location Aspects, Ulaanbaatar, Mongolia; p. 280–289.
- Amarsaikhan D. 2019. Principles of modern RS and GIS. Ulaanbaatar, Mongolia: Erdem Press of MAS; p. 263.
- Anderson GL, Hanson JD, Haas RH. 1993. Evaluating Landsat Thematic Mapper derived vegetation indices for estimating above-ground biomass on semiarid rangelands. Remote Sens Environ. 45(2):165–175.
- Arnon K, Yoram JK, Lorraine R, Andrew W. 2001. AFRI-aerosol free vegetation index. Remote Sens Environ. 77:10–21.
- Baloloy AB, Blanco AC, Sta ARRC, Nadaoka K. 2020. Development and application of a new mangrove vegetation index (MVI) for rapid and accurate mangrove mapping. ISPRS J Photogramm Remote Sens. 166:95–117.
- Bannari A, Asalhi H, Teillet PM. 2002. Transformed difference vegetation index (TDVI) for vegetation cover mapping. In: Proceedings of the IEEE International Geoscience and Remote Sensing Symposium IGARSS '02, Toronto, Canada; p. 3053–3055.
- Baret F, Guyot G. 1991. Potentials and limits of vegetation indices for LAI and APAR assessment. Remote Sens Environ. 35(2-3):161–173.
- Bat-Oyun T, Shinoda M, Tsubo M. 2010. Estimation of pasture productivity in Mongolian grasslands: field survey and model simulation. J Agric Meteorol. 66(1):31–39.
- Bayaraa B, Akira H, Myagmartseren P, Battsengel V, Byambasuren D, Enkhjargal N. 2021. Applicability of different vegetation indices for pasture biomass estimation in the north-central region of Mongolia. Geocarto Int. 37(25):7415-7430.
- Bazzo COG, Kamali B, Hütt C, Bareth G, Gaiser T. 2023. A review of estimation methods for aboveground biomass in grasslands using UAV. Remote Sens. 15(3):639.
- Benseghir L, Bachari N. 2021. Shortwave infrared vegetation index-based modelling for aboveground vegetation biomass assessment in the arid steppes of Algeria. African J Range Forage Sci. 38(4):281–290.
- Bornuur soum. 2020., National Development Agency of Mongolia http://ldi.nda.gov.mn/?province_id=18®ion_id=366.
- Bornuur soum. 2019. Information and Research Institute of Meteorology, Hydrology and Environment. https://irimhe.namem.gov.mn/.
- Castro P, Garbulsky M. 2018. Spectral normalized indices related with forage quality in temperate grasses: scaling up from leaves to canopies. Int J Remote Sens. 39(10):3138–3163.
- Ceccato P, Gobron N, Flasse S, Pinty B, Tarantola S. 2002. Designing a spectral index to estimate vegetation water content from remote sensing data: part 1 Theoretical approach. Remote Sens Environ. 82(2-3):188–197.
- Chen JM. 1996. Evaluation of vegetation indices and a modified simple ratio for boreal applications. Can J Remote Sens. 22, 3:229–242.
- Chen L, Ren C, Zhang B, Wang Z, Xi Y. 2018. Estimation of forest above-ground biomass by geographically weighted regression and machine learning with sentinel imagery. Forests. 9(10):582–520.
- Chen Y, Guerschman J, Shendryk Y, Henry D, Harrison MT. 2021. Estimating pasture biomass using Sentinel-2 imagery and machine learning. Remote Sens. 13(4):603.
- Chiarito E, Cigna F, Cuozzo G, Fontanelli G, Aguilar A, Paloscia S, Rossi M, Santi E, Tapete E, Notarnicola C. 2021. Biomass retrieval based on genetic algorithm feature selection and support vector regression in Alpine grassland using ground-based hyperspectral and Sentinel-1 SAR data. Eur J Remote Sens. 54(1):209–225.
- Clevers J, Van der Heijden G, Verzakov S, Schaepman ME. 2007. Estimating grassland biomass using SVM band shaving of hyperspectral data. Photogramm Eng Remote Sens. 73(10):1141–1148.
- Crippen RE. 1990. Calculating the vegetation index faster. Remote Sens Environ. 34(1):71–73.
- Cui X, Zheng G, Tian L, Yu S, Xing L, Yong L. 2012. Classification management for grassland using MODIS data: a case study in the Gannan region, China. Int J Remote Sens. 33(10):3156–3175.
- Dorigo WA, Zurita-Milla R, Wit A, Brazile J, Singh R, Schaepman ME. 2007. A review on reflective remote sensing and data assimilation techniques for enhanced agroecosystem modeling. Int J Appl Earth Obs Geoinf. 9(2):165–193.
- Dusseux P, Hubert-Moy L, Corpetti T, Vertès F. 2015. Evaluation of SPOT imagery for the estimation of grassland biomass. Int J Appl Earth Obs Geoinf. 38:72–77.
- Edirisinghe A, Hill MJ, Donald GE, Hyder M. 2011. Quantitative mapping of pasture biomass using satellite imagery. Int J Remote Sens. 32(10):2699–2724.
- Environmental impact assessment. 2012. Oyu Tolgoi Report on Environmental impact assessment, ECO-TRADE LLC, Ulaanbaatar, Mongolia, p. 34.
- Erdenetuya M. 2004. Pasture productivity monitoring using long term satellite and ground truth data. Proc Climate Change Arid Semi-Arid Regions Mongolia. 6(1):168–173.
- Fang H, Liang S, Hoogenboom G. 2011. Integration of MODIS LAI and vegetation index products with the CSM-CERES-Maize model for corn yield estimation. Int J Remote Sens. 32(4):1039–1065.
- Filho MG, Kuplich TM, Quadros FLF. 2020. Estimating natural grassland biomass by vegetation indices using Sentinel 2 remote sensing data. Int J Remote Sens. 41(8):2861–2876.
- Gasparri NI, Parmuchi MG, Bono J, Karszenbaum H, Montenegro CL. 2010. Assessing multi-temporal Landsat 7 ETM + images for estimating above-ground biomass in subtropical dry forests of Argentina. J Arid Environ. 74(10):1262–1270.
- Gitelson AA, Kaufman YJ, Stark R, Rundquist D. 2002. Novel algorithms for remote estimation of vegetation fraction. Remote Sens Environ. 80, 1:76–87.
- Grant KM, Johnson DL, Hildebrand DV, Peddle DR. 2013. Quantifying biomass production on rangeland in southern Alberta using SPOT imagery. Can J Remote Sens. 38(6):695–708. pp
- Hakl J, Hrevušová Z, Hejcman M, Fuksa P. 2012. The use of a rising plate meter to evaluate lucerne (Medicago sativa L.) height as an important agronomic trait enabling yield estimation. Grass Forage Sci. 67(4):589–596.
- Hastie T, Tibshirani R, Friedman J. 2009. The elements of statistical learning. Data mining, inference, and prediction. New York (NY): Springer Science + Business Media.
- Hilker T, Natsagdorj E, Waring RH, Lyapustin A, Wang Y. 2014. Satellite observed widespread decline in Mongolian grasslands largely due to overgrazing. Glob Change Biol. 20(2):418–428.
- Hill M, Zhou Q, Sun Q, Schaaf C, Southworth J, Mishra N, Gibbes C, Bunting E, Christiansen T, Crews K. 2016. Dynamics of the relationship between NDVI and SWIR32 vegetation indices in southern Africa: implications for retrieval of fractional cover from MODIS data. Int J Remote Sens. 37(6):1476–1503.
- Huete A, Didan K, Miura T, Rodriguez EP, Gao X, Ferreira LG. 2002. Overview of the radiometric and biophysical performance of the MODIS vegetation indices. Remote Sens Environ. 83(1-2):195–213.
- Hugjliin E. 2010. Socio-economic baseline survey for Bornuur Soum, Tuv Aimag, Mongolia Sustainable Artisanal Mining Project, SADC, Mongolia.
- Javzandulam T, Tateishi R, Sanjaa T. 2005. Analysis of vegetation indices for monitoring vegetation degradation in semi-arid and arid areas of Mongolia. Int J Environ Study. 62(2):215–225.
- Jurgens C. 1997. The modified normalized difference vegetation index (mNDVI) a new index to determine frost damages in agriculture based on Landsat TM data. Int J Remote Sens. 18(17):3583–3594.
- Karnieli A, Bayasgalan M, Bayarjargal Y, Agam N, Khudulmur S, Tucker CJ. 2006. Comments on the use of the vegetation health index over Mongolia. Int J Remote Sens. 27(10):2017–2024.
- King WM, Rennie GM, Dalley DE, Dynes RA, Upsdell MP. 2010. Pasture Mass Estimation by the C-Dax Pasture Meter: regional Calibrations for New Zealand. In Proceedings of the 4th Australasian Dairy Science Symposium, Lincoln, New Zealand, 31 August–2 September 2010.
- Kogan F, Stark R, Gitelson A, Jargalsaikhan L, Dugrajav C, Tsooj S. 2004. Derivation of pasture biomass in Mongolia from AVHRR-based vegetation health indices. Int J Remote Sens. 25(14):2889–2896.
- Kumar L, Sinha P, Taylor S, Alqurashi AF. 2015. Review of the use of remote sensing for biomass estimation to support renewable energy generation. J Appl Remote Sens. 9(1):097696. 097696.
- Kumar L, Mutanga O. 2017. Remote sensing of above-ground biomass. Remote Sens. 9(9):935–938.
- Lamchin M, Park T, Lee JY, Lee WK. 2015. Monitoring of vegetation dynamics in the Mongolia using MODIS NDVIs and their relationship to rainfall by natural zone. J Indian Soc Remote Sens. 43(2):325–337.
- Lamchin M, Lee JY, Lee WK, Lee EJ, Kim M, Lim CH, Choi HA, Kim SR. 2016. Assessment of land cover change and desertification using remote sensing technology in a local region of Mongolia. Adv Space Res. 57(1):64–77.
- Li X, Du H, Mao F, Zhou GM, Chen L, Xing LQ, Fan WL, Xu XJ, Liu YL, Cui L, et al. 2018. Estimating bamboo forest aboveground biomass using EnKF-assimilated MODIS LAI spatiotemporal data and machine learning algorithms. Agric for Meteorol. 256–257:445–457.
- Louhaichi M, Borman MM, Johnson DE. 2001. Spatially located platform and aerial photography for documentation of grazing impacts on wheat. Geocarto Int. 16(1):65–70.
- Lourenço P. 2021. Biomass estimation using satellite-based data, forest biomass - from trees to energy, Ana Cristina Gonçalves, Adélia Sousa and Isabel Malico, IntechOpen, Available from: https://www.intechopen.com/chapters/73176.
- Lu D. 2005. Aboveground biomass estimation using Landsat TM data in the Brazilian Amazon. Int J Remote Sens. 26(12):2509–2525.
- Lu D, Chen Q, Wang G, Liu L, Li G, Moran E. 2016. A survey of remote sensing-based aboveground biomass estimation methods in forest ecosystems. Int J Digital Earth. 9(1):63-105.
- Lussem U, Bolten A, Menne J, Gnyp ML, Schellberg J, Bareth G. 2019. estimating biomass in temperate grassland with high resolution canopy surface models from UAV-based RGB images and vegetation indices. J Appl Rem Sens. 13(03):1. 034525.
- Matese A, Toscano P, Di Gennaro SF, Genesio L, Vaccari FP, Primicerio J, Belli C, Zaldei A, Bianconi R, Gioli B. 2015. Intercomparison of UAV, aircraft and satellite remote sensing platforms for precision viticulture. Remote Sens. 7(3):2971–2990.
- Meehan M, Sedivec K, Printz J, Brummer F. 2018. Determining Carrying Capacity and Stocking Rates for Range and Pasture in North Dakota, North Dakota State University Extension, USA, p. 12.
- Mills P. 2011. Efficient statistical classification of satellite measurements. Int J Remote Sens. 32(21):6109–6132.
- Narangarav D, Lin C. 2011. Investigation of vegetation dynamics of Mongolia using time series of NDVI in response to temperature and precipitation. Mongolian J Biol Sci. 9(1–2):9–17.
- Otgonbayar M, Clement A, Jonathan C, Damdinsuren A. 2018. Mapping pasture biomass in Mongolia using Partial Least Squares, Random Forest regression and Landsat 8 imagery. Int J Remote Sens. 40:1–23.
- NSO. 2021. Report of National Statistical Office (NSO) of Mongolia.
- Pflugmacher D, Cohen WB, Kennedy RE, Yang Z. 2014. Using Landsat-derived disturbance and recovery history and lidar to map forest biomass dynamics. Remote Sens Environ. 151:124–137.
- Poley LG, McDermid GJ. 2020. A systematic review of the factors influencing the estimation of vegetation aboveground biomass using unmanned aerial systems. Remote Sens. 12(7):1052.
- Psomas A, Kneubühler M, Huber S, Itten K, Zimmermann NE. 2011. Hyperspectral remote sensing for estimating aboveground biomass and for exploring species richness patterns of grassland habitats. Int J Remote Sens. 32(24):9007–9031.
- Purevdorj TS, Tateishi R, Ishiyama T, Honda Y., 1998. Relationships between percent vegetation cover and vegetation indices. Int J Remote Sens. 19(18):3519–3535.
- Qi J, Chehbouni A, Huete AR, Kerr YH, Sorooshian S. 1994. A modified soil adjusted vegetation index. Remote Sens Environ. 48, 2:119–126.
- Rasanen A, Juutinen S, Aurela M, Virtanen T. 2017. Modeling above-ground biomass across multiple circum-arctic tundra sites using high spatial resolution remote sensing. EGU General Assembly Conference Abstracts, pp. 4741.
- Richardson AJ, Weigand C. 1977. Distinguishing vegetation from soil background information. Photogramm Eng Remote Sens. 43(12):1541-1552.
- Richter K, Hank TB, Mauser W, Atzberger C. 2012. Derivation of biophysical variables from earth observation data: validation and statistical measures. J Appl Remote Sens. 6(1):063557–1. 063557.
- Rodriguez-Galiano VF, Ghimire B, Rogan J, Chica-Olmo M, Rigol-Sanchez JP. 2012. An assessment of the effectiveness of a random forest classifier for land-cover classification. ISPRS J Photogramm Remote Sens. 67:93–104.
- Roujean JL, Breon FM. 1995. Estimating PAR absorbed by vegetation from bidirectional reflectance measurements. Remote Sens Environ. 51, 3:375–384.
- Rouse J. Jr. 1974. Monitoring the vernal advancement and retrogradation (green wave effect) of natural vegetation. NASA Technical Reports Server (NTRS) 19750020419, Texas, USA.
- Sentinel-2 User Handbook. 2015. ESA Standard Document. ESA, 64.
- Sluiter R, Pebesma EJ. 2010. Comparing techniques for vegetation classification using multi- and hyperspectral images and ancillary environmental data. Int J Remote Sens. 31(23):6143–6161.
- Song XP, Huang W, Hansen MC, Potapov P. 2021. An evaluation of Landsat, Sentinel-2, Sentinel-1 and MODIS data for crop type mapping. Sci Remote Sens. 3:100018. volumeISSN 2666-0172,
- Special Report. 2017. Report of FAO/WFP crop and livestock assessment mission to Mongolia, Rome, Italy, p. 44.
- Sripada RP, Heiniger RW, White JG, Weisz R. 2005. Aerial color infrared photography for determining late-season nitrogen requirements in corn. Agron J. 97, 5:1443–1451.
- Sternberg T, Tsolmon R, Middleton N, Thomas D. 2011. Tracking desertification on the Mongolian steppe through NDVI and field-survey data. Int J Digital Earth. 4(1):50–64.
- Takahashi HG, Yoshikane T, Hara M, Takata K, Yasunari T. 2010. High-resolution modelling of the potential impact of land surface conditions on regional climate over Indochina associated with the diurnal precipitation cycle. Int J Climatol. 30(13):2004–2020.
- Todd SW, Hoffer RM, Milchunas DG. 1998. biomass estimation on grazed and ungrazed rangelands using spectral indices. Int J Remote Sens. 19(3):427–438.
- Tserendash S. 2006. Theoretical basis for pasture use. Ulaanbaatar: EDO publishing Co., LTD.
- Vaglio LG, Chen Q, Lindsell J, Coomes D, Del FF, Guerriero L, Pirotti F, Valentini R. 2014. Above ground biomass estimation in an African tropical forest with lidar and hyperspectral data. ISPRS J Photogramm Remote Sens. 89:49–58.
- Vincini M, Frazzi E, D’Alessio P. 2007. Comparison of narrow-band and broad-band vegetation indexes for canopy chlorophyll density estimation in sugar beet. In J. V. Stafford (Ed.), Precision agriculture ‘07: Proceedings of the 6th European Conference on Precision Agriculture, pp. 189–196.
- Wang F, Huang J, Tang Y, Wang X. 2007. New vegetation index and its application in estimating leaf area index of rice. Rice Sci. 4:195–203.
- Wang YY, Wu GL, Deng L, Tang ZS, Wang KB, Sun WY, Shangguan ZP. 2017. Prediction of aboveground grassland biomass on the Loess Plateau, China, using a random forest algorithm. Sci Rep. 7(1):6940.
- Wang J, Xiao X, Bajgain R, Starks P, Steiner J, Doughty RB Chang Q. 2019. Estimating leaf area index and aboveground biomass of grazing pastures using Sentinel-1, Sentinel-2 and Landsat images. ISP RS J Photogram Remote Sens. 154(June):189–201.
- Wang S, Zhang Y, Ju W, Qiu B, Zhang Z. 2020. Tracking the seasonal and inter–annual variations of global gross primary production during last four decades using satellite near–infrared reflectance data. Sci Total Environ. 755(Pt 2):142569–142510. 1016/j.scitotenv.2020.142569.
- Xie Y, Sha Z, Yu M, Bai Y, Zhang L. 2009. A comparison of two models with Landsat data for estimating above ground grassland biomass in Inner Mongolia, China. Ecol Modell. 220:1810–1818.
- Zeng N, He H, Ren X, Zhang L, Zeng Y, Fan J, Li Y, Niu Z, Zhu X, Chang Q. 2020. The utility of fusing multi-sensor data spatio-temporally in estimating grassland aboveground biomass in the three-river headwaters region of China. Int J Remote Sens. 41:7068–7089.
- Zeng N, Ren X, He H, Zhang L. 2021. Estimating the grassland aboveground biomass in the Three-River Headwater Region of China using machine learning and Bayesian model averaging. Environ Res Lett. 16:114020.
- Zhang B, Wu D, Zhang L, Jiao Q, Li Q. 2012. Application of hyperspectral remote sensing for environment monitoring in mining areas. Environ. Earth Sci. 65(3):649–658.
- Zhang H, Sun Y, Chang L, Qin Y, Chen J, Qin Y, Du J, Yi S, Wang Y. 2018. Estimation of grassland canopy height and aboveground biomass at the quadrat scale using unmanned aerial vehicle. Remote Sens. 10:851.
- Zhang L, Furumi S, Muramatsu K, Fujiwara N, Daigo M, Zhang L. 2007. A new vegetation index based on the universal pattern decomposition method. Int J Remote Sens. 28:107–124.
- Zhang J, Zhang L, Liu X, Qiao Q. 2019. Research on sustainable development in an alpine pastoral area based on equilibrium analysis between the grassland yield, livestock carrying capacity, and animal husbandry population. Sustainability. 11:4659.
- Zhu X, Liu D. 2015. Improving forest aboveground biomass estimation using seasonal Landsat NDVI time-series. ISPRS J Photogramm Remote Sens. 102:222–231.