
 ?Mathematical formulae have been encoded as MathML and are displayed in this HTML version using MathJax in order to improve their display. Uncheck the box to turn MathJax off. This feature requires Javascript. Click on a formula to zoom.
Abstract
The quantitative description of meteorological drought from various geographical locations and indicators is crucial for early drought warning to avoid its negative impacts. Therefore, the current study proposes a new framework to comprehensively accumulate spatial and temporal information for meteorological drought from various stations and drought indicators (indices). The proposed framework is based on two major components such as the Monthly-based Monte Carlo Feature Selection (MMCFS,) and Monthly-based Joint Index Weights (MJIW). Besides, three commonly used SDI are jointly assessed to quantify drought for selected geographical locations. Moreover, the current study uses the monthly data from six meteorological stations in the northern region for 47 years (1971-2017) for calculating SDI values. The outcomes of the current research explicitly accumulate regional spatiotemporal information for meteorological drought. In addition, results may serve as an early warning to the effective management of water resources to avoid negative drought impacts in Pakistan.
1. Introduction
Drought is a recurrent natural hazard that has negative influences on upsetting the lives of people directly or indirectly (SafarianZengir et al. Citation2020; Tramblay et al. Citation2020; Orimoloye et al. Citation2022; Savari et al. Citation2022; Shahpari et al. Citation2022). It occurs due to continuous less-than-normal precipitation (Tramblay et al. Citation2020; Chandrasekara et al. Citation2021; Pachore and Regulwar Citation2021; Lotfirad et al. Citation2022). Subsequently, its potential negative outcomes affect the depletion of water supply, agriculture production, energy construction, and socio-economic events worldwide (Warrick and Bowden Citation1981; Zseleczky and Yosef Citation2014; Crawford Citation2019; Lottering et al. Citation2021; Huizhi et al. Citation2022; Moisa et al. Citation2022). Usually, droughts are grouped into four kinds meteorological, agricultural, hydrological, and socio-economic (Vicente-Serrano et al. Citation2012; Leng et al. Citation2015). Meteorological drought is differentiated as the continuous deficiency in normal precipitation (Tesfamariam et al. Citation2019; Pandey et al. Citation2022; Sharma et al. Citation2022), while an agricultural drought typically leads to a shortage of soil moisture (Alahacoon et al. Citation2021). Further, hydrological drought can be involved with the scarcity of water levels in the hydrological systems (Tabari et al. Citation2013; Van Loon Citation2015), and socioeconomic drought is a weather-related absence of water that affects the demand for economic goods (Mohammed et al. Citation2022).
Among the classified drought categories, a meteorological drought is an atmospheric incident that occurs only because of a shortfall in precipitation. Moreover, meteorological drought interlinks the other drought categories (agricultural, hydrological, and socio-economic). Hence, monitoring and assessment of the meteorological drought is the initiation point to improving operational drought monitoring capabilities and mitigation measures. Various indices have been formulated for assessing and monitoring meteorological drought events in varying climatic regions (Keyantash and Dracup Citation2004; Ceglar et al. Citation2008; Kao and Govindaraju Citation2010; Carrão et al. Citation2016; Limones et al. Citation2022). Further, these indices are frequently used to develop new methods and procedures for drought assessment monitoring and its forecasting to enhance the operational drought monitoring abilities and mitigation measures (Mishra and Singh Citation2010; Citation2011; Hernandez and Uddameri Citation2014). During the past few decades, spatiotemporal analysis has been reflected as a crucial subject in operational monitoring for policy decisions. A spatiotemporal analysis in drought monitoring and assessment gives more meaningful information for drought characterization. Infect, the systematic spatiotemporal drought severity analysis is one of the important mitigation steps for establishing a more drought-resilient society (Ganguli and Ganguly Citation2016; Gebrehiwot et al. Citation2022; Huizhi et al. Citation2022).
In this regard, several researchers have analyzed spatiotemporal information on drought occurrences for assessing and monitoring meteorological drought (Zerouali et al. Citation2021; Yue et al. Citation2022). Several methods and procedures for drought monitoring and assessment are promising (Afshar et al. Citation2022; Ghaleni et al. Citation2022; Sharma et al. Citation2022; Yildirim and Rahman Citation2022). Moreover, several researchers have analyzed spatiotemporal information on drought occurrences in homogeneous regions (Niaz et al. Citation2022c, 2022f). Niaz et al. (Citation2022c, Citation2022e) have provided credible frameworks to characterize spatiotemporal drought occurrences in a homogeneous region. However, these studies have not collected the information from seasonal characteristics of the selected stations. This concern underlines a new direction for the development of effective frameworks to accumulate more inclusive and precise spatiotemporal information for the severity of meteorological drought.
Therefore, in the current study, we aimed to propose a new framework to comprehensively accumulate spatial and temporal information from several stations and drought indicators (indices). The proposed framework is mainly based on two major components such as the Monthly-based Monte Carlo Feature Selection (MMCFS,) and Monthly-based Joint Index Weights (MJIW). The use of the MMCFS in the proposed framework makes this study more efficient and precise for analyzing, assessing, and monitoring spatiotemporal drought occurrences in the selected region. Further, three commonly used Standardized Drought Indices (SDI) including Standardized Precipitation Index (SPI), Standardized Precipitation Evapotranspiration Index (SPEI), and Standardized Precipitation Temperature Index (SPTI) are mutually evaluated to compute drought class numerically. Also, the monthly data from varying climatic stations in the northern region for 47 years (1971-2017) is employed for computing the selected drought indices. The associated outcomes of the current research explicitly monitor and accumulate spatial and temporal information on meteorological drought. Further, the findings of the current study may provide an early warning to the effective management of water resources to prevent negative drought impacts in Pakistan.
2. Materials and methods
2.1. Description of study area
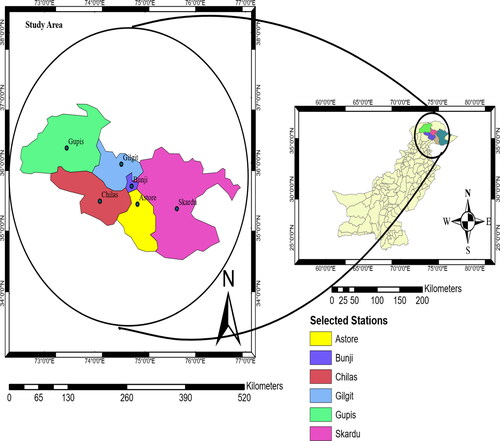
The geographic coordinates of the Gilgit-Baltistan (GB) province of Pakistan are 35° 55′ 15.0024'' N and 74° 18′ 30.0024'' E covering a total area is 72,971 km2. Climatically, GB possesses a substantial measure of variety. It has high mountainous ranges consisting of K2, Nanga Parbat, Gasherbrum-I, Broad Peak, and Gasherbrum-II that are exceedingly cold in winter while the summer is very pleasant. Further, it has the longest glaciers including Biafo Glacier, Baltoro Glacier, and Batura Glacier. Gilgit-Baltistan also has a number of high-altitude lakes. Based on these climatological features the GB has been split into three distinct climate regions, namely, mild, cool, and cold, based on temperature. In contrast, it was split up into dry, semi-arid, and undifferentiated highlands depending on precipitation. The coldest and hottest regions of the GB are Astor and Skardu, respectively. In GB station Astore experiences the most precipitation, whereas Gupis station experiences the least. Moreover, based on the variability of meteorological components the GB has been split into three macro, three meso, and six microclimatic stations. In the recent past climate change has negatively affected this region. Infect, the climatology of the GB considerably contributes to the reservoir system of other parts of the country. Further, drought in GB, directly and indirectly, disturbs the flow of the downstream rivers and tributaries, which can adversely affect agricultural production and livestock of the entire country. Hence, the selected region has significance, therefore the region needs more attention is needed for drought monitoring. Therefore, in order to improve the ability to assess drought occurrences and to facilitate drought monitoring and water resource management in the chosen region, a new framework is developed.
2.2. Data and methods
The data is collected from Pakistan Meteorological Department (PMD). The data of respective characteristics including precipitation, minimum, and maximum temperature were recorded for 47 years from January 1971 to December 2017 in six meteorological stations. Certain meteorological stations significantly cover the Gilgit-Baltistan region of Pakistan (). The climate of the chosen stations has been substantially contributing to the reservoirs and agricultural systems around the country. Based on their importance, several publications have considered these stations for drought analysis (Ali et al. Citation2019; Niaz et al. Citation2020b; Citation2021a, Citation2021b, Citation2021e, Citation2021f; Citation2022a, Citation2022b, Citation2022d, Citation2022e). Drought in the selected region directly or indirectly affects the flow of the downstream rivers and tributaries, which causes adverse effects on agricultural production and livestock of other parts of the country (Khan et al. Citation2003). Thus, more consideration is required for drought monitoring and early warning systems in the nominated region. Therefore, the proposed framework of the current study becomes the key source for taking more consideration to regional drought monitoring and early warning systems.
Figure 1. The potential of the current framework can be observed from the selected stations. The GB is selected for the current analysis. Several mountains of the selected region are famous across the world. The mountains are Karakoram, Himalayas, and Hindukush are well known and located in GB. The agricultural irrigation structure of other zones is also associated with the precipitation of the selected stations. Therefore, the selected region has importance, thus the region requires more attention.
2.2.1. Standardized drought indices (SDI)
The indices have been developing in various studies for determining the onset, end, and severity of drought occurrences (Keyantash and Dracup Citation2002; Waseem et al. Citation2015; Wens et al. Citation2019; Kwak et al. Citation2021; Danandeh Mehr et al. Citation2022; Limones et al. Citation2022; Shams Esfandabadi et al. Citation2022). The development of new indices helps investigators and organizations to classify drought incidences and their severity (Chen et al. Citation2013; Dabanlı et al. Citation2017; Danandeh Mehr et al. Citation2022; Katipoğlu et al. Citation2022; Sharma et al. Citation2022). Several researchers have used various indices in their publications for characterizing, assessing, and monitoring drought occurrences at the national and global levels (Bhalme and Mooley Citation1980; Gommes and Petrassi Citation1996; Weghorst, 1996; Heim, 2002; Mishra and Singh Citation2011; Niaz et al. Citation2023). McKee et al. (Citation1993) introduced SPI to characterize meteorological drought. The SPI only considers the precipitation as an input to characterize drought. However, to take into account the sound effects of temperature irregularity on drought appraisal the SPEI was first utilized by Vicente-Serrano et al. (Citation2010). Similarly, SPTI was developed that joins multi-scalar characteristics with the potential to combine the impacts of temperature compliance on drought evaluation (Ali et al. Citation2017). Until now, there has been no extensively approved drought index among investigators (Hobeichi et al. Citation2022; Noguera et al. Citation2022; Topçu et al. Citation2022). However, investigators are struggling for modifying and reconstructing easy, comprehensive, and effective drought indices for evaluating, classifying, and investigating drought occurrences. Thus, in the current analysis, the new framework is developed for formulating a drought index to enhance the potential to evaluate drought occurrences and to strengthen drought monitoring and early warning system to deal with drought at an early time and decrease the possibility of damage or loss.
2.2.2. Monthly-based Monte Carlo Feature Selection (MMCFS)
Niaz et al. (Citation2020a) employed Monte Carlo Feature Selection (MCFS) in their research to determine important meteorological stations. Recently, Niaz et al. (Citation2022d) have applied MCFS for choosing important stations in the northern region. The northern region has climatological importance (described in section 2.1) and therefore, the northern region is designated for evaluation. The selected stations of the northern region provide a homogeneous pattern of meteorological drought classes for specific stations and indices (Ali et al. Citation2020a; Citation2020b; Niaz et al. 2020c). Moreover, Ali et al. (Citation2020b), observed a significant correlation among three indices (SPTI, SPEI, and SPI) at selected stations. Ali et al. (Citation2019), suggested accumulating information in a single drought index rather than investigating various indices. In this regard, several investigators presented numerous methodologies in their publications (Niaz et al. Citation2020b; Citation2021a; Citation2022c, 2022f). Niaz et al. (Citation2020b) and Niaz et al. (Citation2021f) have developed new weighting schemes to accumulate information from various stations and indices. Although, those spatially weighted weighting schemes have characterized drought events more precisely, however, temporal characterization plays an important role in assessing and monitoring drought events. For this purpose, Niaz et al. (Citation2022c) and Niaz et al. (Citation2022e) formulated a new index to assess and monitor spatial and temporal (spatiotemporal) records of the homogeneous region. They performed a study in a homogeneous region, however, they have not given the importance to temporal (seasonal) characteristics of the selected stations (spatial). Hence, their study could be more efficient, precise, and accurate. This task underlines a new path for the development of efficient precise and accurate frameworks to collect information from several stations to give spatiotemporal information on the severity of meteorological drought. For this purpose, the current study employs MMCFS to select important stations among the various selected stations with respect to selected indices. For instance, Bunji is selected as an important station for SPI. The MMCFS provides a higher value of relative importance (RIs) for selecting an important station. Niaz et al. (Citation2020a) provide mathematical details about the computation of RI values. In the current research based on the SPI the Astore receives a higher value of the RI in the month of January and therefore it is selected for further analysis. Further, for SPEI, it is observed that the RI value for Gupis is higher and thus the MMCFS selects Gupis as an imperative station. Moreover, in January the MMCFS used the SPTI for choosing a crucial station and selects Astore as an informative station for the initial evaluation. Hence, the choice of the stations for other months (i.e. February- December) is determined on the same rationale (i.e. higher RI values). In this way, the values obtained in the varying indices and stations are considered for the formulation of the new index. The MMCFS contribution enables the current framework to compile information from different stations and indices more comprehensively and accurately.
2.2.3. The aggregation of regional spatiotemporal meteorological drought events (ARSTMDE)
The outcome of the proposed framework is the Aggregation of Regional Spatiotemporal Meteorological Drought Events (ARSTMDE). The ARSTMDE is a formulated index that is mainly developed to obtain comprehensive spatiotemporal information. Several studies have developed to find comprehensive spatiotemporal information (Niaz et al. Citation2022c, Citation2022e). Recently, Niaz et al. (Citation2022c, Citation2022e) formulated a new index to assess and monitor spatiotemporal records of the homogeneous region. Though the formulated indices have characterized spatiotemporal meteorological drought events more accurately, however, characterization and monitoring of spatiotemporal drought events could be evaluated more comprehensively and accurately. This task underlines a new path for the development of efficient frameworks to collect comprehensive information from some chosen locations. The current research has three major differences from that (Niaz et al. Citation2022d). The first one is that ARSTMDE uses MMCFS to select important stations for various months. For instance, the MCFS uses six designated stations to select the important station for each month (January-December). This phase of ARSTMDE is based on the spatial weights obtained from the designated stations. The flowchart of the suggested framework that is based on the ARSTMDE can be seen in . The selection of important stations for each month separately is a dynamic approach since the variation in a certain month say January is very similar to the January of other stations. Similarly, the selection is made for other months. This process is repeated for each selected index (SPI, SPEI, and SPTI). Thus, each index has a new MMCFS series of standardized values. The MMCFS series of standardized values are obtained by propagating the seasonal values (January to December) over the selected period and indices. Hence, the data is organized into three vectors. Secondly, in the ARSTMDE three obtained vectors of standardized values are utilized to evaluate SSP for different drought classes (Normal Dry, Extremely Wet, Median Wet, Extremely Dry, Median Dry, Severely Dry, and Severely Wet) (). These selected drought classes and their classification criterion have been discussed in a number of research (Niaz et al. Citation2020a; Citation2021b, Citation2021c). Further, based on the SSP the temporal weights of particular drought classes are obtained for each month separately over the selected period. Furthermore, the third difference in ARSTMDE is that it obtains monthly-based Joint Index Weights (MJIW) across selected indices. Mathematically, the can be presented as follows,
Figure 2. The flow chart of the proposed framework is given. Several steps can be seen to evaluate the ARSTMDE.
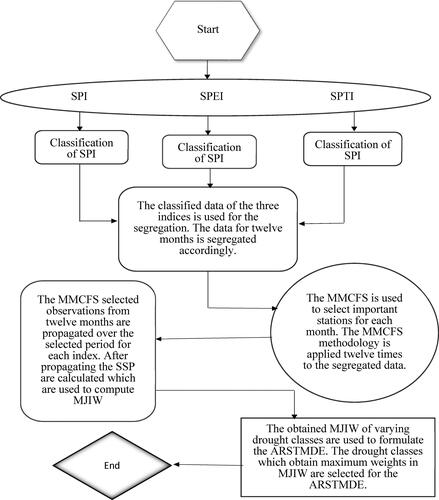
Table 1. The numerical quantification of the meteorological drought classes. The three meteorological drought index (MDI) (SPI, SPTI and SPEI) are used for the numerical quantification.
In Equation (1) shows monthly joint index weights of several drought classes (
obtained for several months
) of the selected years
in numerous indices
The denominator,
is total weights obtained from varying drought categories at several months of the selected time period in numerous indices (
Further, the weights of the nominator,
can be calculated from the Equation (2).
(2)
(2)
Where shows the weights for various classes (categories) (
of varying months
) of the selected years
in several stations
The denominator terms,
is total weights observed from a variety of drought categories at various months of the selected time periods and stations. The weights obtained by MJIW are propagated over the specified period to formulate ARSTMDE. The ARSTMDE is used to determine the appropriate vector of drought classes for each month in prolonged time series data. In ARSTMDE the classes which attain maximum weights among the MJIW are selected. The methods based on the maximum weighting scheme have been discussed in several publications (Niaz et al. Citation2021c; Citation2021f; Citation2022c, Citation2022e). The present research employes the similar concepet to select classes in the development of ARSTMDE. However, the MMCFS and MJIW contribution enable the ARSTMDE to accumulate more comprehensive and accurate spatiotemporal information for drought characterization in the selected region.
3. Results
The meteorological parameters including Precipitation (), and the Minimum Temperature (
) and Maximum Temperature (
) are included in the data set of six stations in the Northern Area of Pakistan (NAP). The observed precipitation for the specific time periods and months is given in . The
and
for the specific time period and a month is provided in . The stations of the NAP have sufficient information according to the requirements of the analysis and are therefore selected for the current research. The meteorological characteristics of certain stations are depicted in different figures. The figures of meteorological characteristics are created in R software, the package is available (Zambrano-Bigiarini, Citation2017). For instance, the observed
in numerous months in selected stations is given in . The
observed in numerous months and stations is shown in . The
observed in several stations and months is presented in . Further, the various features of the meteorological parameters at Chilas for varying months from January to December (1 to 12) in the certain time period (January 1971 to December 2017) are given in . To avoid the multiple tabulations in the manuscript the meteorological features for the one station (Chilas) are provided. However, the meteorological features for other stations are obtainable accordingly. Moreover, the observations of the various meteorological parameters are standardized by utilizing several probability distributions. In the current study at a one-month time scale, several distributions are chosen for the standardization (). The varying probability distributions are selected based on the Bayesian Information Criterion (BIC) values. Thus, those distributions that have minimum BIC values with respect to the meteorological underlines of the station at the selected time scale are chosen for the standardizations. For instance, the BIC (-1036.5) for 3p Weibull distribution is found in minimum among the BIC values of other distributions in Astore for SPI at scale-1. Therefore, for SPI at scale-1, the 3p Weibull distribution is chosen for the standardization in Astor station. Thus, the distribution with a minimum value of BIC is selected for the standardization in Astor. Likewise, for SPI-1, the 3p Weibull distribution performs appropriately for Bunji station with BIC (-1031.0), Gilgit, with BIC (-1097), and Skardu with BIC (-735.1). Similarly, based on the minimum values of the BIC, other distributions have a preference for standardization in numerous stations and indices.
Figure 3. The behavior of the is given for the numerous months and stations. It can be observed that the most rainfall occurs from January - June. The period of July - December has not sufficient rainfalls. The impact of the chosen locations is large for other parts of the country, therefore the current study has focused on studying these stations.
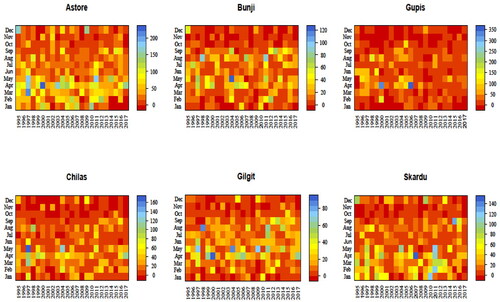
Figure 4. The can be observed in varying stations. The behavior of the minimum temperature is more and less similar in all selected stations. The temperature is used as a parameter in SPEI and SPTI for quantifying the severity of the drought. Therefore, information regarding the temperature characteristics is substantial. The observed and missing values of the temperature are handled by the meteorological department.
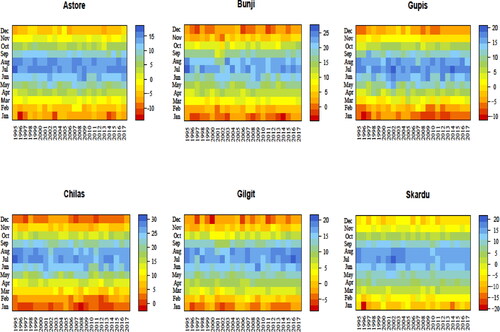
Figure 5. The in varying stations can be determined accordingly. The role of the maximum temperature has significance for the calculation of the SPTI. Therefore, the behavior of the in
selected stations has importance.
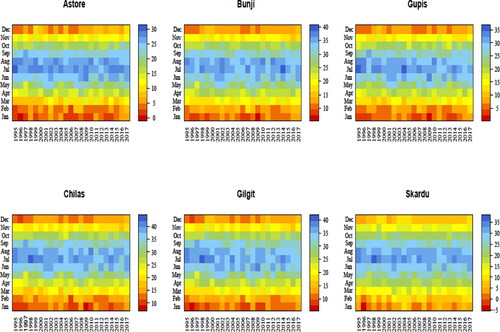
Table 2. One of the indicators (i.e. precipitation) of the meteorological drought on the selected station is given for several years. The data is provided only for the selected stations for the specific time period (1995–2017). However, data for other selected periods can be obtainable accordingly.
Table 3. The meteorological drought parameters for the selected stations is given for the specific years.
Table 4. The various features of the meteorological parameters (precipitation, Minimum Temperature (Min Temp) and Max Tem (Maximum Temperatre)) at Chilas for varying months January to December (1 to 12) in selected time period (January 1971 to December 2017) can be observed accordingly.
Table 5. The distributions which are used in the current analysis are given. The CDF of these varying distributions are used for the standardization. The transformation through CDF to standard distribution is derived according to the Farahmand and AghaKouchak (Citation2015). The distributions according to the varying indices and stations are selected. The minimum BIC of the distributions are provided accordingly.
Three drought indices (SPI, SPEI, and SPTI) at a one-month time scale are mainly computed for the current analysis for labeling drought severity in the region. The choice of a one-month time scale is based on several publications (Niaz et al. Citation2020b, 2020e). In the current analysis, the various levels of drought severity are defined according to Li et al. (Citation2015). Several thresholds for each drought severity are defined according to Li et al. (Citation2015). For instance, the value of meteorological drought index MDI (SPEI, SPI, and SPEI) greater than −1.5 and less than or equal to −1 denotes the MD category and SD is categorized by value (MDI > −2 & MDI < = −1.5). Further, the ND occurs when MDI is greater than −1 and less than or equal to 1 and so forth (see Niaz et al. Citation2020a). The temporal behavior of the SPI over the selected period and stations can be examined in . The temporal behavior of the other two indices can be presented accordingly. However, to avoid the redundancy in figures the temporal behavior of the SPI is shown only. Based on the severity level the counts of drought classes for SPI can be examined in . shows the counts for SPEI for varying drought classes over various months. The counts of varying classes over several months for SPTI can be observed in . Moreover, the counts obtained based on SPI are given in . The counts are provided for the specific months and an index. However, the counts obtained for other selected indices over the selected months are calculated accordingly. The quantified values of these indices are used in MMCFS to select important meteorological stations. The MMCFS used monthly observations to select important stations for specific months and indices. For example, using SPI for January, MMCFS selects the important meteorological stations among selected meteorological stations. Similarly, for other months and indices, the MCFS is applied to decide on crucial meteorological stations. The choice of the crucial station is based on the RI values. The varying RI values can be seen in . For example, for SPI, and SPTI the Astore station is selected for January. The RI values for SPI, and SPTI in the Astore station are 0.1595, and 0.1899 respectively. Further, for SPEI the RI value for the Gupis station is high in January which shows that the choice of the Gupis station is ubiquitous for the analysis. In February, the Astore station with RI values (0.1090) is observed as an important station for SPI. The RI value (0.0782) based on SPEI shows that the Gilgit station is an important station for February. Further, the RI value (0.33) for Astore shows that the station is important for the analysis. Similarly, for other months the compilation of the important station is based on the same rationale.
Figure 6. The temporal presentation of the SPI-1 can be analyzed in numerous stations. In the current analysis, the one-month time scale (scale-1) of the indices is used for classifying drought classes. However, the methodology can be extended to the other time scales (i.e. if there is homogeneous pattern of drought classes). Moreover, we presented the temporal plots for only SPI, however, the the temporal plots for other two indices can be plotted accordingly.
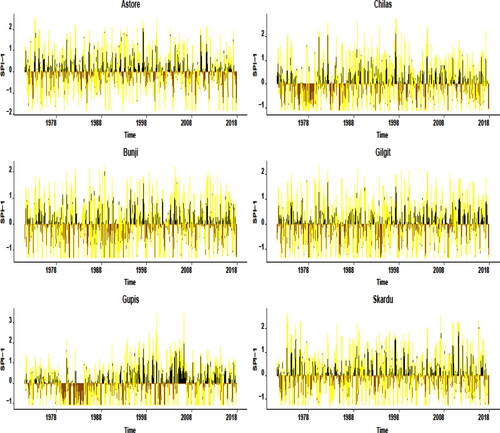
Figure 7. SPI at scale-1 is used to classify the drought occurrences in varying stations. The count plots for various months are presented. It can be observed that ND appears in most of the stations. In Astore ND is prevalent in the month of August (Aug). Similarly, the behavior of ND in all stations and months is greater than in other drought categories. Further ED category has very fewer chances of occurrence in the selected stations.
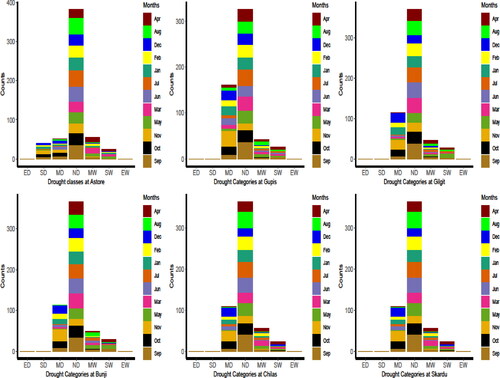
Figure 8. The meteorological drought counts using SPEI at scale-1 are presented for varying stations. The monthly counts are presented for numerous drought classes. It can be noted that ND obtained from SPEI is prevalent in various months in selected stations. For instance, in Astore ND counts are larger than other drought categories. Similarly, the number of counts for ND and other drought categories, months and stations can be assessed accordingly.
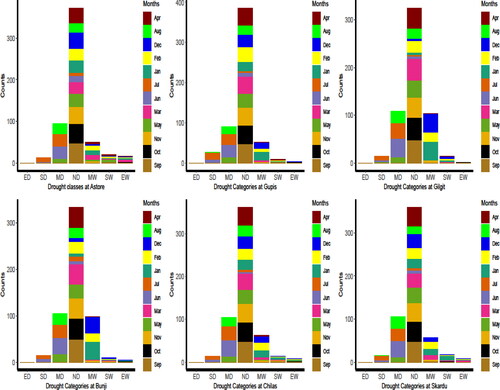
Figure 9. Monthly count obtained from SPTI at scale-1 are presented. The varying plots show that the counts of ND are larger than other drought categories. Secondly, MD counts are very high in selected stations. Moreover, the presence of other drought classes in varying stations and months can be examined accordingly.
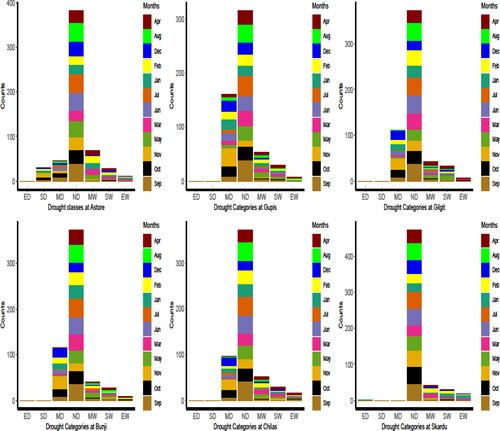
Table 6. The counts for numerous drought classes in a number of months can be noted in numerous stations. The counts are presented for SPI for specific months over the selected time period. For example, there are 47 months of data are selected for the analysis. Therefore, each month is available at 47 times. So, the results for each month can be observed. Further, the counts for other selected drought indices can be presented accordingly.
Table 7. The monthly RI values obtained from MMCFS are provided for varying months January to December (1 to 12). In January for SPI it can be observed that Astore station is more important than other stations. In January, for SPEI and SPTI the Gupis and Gilgit are found important respectively. The RIs values for other stations, months and indices can be identified accordingly.
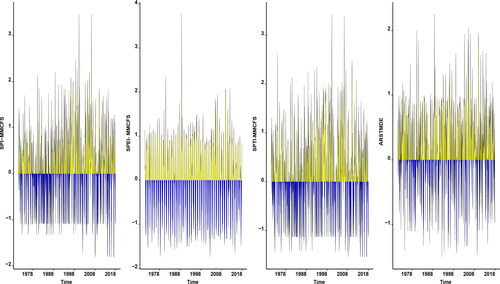
Moreover, based on MMCFS the obtained values from varying stations and months are propagated over the selected years. Three vectors of indices are obtained from MMCFS. From the obtained vectors of three MCFS-based indices, the SSP is computed for the selected drought classes. Then the SSP is used to compute temporal weights for the drought severity. The temporal weights are further used to obtain MJIW. The obtained MJIW of varying drought classes are used to formulate the ARSTMDE. The temporal behavior of SPI based on MMCFS, SPEI-MMCFS, SPTI-MMCFS, and ARSTMDE can be seen in . The ARSTMDE provides a more precise and comprehensive characterization of meteorological drought. Therefore, the current study suggests ARSTMDE for selecting comprehensive information over the selected stations in a homogeneous region at a one-month time scale. It is further recommended that the drought mitigation plans ought to be executed according to the ARSTMDE in the selected region. Moreover, the proposed ARSTMDE is applicable for modeling spatiotemporal drought occurrences in a homogeneous environment. However, when the pattern of the drought occurrences is non-homogeneous the current methodology will lead to insensitive inferences, and therefore, not applicable. The findings obtained from the ARSTMDE can only be extrapolated for the current meteorological conditions, the variation in meteorological conditions will shift the outcomes and their extrapolations. Furthermore, additions of the other meteorological parameters into the current framework will enhance the validity of the ARSTMDE.
Figure 10. The Temporal plots of SPI-MMCFS, SPEI-MMCFS, and SPTI-MMCFS, and ARSTMDE at scale-1 are given. The ARSTMDE enables investigators to make more precise and accurate drought assessment and monitoring.
4. Discussion
Characterization and representation of observed spatiotemporal drought events using SDI are vital components for improving operational drought monitoring capabilities and mitigation measures. Several researchers have given new methods and frameworks for characterizing and representing the observed spatiotemporal drought events (Afshar et al. Citation2022; Ghaleni et al. Citation2022; Sharma et al. Citation2022; Yildirim and Rahman Citation2022). Recently, Niaz et al. (Citation2022c, Citation2022e) framed a new meteorological drought (MD) index to assess and monitor spatiotemporal records. However, the inclusion of seasonal characteristics of the selected stations can make their study more efficient, precise, and accurate. Hence, in the current analysis, we employed monthly-based seasonal information to the proposed framework for providing more efficient, precise, and accurate spatiotemporal information for the severity of meteorological drought. For this purpose, the data of the NAP is processed for the current analysis. The data set is taken from PMD the Karachi Data Processing Center (KDPC). The selected data ranged from January 1971 to December 2017. The meteorological parameters of the selected dataset include
and
These meteorological parameters are used to calculate three drought indices (SPI, SPEI and SPTI) for the current assessment. The SPI uses
data only, however, the calculation of SPEI and SPTI is based on the
and
For instance, the data of
is standardized for the computation of SPI; and the data of both
and
are standardized for the SPEI and SPTI accordingly. Various probability distributions are selected for the standardization of the data. The best-fitted distributions are selected based on the BIC values. The distributions that have minimum BIC values are selected for standardization. Several researchers have used these indices in their study for drought appraisal, monitoring, and prediction (Niaz et al. Citation2020b; Citation2021c; Citation2021e). The selected three indices are used to quantify the drought severity. The current research use criterion for drought classification which is used by (Li et al. Citation2015). The numerical evaluations of certain indices are used in MMCFS to pick and choose the most informative stations. For instance, among the selected stations the MMCFS selects one station for SPI, one station for SPEI, and one for SPTI separately. Thus, the classes obtained from MMCFS are weighted by SSP. These obtained SSPs are used to calculate temporal weights for each month separately. The temporal weights are further used to calculate MJIW for each MMCFS-based index. The monthly-based MMCFS and MJIW contribution allows the current framework to collect more comprehensive and accurate information from different stations and certain indices. Therefore, the use of the ARSTMDE may help for better drought assessment and monitoring.
5. Conclusion
Drought is one of the complicated natural climate events that have undesirable inducements on the environmental sectors, water resources, agricultural sectors, and other social activities unanimously. However, the spatiotemporal information on drought incidence is important in operational monitoring for policy decisions specifically, at the regional level to strengthen water resource planning and management. Therefore, the current study aims to develop a new framework that provides spatiotemporal knowledge of drought incidences. In this regard, the ARSTMDE is developed that employs MMCFS, SSP, and MJIW to comprehensively collect information from numerous meteorological stations and drought indices. In addition, three frequently used SDI are mutually analyzed for the computation of ARSTMDE. The ARSTMDE is validated to the six specified stations of the NAP. The results obtained from the ARSTMDE provide regional spatiotemporal information. The obtained information is more comprehensive and representative. Further, the findings related to the ARSTMDE enable researchers to make an inclusive evaluation of regional MD and transmit a new path to bring more contemplation into drought appraisal and monitoring.
Consent to participate
All authors are voluntarily agreed to participate in this research study
Availability of data and codes
The data and codes used for the preparation of the manuscript are available with the corresponding author and can be provided upon request.
Ethical statement
All procedures followed were in accordance with the ethical standards with the Helsinki Declaration of 1975, as revised in 2000.
Consent to publish
All authors are agreed to for publication, there is no legal constraint in publishing the data used in the manuscript.
Authors contribution
All authors contributed equally.
Disclosure statement
No potential conflict of interest was reported by the authors.
Additional information
Funding
References
- Afshar MH, Bulut B, Duzenli E, Amjad M, Yilmaz MT. 2022. Global spatiotemporal consistency between meteorological and soil moisture drought indices. Agric for Meteorol. 316:108848.
- Alahacoon N, Edirisinghe M, Ranagalage M. 2021. Satellite-based meteorological and agricultural drought monitoring for agricultural sustainability in Sri Lanka. Sustainability. 13(6):3427.
- Ali Z, Almanjahie IM, Hussain I, Ismail M, Faisal M. 2020a. A novel generalized combinative procedure for Multi-Scalar standardized drought Indices-The long average weighted joint aggregative criterion. Tellus A: Dynamic Meteorol Oceanography. 72(1):1736248.
- Ali Z, Hussain I, Faisal M, Khan DM, Niaz R, Elashkar EE, Shoukry AM. 2020b. Propagation of the multi-scalar aggregative standardized precipitation temperature index and its application. Water Resour Manage. 34(2):699–714.
- Ali Z, Hussain I, Faisal M, Nazir HM, Moemen MAE, Hussain T, Shamsuddin S. 2017. A novel multi-scalar drought index for monitoring drought: the standardized precipitation temperature index. Water Resour Manage. 31(15):4957–4969.
- Ali Z, Hussain I, Faisal M, Shoukry AM, Gani S, Ahmad I. 2019. A framework to identify homogeneous drought characterization regions. Theor Appl Climatol. 137(3–4):3161–3172.
- Bhalme HN, Mooley DA. 1980. Large-scale droughts/floods and monsoon circulation. Mon Weather Rev. 108:1197–1211.
- Carrão H, Naumann G, Barbosa P. 2016. Mapping global patterns of drought risk: an empirical framework based on sub-national estimates of hazard, exposure and vulnerability. Global Environ Change. 39:108–124.
- Carrão H, Russo S, Sepulcre-Canto G, Barbosa P. 2016. An empirical standardized soil moisture index for agricultural drought assessment from remotely sensed data. Int J Appl Earth Obs Geoinf. 48:74–84.
- Ceglar A, Zalika C, Lucka KB. 2008. Analysis of meteorological drought in Slovenia with two drought indices. Proceedings of the BALWOIS 2008, p. 27–31.
- Chandrasekara SS, Kwon HH, Vithanage M, Obeysekera J, Kim TW. 2021. Drought in South Asia: a review of drought assessment and prediction in South Asian countries. Atmosphere. 12(3):369.
- Chen L, Singh VP, Guo S, Mishra AK, Guo J. 2013. Drought analysis using copulas. J Hydrol Eng. 18(7):797–808.
- Crawford AB. 2019. State and federal responses to the 1977 drought. In North American droughts . Routledge; p. 143–161.
- Dabanlı İ, Mishra AK, Şen Z. 2017. Long-term spatio-temporal drought variability in Turkey. J Hydrol. 552:779–792.
- Danandeh Mehr A, Rikhtehgar Ghiasi A, Yaseen ZM, Sorman AU, Abualigah L. 2022. A novel intelligent deep learning predictive model for meteorological drought forecasting. J Ambient Intell Human Comput. 24:1–5.
- Farahmand A, AghaKouchak A. 2015. A generalized framework for deriving nonparametric standardized drought indicators. Adv Water Resour. 76:140–145.
- Ganguli P, Ganguly AR. 2016. Space-time trends in US meteorological droughts. J Hydrol: Reg Stud. 8:235–259.
- Gebrehiwot M, Meaza H, Ghebreyohannes Asfaha T, Tesfamariam Z, Demissie B. 2022. Spatiotemporal drought occurrences in the semi‐closed Raya graben along the northern Ethiopian Rift Valley. Singap J Trop Geogr. 43(1):85–107.
- Ghaleni MM, Sharafi S, Hosseini-Moghari SM, Helali J, Oskouei EA. 2022. Spatiotemporal characteristics of meteorological drought during the past half century in different climates over Iran. Res. Sq.
- Gommes R, Petrassi F. 1996. Rainfall variability and drought in sub-Saharan Africa. SD dimensions, FAO.
- Hernandez EA, Uddameri V. 2014. Standardized precipitation evaporation index (SPEI)-based drought assessment in semi-arid south Texas. Environ Earth Sci. 71(6):2491–2501.
- Hobeichi S, Abramowitz G, Evans JP, Ukkola A. 2022. Toward a robust, impact‐based, predictive drought metric. Water Resour Res. 58(2):e2021WR031829.
- Huizhi T, Xiaoning L, Shiqi Y, Yongqian W, Feng L, Jinbao L, Jun C, Yue H. 2022. Drought risk assessment in the coupled spatial–temporal dimension of the Sichuan Basin, China. Nat Hazards. 114(3):3205–3233.
- Kao SC, Govindaraju RS. 2010. A copula-based joint deficit index for droughts. J Hydrol. 380(1–2):121–134.
- Katipoğlu OM, Acar R, Şenocak S, Şengül S. 2022. Assessment of meteorological drought trends in the Euphrates Basin, Turkey. Arab J Geosci. 15(6):1–14.
- Keyantash J, Dracup JA. 2002. The quantification of drought: an evaluation of drought indices. Bull Amer Meteor Soc. 83(8):1167–1180.
- Keyantash JA, Dracup JA. 2004. An aggregate drought index: assessing drought severity based on fluctuations in the hydrologic cycle and surface water storage. Water Resour Res. 40:14.
- Khan DG, Latif M, Hassan S. 2003. The role of controlled drainage under drought conditions in an irrigated area in NWFP, Pakistan. Irrig and Drain. 52(2):147–162.
- Kwak J, Joo H, Jung J, Lee J, Kim S, Kim HS. 2021. A case study: bivariate drought identification on the Andong dam, South Korea. Stoch Environ Res Risk Assess. 35(3):549–560.
- Leng G, Tang Q, Rayburg S. 2015. Climate change impacts on meteorological, agricultural and hydrological droughts in China. Global Planet Change. 126:23–34.
- Li X, He B, Quan X, Liao Z, Bai X. 2015. Use of the standardized precipitation evapotranspiration index (SPEI) to characterize the drying trend in southwest China from 1982–2012. Remote Sens. 7(8):10917–10937.
- Limones N, Pita-López MF, Camarillo JM. 2022. A new index to assess meteorological drought: the Drought Exceedance Probability Index (DEPI). Atm. 35(1):67–88.
- Lotfirad M, Esmaeili-Gisavandani H, Adib A. 2022. Drought monitoring and prediction using SPI, SPEI, and random forest model in various climates of Iran. J Water and Climate Change. 13(2):383–406.
- Lottering S, Mafongoya P, Lottering R. 2021. Drought and its impacts on small-scale farmers in sub-Saharan Africa: a review. South Afr Geograph J. 103(3):319–341.
- McKee TB, Doesken NJ, Kleist J. 1993. The relationship of drought frequency and duration to time scales. In: Proceedings of the 8th Conference on applied climatology. Vol. 17, pp. 179–183. Boston, MA: American Meteorological Society.
- Mishra AK, Singh VP. 2010. A review of drought concepts. J Hydrol. 391(1–2):202–216.
- Mishra AK, Singh VP. 2011. Drought modeling–A review. J Hydrol. 403(1–2):157–175.
- Mohammed S, Elbeltagi A, Bashir B, Alsafadi K, Alsilibe F, Alsalman A, Zeraatpisheh M, Széles A, Harsányi E. 2022. A comparative analysis of data mining techniques for agricultural and hydrological drought prediction in the eastern Mediterranean. Comput Electron Agric. 197:106925.
- Moisa MB, Merga BB, Gemeda DO. 2022. Multiple indices-based assessment of agricultural drought: a case study in Gilgel Gibe Sub-basin, Southern Ethiopia. Theor Appl Climatol. 148(1–2):455–464.
- Niaz R, Almanjahie IM, Ali Z, Faisal M, Hussain I. 2020a. A novel framework for selecting informative meteorological stations using Monte Carlo Feature Selection (MCFS) Algorithm. Adv Meteorol. 2020:1–13.
- Niaz R, Almazah MM, Al-Duais FS, Iqbal N, Khan DM, Hussain I. 2022c. Spatiotemporal analysis of meteorological drought variability in a homogeneous region using standardized drought indices. Geomatics Nat Hazards Risk. 13(1):1457–1481.
- Niaz R, Almazah MM, Hussain I, Faisal M, Al-Rezami AY, Naser MA. 2022b. A new comprehensive approach for regional drought monitoring. PeerJ. 10:e13377.
- Niaz R, Almazah MMA, Hussain I, Filho JDP. 2021a. A new framework to substantiate the prevalence of drought intensities. Theor Appl Climatol. 147(3–4):1079–1090.
- Niaz R, Almazah MMA, Hussain I, Filho JDP, Al-Ansari N, Sh Sammen S. 2022a. Assessing the probability of drought severity in a homogenous region. Complexity. 2022:1–8.
- Niaz R, Almazah M, Zhang X, Hussain I, Faisal M. 2021b. Prediction for various drought classes using spatiotemporal categorical sequences. Complexity. 2021:1–11.
- Niaz R, Hussain I, Ali Z, Faisal M. 2021d. A novel framework for regional pattern recognition of drought intensities. Arab J Geosci. 14(16):1–16.
- Niaz R, Hussain I, Ali Z, Faisal M, Elashkar EE, Shoukry AM, … Al-Deek FF. 2020b. A novel spatially weighted accumulative procedure for regional drought monitoring. Tellus A: Dynamic Meteorol Oceanograph. 72(1):1–13.
- Niaz R, Hussain A, Almazah MM, Hussain I, Ali Z, Al-Rezami AY. 2023. Identifying inter-seasonal drought characteristics using binary outcome panel data models. Geocarto Int. 38(1): 2178527.
- Niaz R, Hussain I, Zhang X, Ali Z, Elashkar EE, Khader JA, Soudagar SS, Shoukry AM. 2021e. Prediction of drought severity using model-based clustering. Math Prob Eng. 2021:1–10.
- Niaz R, Iqbal N, Al-Ansari N, Hussain I, Elsherbini Elashkar E, Shamshoddin Soudagar S, Gani SH, Mohamd Shoukry A, Sh Sammen S. 2022e. A new spatiotemporal two-stage standardized weighted procedure for regional drought analysis. PeerJ. 10:e13249.
- Niaz R, Tanveer F, Almazah M, Hussain I, Alkhatib S, Al-Razami AY. 2022d. Characterization of meteorological drought using Monte Carlo Feature Selection and steady-state probabilities. Complexity. 2022:1–19.
- Niaz R, Zhang X, Ali Z, Hussain I, Faisal M, Elashkar EE, Khader JA, Soudagar SS, Shoukry AM, Al-Deek FF. 2021f. A new propagation-based framework to enhance competency in regional drought monitoring. Tellus A: Dynamic Meteorol Oceanograph. 73(1):1975404.
- Niaz R, Zhang X, Iqbal N, Almazah M, Hussain T, Hussain I. 2021c. Logistic regression analysis for spatial patterns of drought persistence. Complexity. 2021:1–13.
- Noguera I, Vicente‐Serrano SM, Domínguez‐Castro F, Reig F. 2022. Assessment of parametric approaches to calculate the Evaporative Demand Drought Index. Int J Climatol. 42(2):834–849.
- Orimoloye IR, Olusola AO, Belle JA, Pande CB, Ololade OO. 2022. Drought disaster monitoring and land use dynamics: identification of drought drivers using regression-based algorithms. Nat Hazards. 112(2):1085–1106.
- Pachore AB, Regulwar DG. 2021. Meteorological drought analysis using SPI-6 for Marathwada Region, Maharashtra State, India. In: Advanced modelling and innovations in water resources engineering: select Proceedings of AMIWRE 2021. Singapore: Springer Singapore; p. 71–82.
- Pandey V, Srivastava PK, Mall RK, Munoz-Arriola F, Han D. 2022. Multi-satellite precipitation products for meteorological drought assessment and forecasting in Central India. Geocarto Int. 37(7):1899–1918.
- SafarianZengir V, Sobhani B, Asghari S. 2020. Modeling and monitoring of drought for forecasting it, to reduce natural hazards atmosphere in western and north western part of Iran, Iran. Air Qual Atmos Health. 13(1):119–130.
- Savari M, Damaneh HE, Damaneh HE. 2022. Drought vulnerability assessment: solution for risk alleviation and drought management among Iranian farmers. Int J Disaster Risk Reduct. 67:102654.
- Shahpari G, Sadeghi H, Ashena M, García-León D. 2022. Drought effects on the Iranian economy: a computable general equilibrium approach. Environ Dev Sustain. 24(3):4110–4127.
- Shams Esfandabadi H, Ghamary Asl M, Shams Esfandabadi Z, Gautam S, Ranjbari M. 2022. Drought assessment in paddy rice fields using remote sensing technology towards achieving food security and SDG2. BFJ. 124(12):4219–4233.
- Sharma A, Sharma D, Panda SK. 2022. Assessment of spatiotemporal trend of precipitation indices and meteorological drought characteristics in the Mahi River basin, India. J Hydrol. 605:127314.
- Shukla S, Wood AW. 2008. Use of a standardized runoff index for characterizing hydrologic drought. Geophys Res Lett. 35: L02405.
- Tabari H, Nikbakht J, Hosseinzadeh Talaee P. 2013. Hydrological drought assessment in Northwestern Iran based on streamflow drought index (SDI). Water Resour Manage. 27(1):137–151.
- Tesfamariam BG, Gessesse B, Melgani F. 2019. Characterizing the spatiotemporal distribution of meteorological drought as a response to climate variability: the case of rift valley lakes basin of Ethiopia. Weather Clim Extremes. 26:100237.
- Topçu E, Seçkin N, Haktanır NA. 2022. Drought analyses of Eastern Mediterranean, Seyhan, Ceyhan, and ASI Basins by using aggregate drought index (ADI). Theor Appl Climatol. 147(3–4):909–924.
- Tramblay Y, Koutroulis A, Samaniego L, Vicente-Serrano SM, Volaire F, Boone A, Le Page M, Llasat MC, Albergel C, Burak S, et al. 2020. Challenges for drought assessment in the Mediterranean region under future climate scenarios. Earth Sci Rev. 210:103348.
- Van Loon AF. 2015. Hydrological drought explained. Wiley Interdiscip Rev: Water. 2(4):359–392.
- Vicente-Serrano SM, Beguería S, López-Moreno JI. 2010. A multiscalar drought index sensitive to global warming: the standardized precipitation evapotranspiration index. J Climate. 23(7):1696–1718.
- Vicente-Serrano SM, Beguería S, Lorenzo-Lacruz J, Camarero JJ, López-Moreno JI, Azorin-Molina C, Revuelto J, Morán-Tejeda E, Sanchez-Lorenzo A. 2012. Performance of drought indices for ecological, agricultural, and hydrological applications. Earth Interactions. 16(10):1–27.
- Warrick RA, Bowden MJ. 1981. The changing impacts of droughts in the Great Plains. Center for Technology, Environment, and Development, Clark University.
- Waseem M, Ajmal M, Kim TW. 2015. Development of a new composite drought index for multivariate drought assessment. J Hydrol. 527:30–37.
- Wens M, Johnson JM, Zagaria C, Veldkamp TI. 2019. Integrating human behavior dynamics into drought risk assessment—A sociohydrologic, agent‐based approach. Wiley Interdiscip Rev: Water. 6(4):e1345.
- Wilhite D, Pulwarty RS. (Eds.) 2017. Drought and water crises: integrating science, management, and policy. CRC Press.
- Yildirim G, Rahman A. 2022. Spatiotemporal meteorological drought assessment: a case study in south-east Australia. Nat Hazards. 111(1):305–332.
- Yue S, Yang F, Sheng X. 2022. Spatiotemporal evolution and the driving factors of meteorological drought in the Hun-Taizi River basin, NE China. J Water and Climate Change. 13(3):1326–1339.
- Zambrano-Bigiarini, M. 2017. HydroT SM: Time series management, analysis and interpolation for hydrological modelling. R Package version 0.5-1.
- Zerouali B, Chettih M, Abda Z, Mesbah M, Santos CAG, Brasil Neto RM, da Silva RM. 2021. Spatiotemporal meteorological drought assessment in a humid Mediterranean region: case study of the Oued Sebaou basin (northern central Algeria). Nat Hazards. 108(1):689–709.
- Zseleczky L, Yosef S. 2014. Are shocks really increasing?: a selective review of the global frequency, severity, scope, and impact of five types of shocks.