
 ?Mathematical formulae have been encoded as MathML and are displayed in this HTML version using MathJax in order to improve their display. Uncheck the box to turn MathJax off. This feature requires Javascript. Click on a formula to zoom.
Abstract
We aim to explore the seasonal influences of meteorological factors on COVID-19 era over two distinct locations in Bangladesh using a generalized linear model (GLM) and wavelet analysis. GLM model findings show that summer humidity drives COVID-19 transmission to coastal and inland locations. During the summer in the coastal area, a 1 °C earth’s skin temperature increase causes a 41.9% increase in COVID (95% CL 86.32%-2.54%) transmission compared to inland. Relative humidity was recorded as the highest at 73.97% (95% CL, 99.3%, and 48.63%) for the coastal region, while wind speed and precipitation reduced confirmed cases by −38.62% and −22.15%, respectively. Wavelet analysis showed that coastal meteorological parameters were more coherent with COVID-19 than inland ones. The outcomes of this study are consistent with subtropical climate regions. Seasonality and climatic similarity should address to estimate COVID-19 trends. High societal concern and strong public health measures may decrease meteorological effect on COVID-19.
1. Introduction
Coronavirus disease-2019 (COVID-19), previously known as SARS-CoV-2, is an enveloped positive-strand RNA coronavirus (Pal et al. Citation2020). A cluster of atypical pneumonia patients in Hubei, China, tested positive for SARS-CoV-2. After China, it went worldwide (Li et al. Citation2020; Hridoy et al. Citation2021; Islam, Hasanuzzaman, Azad, et al. Citation2021). This condition causes mild to severe lung infections, liver issues, neurological diseases, and gastrointestinal issues in humans and animals (Guan et al. Citation2003). On January 30, 2020, the WHO designated COVID-19 a worldwide public health emergency and a pandemic on March 11, 2020 (Bodrud-Doza et al. Citation2020). It has had a huge effect on individuals and the economy since it has never been found in humans (Islam, Hasanuzzaman, Shammi, et al. Citation2021). The COVID-19 pandemic threatens strategic planning, policymaking, and time-sensitive decisions in public health sectors worldwide. Most countries combated COVID-19 with broad screening, coordinated vaccination, and social programs to reduce social distance (Zambrano-Monserrate et al. Citation2020). The extremely contagious virus caused 448 million COVID-19 infections worldwide in two years. Without remedial or management actions, this percentage will be surpassed (WHO Citation2020).
In a subtropical country, the climate and weather patterns can create a unique set of conditions that can either amplify or dampen the spread of the virus (Ma et al. Citation2020). The seasonality of meteorological factors can have a significant impact on the transmission of respiratory diseases such as COVID-19, and this impact can vary depending on the geographic location. Meanwhile, Bangladesh has been similarly affected by its subtropical monsoon climate, characterized by wide seasonal variations in rainfall, high temperatures, and humidity. In this region, 29,105 affected people have died out of over 1.94 million confirmed cases until March 2022 (WHO Citation2020; IEDCR (Institute of Epidemiology and Disease Control and Research) Citation2021). It was unclear when COVID-19 made its way to Bangladesh. The first three incidents were recorded on March 8, 2020, in the country. Eventually, except for the massive vaccination program, there will be no existing integrated plan available across the country, which could increase the possibility of further outbreaks of other mutated SARS-CoV-2 variants in the upcoming monsoon of 2023. However, meteorological and climatic factors seem to be critical factors that may have impacted the frequency of epidemics of such respiratory infectious disorders (Wu et al. Citation2020; Rahimi et al. Citation2021; Li et al. Citation2022; Song et al. Citation2022). Evaluation of the changing nature of COVID-19 in the context of weather conditions would be a crucial part of managing this dangerous outbreak, as it would help stop any more waves of this virus from spreading.
Many studies have examined COVID-19 daily cases and climatic conditions (Cucinotta and Vanelli Citation2020; Rosario et al. Citation2020; Rahimi et al. Citation2021; Li et al. Citation2022). Previous studies examined many climatic variables and COVID-19 incidence (). According to experts, climate change may spread infectious illnesses like influenza (Dai et al. Citation2018). Several studies found that climatic conditions may affect coronavirus transmission (Cai et al. Citation2007; Casanova et al. Citation2010; Shi et al. Citation2020; Lin et al. Citation2022). The environment may also alter the COVID-19 pandemic (Brassey et al. Citation2020). Hence, meteorological and environmental factors, including humidity, solar radiation, temperature, and wind speed, may impact COVID-19 transmission strength (Chen et al. Citation2020).
Table 1. The impact of different meteorological factors on total number of COVID-19 cases in different climatic conditions.
Understanding the infectious component and its relationship with the environment was one of the biggest hurdles in managing COVID-19 (Islam, Islam, et al. Citation2021). Nevertheless, Davis et al. (2016), Rendana (Citation2020), and Wang et al. (Citation2020) reported that respiratory infections are more likely in cold, dry conditions. Low temperatures and humidity may help the coronavirus spread and survive. Liu et al. (Citation2020) state that climatic, geographical, population density, and social variables may affect SARS-CoV-2 spread. Asyary and Veruswati (Citation2020) found that sunlight speeds coronavirus recovery. Several studies suggested that temperature and humidity affected the SARS pandemic, which ended with warmer weather (Tan et al. Citation2005; Cao et al. Citation2016; Liu et al. Citation2020). Environmental factors may affect coronavirus transmission (Cai et al. Citation2007; Casanova et al. Citation2010; Shi et al. Citation2020). New studies show that ambient temperature affects the transmission and survival of coronaviruses like MERS-CoV and SARS-CoV-1 (Casanova et al. Citation2010; Chan et al. Citation2011). Several studies have connected COVID-19 transmission to temperature, humidity, rainfall, and wind speed (Ficetola and Rubolini Citation2021; Pramanik et al. Citation2020; Shi et al. Citation2020). Few studies have studied macroclimate seasonality and geography (Zoran et al. Citation2021; Yin et al. Citation2022). Early outbreak time series analyses dominated (Rahman et al. Citation2021). Short-term studies cannot reveal COVID-19's weather seasonality. COVID-19's weather-responsiveness demands an extensive temporal investigation (Liu et al. Citation2020; Rendana Citation2020; Wang et al. Citation2020). Several studies mapped the COVID-19 distribution (Weiss et al. Citation2020). Analyzing COVID-19 dispersion requires linking climatic parameters to different geographic areas (Mendez-Arriaga Citation2020).
Based on the literature review, it is found that only a few studies explained how seasonal meteorological circumstances increase COVID-19 cases. However, no prior studies have examined how seasonal meteorological conditions affect the COVID-19 transmission by geographical differences. Therefore, seasonal contagion in subtropical monsoon climates must be identified. The earlier literature overlooked this issue. This research hypothesizes that seasonal meteorological factors adversely affect the COVID-19 confirmed case rates in subtropical areas like Bangladesh. The genetic drift of the COVID-19 oscillation is unclear, but based on previous viral infection outbreaks like SARS and MERS-CoV, future waves of infections are anticipated to occur with unpredictable height and breadth (Zoran et al. Citation2021; Citation2022a). Evaluating the influence of two dissimilar locations’ environmental and climatic parameters on viral infectious disease exposure is critical for avoiding and making future health policy decisions about new COVID-19 outbreaks and other viral agents (Bashir et al. Citation2020; Rahman et al. Citation2021). Coccia (Citation2021) investigated the relationships between the spread of COVID-19 and environmental and atmospheric factors. Sarkodie and Owusu (Citation2020) analyzed the relationship between COVID-19 outcomes and eight meteorological factors in the top 20 affected countries. Though there are a few studies on the impact of all relevant meteorological factors on COVID-19 in Bangladesh (Islam et al. 2020; Islam, Hasanuzzaman, Azad, et al. Citation2021; Islam, Hasanuzzaman, Shammi, et al. Citation2021; Islam, Islam, et al. Citation2021; Islam, Bukhari, et al. 2021), Haque and Rahman (Citation2020) studied the association between average temperature and humidity with COVID-19 in Bangladesh. Based on the past literature, it is observed that there is a limited observation period and a lack of consideration for other meteorological factors with the COVID-19 pandemic which warrant the necessity of further studies in Bangladesh. However, research into the relationship between all meteorological factors and daily COVID-19 confirmed cases over a long period of time in a diverse geographical setting is still lacking. This creates a research gap in the past literature. To bridge the gap in earlier literature, this research aims to (i) explore the seasonal influences of meteorological factors on COVID-19 transmission over two distinct geographical settings in Bangladesh and (ii) identify the most significant meteorological factors that influence COVID-19 cases considering two different geographic conditions, such as inland and coastal regions, during the six seasons and the nearly two-year pandemic period from March 8, 2020, to August 31, 2021. This study investigates the differences in weather patterns between coastal and inland areas to gain a better understanding. With the ongoing COVID-19 pandemic affecting the world for multiple seasons, it is crucial to understand the impact of weather and environmental factors on the spread of the virus and its variants. Our research is unique in the sense that it is the first to examine the nexus between coastal and inland weather patterns and COVID-19. By examining the regional differences in seasonal weather and its effect on the pandemic, we hope to provide valuable information on how future pandemics may be impacted by weather patterns.
2. Data and methods
2.1. Study area description
Bangladesh’s middle and western regions are deltaic plains, with sandy beaches, mountainous terrain in the southeast, and a vast mangrove forest in the southwest (Das and Islam 2022). It’s between 20° 34′ and 26° 38′ N and 88° 01′ and 92° 41′ E, with 143,998 km2 of area (Das and Islam Citation2021). The government restricts Bangladesh’s coastal zone based on natural activities and events that regulate its potential and weaknesses. These activities include tidal variations, soil, surface, or groundwater salinity, and storm surge danger (Islam and Nabila Citation2022). Based on these activities, the southern coastal zone comprises 16 districts (out of 64). The western coastal portions have the world’s most extensive mangrove forest and an estuarine ecology (Rahman and Islam Citation2019). It is the most climatically sensitive location in the nation, impacted by tropical storms, tidal surges, saline water intrusion, and floods (Abdullah et al. Citation2022). In contrast, the east coast has sandy beaches, little estuary islands, and mountains.
Besides cyclones and coastal flooding, severe rainfall and landslides have taken hundreds of lives in the east (Adnan et al. Citation2019). On the other hand, the inland area is in the Ganges-Brahmaputra-Meghna (GBM) basin and has a high elevation. The northcentral inland area has the highest population density. Although it suffers from less severe climatic occurrences, a rise will undoubtedly lead to the loss of life and resources (Ghose et al. Citation2021). Northeastern Bangladesh has many marshes and tiny hills and gets the most rain (Shahid Citation2010). More than 22 transboundary rivers govern the water supply in these wetlands, which are altered by climate change-induced precipitation (Rahman et al. Citation2020). Due to their dependency on wetland habitats in steep locations, climatic variations may affect coastal areas.
Bangladesh’s climate has four distinct seasons and varies in temperature and rainfall. The dry season (December–February) is followed by a hot and humid summer (pre-monsoon) from March to May. The monsoon, or rainy season, runs from June through September when 75% of the country’s rainfall falls. Temperature and precipitation exhibit seasonal and regional fluctuations throughout the nation after the monsoon (Shahid Citation2010; Mallick et al. Citation2022). Winter temperatures in the northern and northeastern regions average 17 °C, while seashore temperatures range from 20 to 21 °C (Islam et al. Citation2019). In the west, the average annual rainfall is 1,527 mm, while in the northeast, it is 4197 mm (Kamruzzaman et al. Citation2022). displays Bangladesh, the coastal and inland regions, and the meteorological stations used in this investigation. There have been different criteria considered for selecting the study area.
Figure 1. Selected coastal and inland areas among seven climatic zones of Bangladesh.
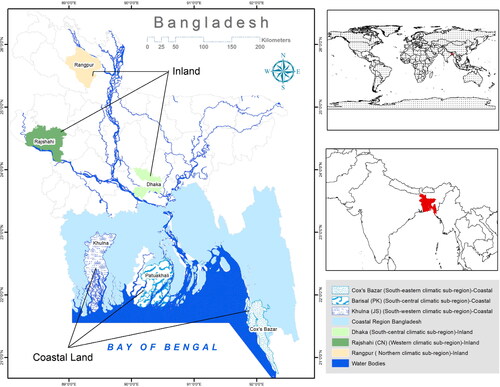
In comparison, high-population-density districts adjacent to the international border have been considered. Furthermore, three different inland and three coastal areas with the highest COVID-19 infection rates in Bangladesh were chosen. One of the other vital parts, Zone B (the northeastern zone), was not considered in the current research (Table S1) because it is in a different place.
2.2. Sample and data
A longer time series of meteorological variables might provide a more precise influence of meteorological factors on COVID-19 local transmission. Therefore, in this study, the time domain is divided into six seasons, from 2020 to 2021, to understand the potential COVID-19 spread in different meteorological conditions over Bangladesh. From March 3, 2020, to August 31, 2021, daily counts of laboratory-confirmed cases (if confirmed, total cases are at least two in each location) and meteorological variable data were gathered (544 days). Furthermore, throughout the research period, four meteorological seasons, namely a hot, humid summer (April to May), a humid monsoon period (June to September), the post-monsoon season (October-November), and a dry winter (December to February), coincided. This overlapping research period will aid in accounting for a broad range of climatic variables. The climatic factors that have been assessed for this research include the earth’s skin temperature (EST) (°C), relative humidity (RH) (percent), precipitation (P) (mm), wind speed (WS) (km/h), and ultraviolet (UV) Index (w/m2). The Institute of Epidemiology, Disease Control, and Research (IEDCR) supplied daily confirmed positive COVID-19 cases, while daily meteorological data including daily EST (°C), RH (percent), P (mm), and WS (km/h), and UV Index (w/m2) was received from the NASA Power Data Access viewer (https://power.larc.nasa.gov/data-access-viewer/). The Bangladesh Bureau of Statistics (BBS) provided the population density statistics (BBS Citation2015). The dependent variables were determined based on the number of COVID-19 positive cases. In 99.7 percent of the cases, positive PCR test results were used to determine if they were positive for COVID-19. The remaining instances were identified based on the presence of disease-related symptoms. Cases described as such happened daily in Bangladesh’s coastal and interior areas between March 8, 2020, and August 31, 2021.
2.3. Measures of variables
We examined data pertaining to the total number of COVID-19 positive cases. The values of Earth’s skin temperature (EST), wind speed (WS), precipitation (P), ultraviolet index (UVI), and daily average relative humidity (RH) were used as meteorological data. Whether the data is uniformly distributed or not, data quality management and homogeneity testing are required. Homogeneity tests, autocorrelation checks, and removal are performed to prepare the data for the tests and fit the model. Buishand range test (BRT) (Buishand Citation1982) were used to examine the homogeneity of daily CC, EST, WS, UVI, P, and RH data for each station for this research. The tests’ results show that all datasets are homogenous and well-organized for further investigation. The ANOVA test was also used to examine the stations’ homogeneity, revealing that all of them were significant (Table S2).
Table 2. Descriptive analysis of the meteorological factors and daily confirmed cases of selected areas (March 20 August, 21).
2.4. Model and data analysis procedure
The generalized linear model (GLM) was applied to show the lag effect of meteorological factors on the COVID-19 era. The Y axis of the plot represents the contribution factor as a percentage change, and the X axis delineates six different seasons, each with a single lag. However, several methods have been developed for estimating meteorological variables’ relative mortality risks (RR). Due to its efficiency, ease of use, and capacity to assess relative risk, Poisson regression is one of the most frequently used methodologies for unusual count events (Joshi et al. Citation2016; Briz-Redón and Serrano-Aroca Citation2020). Count data in epidemiological research, on the other hand, is often “over dispersed.” As a consequence, the variance of the variable set surpasses the mean, as we saw in our specific situation. To address overdispersion, generalized linear models are generated, with the most common approaches being a “quasi-likelihood” with Poisson-like assumptions (Quasi-Poisson) or a negative binomial regression model, both of which have been employed in death rate research (Ver Hoef and Boveng Citation2007; Ardiles et al. Citation2017). GLMs do not need any prior knowledge and may be used to assess the nonlinear effects of covariates on dependent variables. The primary advantage of this model is that it allows for non-parametric fits with looser assumptions on the true relationship between response and predictor, allowing for better data fitting than totally parametric models. As a result, the regression analysis used a generalized linear model from the negative binomial family in EquationEq. (1)(1)
(1) .
(1)
(1)
The final methodical model was as follows in EquationEq. (2)(2)
(2) :
(2)
(2)
where μi = E[Yi] indicates the expected counts of COVID-19 confirmed cases for the day i, β0 the model intercept, β1 and β2 are regression coefficients, Mi is meteorological parameters considered, and ti is the day of the record in order to account for the linear trend among COVID-19 dataset records.
The response parameter in this investigation was COVID-19 confirmed cases, while all other weather factors (EST, WS, RH, UVI, and P) were counted as independent parameters. After creating the core model, display the lag-wise influence of climatic variables on COVID-19 verified instances, and then assess the likely lagged effects. In this case, we choose 92 days in 1 lag for single lag days (lag 1 = days 1–92, (Summer) lag 2 = days 93–184, (Monsoon) lag 3 = days 185–276, (Post Monsoon) lag 4= days 277–368, (Winter) lag 5 = days 369–460, (Summer) and lag 6 = days 461–552 (Monsoon). This research examined the lag from March 8 since no death case was recorded prior to this date when lag days were included. The GLM analysis was carried out in R v3.6.3 using the 'glm2' package (v 1.8-31). The effect of each parameter was presented in percent change, with a 95 percent confidence interval in changing confirmed cases related with a 1-unit increase in climatic conditions.
2.5. Wavelet coherence analysis
Wavelet Transform Coherence (WTC) is employed to investigate the nexus between COVID-19 confirmed cases and climatic variables by evaluating the time-frequency bands of the indices across the coastal and inland areas of Bangladesh. This study obtained the expressions of time and frequency resolutions of meteorological variables and COVID-19 instances in Bangladesh using wavelet transform coherence (WTC) and partial wavelet coherence (PWC). WTC measures the amount of covariance between various time series varying from 0 to 1 (0 ≤ R2 ≤ 1). 0 denotes a complete lack of coherence, whereas 1 denotes full coherence. This range is defined as the smoothed individual power spectrum normalized by the cross-spectrum. Wavelets can show the link between two variables in the short, medium, and long term (Iqbal et al. Citation2020). In this work, we adopt wavelet analysis since it allows for simultaneous localization in the time and frequency domains. Wavelet theory may reveal data aspects that other signal analysis methods overlook, such as trends, breakdown points, and discontinuities in higher derivatives and self-similarity. There are multiple benefits to adopting wavelet methods in various data analysis sets. For example, (1) it is carried out from a time-frequency perspective and is very effective in assessing non-linear relationships. (2) When the premise of stationarity is relaxed, it applies to non-stationary time series. (3) It can detect significant events and the changes they represent. (4) Depending on the nature of the data, several wavelet functions may be used, allowing for more efficient and accurate co-movement tracking. (5) It may also determine the connection’s strength and direction, as well as the contrast between short-, medium-, and long-term relationships. 6) It may allow for lead-lag connections between several time-frequency couplings at the same time (Grinsted et al. Citation2004; Ng & Chan, Citation2012; Sleziak et al. Citation2015; Iqbal et al. Citation2020). Because the datasets were not normally distributed, the Spearman correlation coefficient was utilized to analyze the association between climatic factors and COVID-19 validated instances. The connection between daily confirmed cases and climatic conditions in the COVID-19 epidemic in Bangladesh was studied from March 8, 2020, to August 31, 2021.
Wavelet transform coherence (WTC) may show irregular connections between two occurrences, which improves linear correlation analysis (Gurley and Kareem Citation1999; Gurley et al. Citation2003). First, we converted the time series datasets using the “Morlet wavelet” technique, and then we utilized WTC to find the co-movements. The WTC ranges from 0 to 1 ( 0 refers to no coherence at all whereas 1 denotes perfect coherence. This range is defined as the cross-spectrum normalized square of the smoothed individual power spectrum (Torrence and Compo Citation1998), which may be stated simply by the following EquationEq. (3)
(3)
(3) :
(3)
(3)
where
and
are two time series with their respective wavelet transforms
and
The Monte-Carlo simulation approach was also used to determine the statistical significance of the results. WTC was used to examine the co-movement of two parameters.
2.6. Partial wavelet coherence
This method examines the co-movements of two time series variables while adjusting for the common influences of a third variable. The mathematical derivation of partial wavelet coherence (PWC) is shown in the EquationEqs. (4)–(9):
(4)
(4)
(5)
(5)
(6)
(6)
(7)
(7)
(8)
(8)
(9)
(9)
Whereas "R" signifies the coherence of two series datasets, "x1", "x2", and "y" signify time series variables. WTC is defined by EquationEqs. (3)–(7) between three plausible integrations of variables x1, x2, and y. EquationEq. (8)(8)
(8) is a mathematical depiction of PWC that computes the WTC between two series, y and x1, while adjusting for the common effects of x2 on the associations. Monte Carlo simulation was used to calculate the confidence level in WTC and PWC.
2.7. Multiple wavelet coherence
Three-time series, like PWC, were employed in multiple wavelet coherence (MWC). To comprehend the MWC, it is compared to the coefficient of a variety of relationships. However, the impacts of the third series were not mitigated in this manner. It is instead combined with the second series to investigate the coherence of the dependent series y with the combining of independent series and
For multiple wavelet coherence, EquationEq. (10)
(10)
(10) is as follows:
(10)
(10)
whereas "RM2" represents the dependency of variable "y" on the linear connection of two additional time series variables, "x1" and "x2" (Ng and Chan, Citation2012). Figure S1 shows the methodological framework used for this research.
3. Results
3.1. Descriptive statistics
The temporal distribution of COVID-19 daily confirmed cases and meteorological variables in Bangladesh during the study period is displayed in Figure S2, demonstrating that COVID-19 confirmed cases/day distributed in a similar pattern to Earth Skin Temperature (EST), Wind Speed (WS), Relative Humidity (RH), and Ultraviolet Index (UVI), with the exception of active precipitation (P), which displayed an irregular shape with the daily confirmed cases of COVID-19 in Bangladesh.
Figure 2. Confirmed daily cases of the COVID-19 both inland (a, c and e) and coastal land (b, d and f) over the period from March 8, 2020, to August 31, 2021.
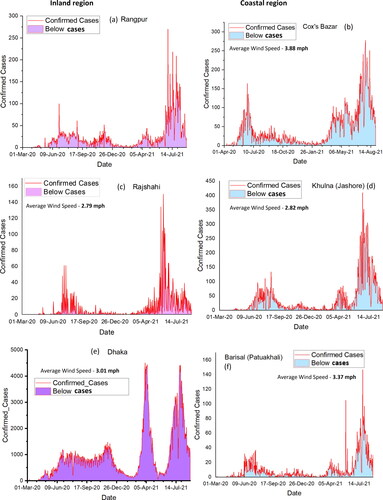
shows a temporal overview of daily COVID-19 pandemic cases detected and weather parameters for both the inland and coastal areas of Bangladesh. where the inland regions such as Rangpur, Rajshahi, and Dhaka are considered, respectively, (, c and e) and the coastal regions like Cox’s Bazar, Khulna, and Barisal are considered (, d and f). During the research period (March 8, 2020–August 31, 2021), a total of 1,500,618 confirmed cases and 26,195 fatalities were well documented (IEDCR (Institute of Epidemiology and Disease Control and Research) Citation2021; WHO 2021). The depiction shows that the most contagious months are April to July, and the coastal wind speed is higher than the inland, and the affection rate is higher in the inland region.
The number of confirmed cases has increased with the rising incidence of COVID-19 testing. In this investigation, considering inland minimum (ESTmin) and maximum (ESTmax) earth Skin temperatures, ranged from 12.55 to 33.93 °C and 26.31 ± 4.6 °C with their mean, for Rangpur (); 12.15 to 36.90 °C and 26.95 ± 5.4 °C for Chapai-Nawabganj, Rajshahi (); 14.05 to 33.93° C and 26.31 ± 4.4 °C for Dhaka (), respectively. For the Coastal region, minimum (ESTmin) to maximum (ESTmax) ranged from 12.69 to 36.75 °C and 26.87 ± 4.8 °C for Jessore, Khulna (); 15.39 to 33.40 °C and 26.72 ± 4.1 °C for Patuakhali, Barisal (); and 20.80 to 30.96 °C and 27.58 ± 2.3 °C for Cox’s Bazar, Chittagong () ().
For the inland region, the relative humidity (RH) had a range between 21.81 and 95.31 percent for Rangpur; 15.81 and 94.25 percent for Chapai-Nawabganj, Rajshahi; and 31.56 to 95.50% for Dhaka. Meanwhile, in the coastal land, the range was 26.12 to 95.94% for Jessore, Khulna; 47.06 to 93.94% for Patuakhali, Barisal; and 57.19 to 90.75% for Cox’s Bazar, and Chittagong. However, the mean relative humidity (MRH) was 74.09%, 69.63%, 77.03%, 75.52%, 80.25%, and 80.23% for consecutively: Rangpur; Chapai-Nawabganj, Rajshahi; Dhaka; Jessore, Khulna; Patuakhali, Barisal; and Cox’s Bazar, Chittagong. During the study period, precipitation averaged 10.26 mm, 5.67 mm, 8.45 mm, 8.11 mm, 11.65 mm, and 21.66 mm against Rangpur; Chapai-Nawabganj, Rajshahi; Dhaka; Jessore, Khulna; Patuakhali, Barisal; and Cox’s Bazar, Chittagong.
Meanwhile, wind speed (WS) at 10 meters consisted of the following range from minimum to maximum: 0.96 to 10.78 km/h at Rangpur; 0.71 to 11.03 km/h at Chapai-Nawabganj, Rajshahi; 0.81 to 10.12 km/h at Dhaka; 0.73 to 12.50 km/h at Jessore, Khulna; 0.47 to 12.98 km/h at Patuakhali, Barisal; and 1.04 to 11.2 km/h at Cox’s Bazar, Chittagong. Eventually, during the study period, solar radiation such as the ultraviolet index had a mean of 1.34 mw/m2, 1.30 mw/m2, 1.53 mw/m2, 1.39 mw/m2, and 1.74 mw/m2 for consecutively against Rangpur, Chapai-Nawabganj, Rajshahi, Dhaka, Jessore, Khulna, Patuakhali, Barisal, and Cox’s Bazar ().
3.2. COVID-19 affected rate and meteorological factors using GLM model
The GLM model has been operated in one coastal and one inland area. The study area was chosen based on the distance between the political boundary and the affection rate. Patuakhali and Barisal have considered the coastal region and Dhaka as an inland study area. In , the blue plots () represent the coastal region, and the matte plots () represent the inland region.
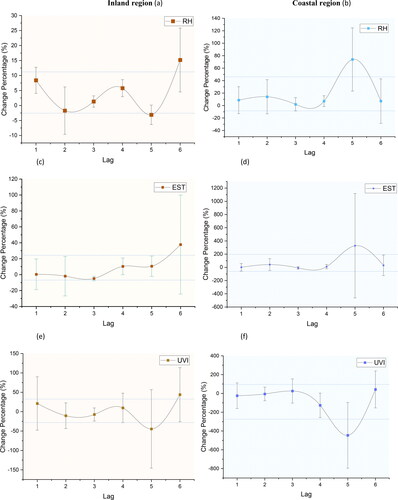
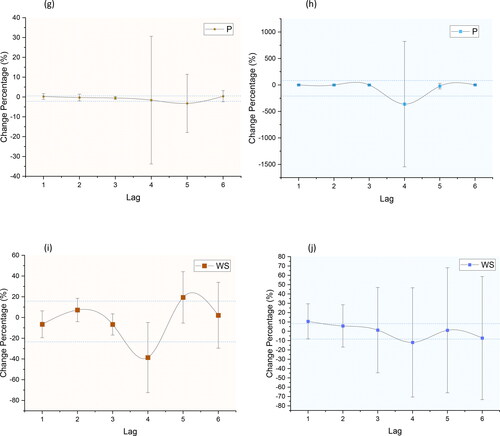
Figure 3. The association of slope changes between COVID-19 daily confirmed cases and RH (a), EST (b), UVI (c), P (d) and WS (e) with a 1-unit increase in meteorological factors for the effects of the multiple-lag (6) season based on the GLM models for both coastal and inland region over Bangladesh at 95% confidence interval. Where the blue plots (a, c, e, g and i) represent the coastal region, and the matte plots (b, d, f, h and j) represent the inland region.
3.2.1. Coastal seasonal variation
depicts the contribution factor by slope variations of COVID-19 confirmed counts per 1-unit elevation in climatic conditions with varying lags (1–6) using GLMs modeling. In a single lag, increases in all parameters except UV, such as EST, WS, UV, P, and RH, were linked to an increase in COVID-19 confirmed cases in lag 1, which means the first summer season such as 1.1% (95% CL 29.7–27.4%); 10.6% (95% CL 20.05%, 1.21%); −24.3% (95% CL 43.61–92.2%); 1% (95% CL 2.72–0.71%); 8.64% (95% CL 19.4% − 2.16%), respectively.
Similarly, for lag 2, which represents the humid summer season, EST has the highest increasing rate with COVID spread-out, which is 41.9% (95% CL 86.32– 2.54%), followed by 5.72% (95% CL 17.08–5.65%), −5.74% (95% CL 30.48– 41.95%), −0.54% (95% CL 0.63–1.71%), and 14.09% (95% CL 27.78%, 0.41%).
Meanwhile, for lag 3, which is the monsoon season, the most significant atmospheric parameter is UVI, which is 25.6% (95% CL 89.88–38.76%), and sequentially, others are: −8.16% (95% CL 1.64–17.96%); 1.23% (95% CL 24.08–21.64%); −0.15% (95% CL 1.18–1.48%); 2% (95% CL 7.35–3.35%) for EST, WS, P, and RH.
On the contrary, again, the post-monsoon season of 2020, named after lag 4, is highly influenced by EST, consisting of a value of 10.86% (95% CL 27.07–5.35%), while other values of WS, UV, P, and RH are comparatively less significant: −11.97% (95% CL 17.33–41.26%); −126.8% (95% CL −61.97% to 191.6%); −361.7% (95% CL 230.7–954.05%); 7.07% (95% CL 11.4–2.72%).
The first summer of 2021, also known as Lag 5, revealed that EST is the most effective against COVID contamination in the country’s coastal region. Here the percentage value of EST is 327.25% (95% CL 722.39–67.88%), and the others are consecutively 1.07% (95% CL 34.6–32.45%); −445.9% (95% CL −271.2–620.8%); −22.15% (95% CL 4.56–48.85%); and 73.97% (95% CL 99.3%, 48.63%) for the WS, UV, P, and RH variables.
Last but not least, the final humid summer season of 2021 that is mentioned as Lag 6 exposes a different insight. This particular lag represents UVI as the most significant variable. EST is located just after the first place. Here, the parameters and values are: EST; WS; UV; P; and RH; successively, 30.64% (95% CL 108.48%–47.2%); −7.32% (95% CL 25.67–40.32%); 42.58% (95% CL 140.92–55.75%); 1.34% (95% CL 3.81–1.13%); 7.18% (95% CL 25.03–10.67%).
3.2.2. Inland seasonal variation
For the summer monsoon season (lag 1) over the inland region, UVI exposes the most significant association, which is 21.1% (95% CL 55.5–13.29%; ). Then, the second most significant association occurs with RH, which consists of a value of 8.40% (95% CL 10.58%, 6.22%). Thus, EST ranks second in terms of COVID association, with a rate of 0.42% (95% CL 10.03–9.18%); precipitation contributed 0.25% (95% CL 0.97–0.47%), and WS had a negative association rate of −6.56% (95% CL −0.1%, −13.02%).
WS is the most significant effector associated with daily COVID at a rate of 7.2% (95% CL 12.84%, 1.58%) in Lag 2, followed by P, −0.27% (95% CL 0.57–1.12%), RH, −1.72% (95% CL 2.24–5.68%), EST, −1.87% (95% CL 10.55%, 14.29%), and UVI, −10.38% (95% CL 6.18%, 26.93%). Lag 3, which represents the monsoon season, reveals RH of 1.33% (95% CL of 2.27%, 0.39%) as the most affecting factor. The ceremony is then joined by precipitation: −0.50% (95% CL −0.13%, −0.87%); EST, −4.86% (95% CL-3.44%, −6.28%); WS, −6.66% (95% CL −1.55%, −11.78%); and UVI, −7.22% (95% CL 1.22%, 15.7%).
The post-monsoon, which is considered to be lag 4 (EST), accounts for 10.39% (95% CL 15.64%, 5.16%) of the most vital contributor, which is positively associated with the contamination. Then, sequentially, UVI was 9.74% (95% CL 28.74–9.26%), RH was 5.78% (95% CL 7.19%, 4.36%), and precipitation was −1.58% (95% CL 14.52–17.69%), while WS was −38.62% (95% CL −21.71%, −55.53%). Lag 5, again in the summer of a consecutive year, exposes WS as the first significant priority at 19.39% (95% CL 31.78%, 7%). EST, 10.64% (95% CL, 17.01%, and 4.25%), was the season’s second-most positive association. RH, −3.1% (95% CL −1.48% to 4.73%); and P, −3.23% (95% CL 4.1–10.57%) contain quite similar ranges of percentage. Though UVI, at −44.5% (95% CL, 6.1–95.2%), had the highest negative concentration in the contamination for this particular lag, Finally, the humid summer of 2021, lag number six, had a UVI of 43.97% (95% CL 78.77%, 9.18%) as the highly triggering variable. EST, 37.76% (95% CL 68.82%, 6.69%); had finished second. Thus, RH was 15.18% (95% CL 20.5%, 9.85%); WS was 2.13% (95% CL 18.01–13.75%); and precipitation was 0.38% (95% CL 1.79–1.03%).
3.3. Association between meteorological factors and COVID-19 case
For the understanding of the overall country’s condition and the assumption of both the different geographic study regions, the Spearman correlation test was used for data analysis. The results of the Spearman correlation test are shown in . Whereas earth’s surface temperature (r = 0.51; p = 0.05) was significantly correlated with the contamination in the coastal region, and relative humidity (r = 0.052; p = 0.05) had the highest correlation within the inland region, both parameters were significantly correlated with COVID-19 pandemic positive cases because the p value was greater than 0.05. On the contrary, wind speed (r = 0.41; p = 0.05) has a significant impact on the coastal region. Similarly, precipitation (r = 0.39; p = 0.05) and UV index (r = 0.20; p = 0.000) both in coastal and inland areas were comparatively less strong but significantly correlated with the COVID-19 pandemic because the p value is less than 0.05. For the confirmed cases of inland over Rangpur, relative humidity (RH) (r = 0.52; p = 0.062); for Rajshahi, precipitation (P) (r = 0.34; p = 0.255); and for Dhaka, relative humidity (RH) (r = 0.40; p = 0.062) were significantly correlated with COVID-19 pandemic spread because the p value is less than 0.05 (). Similarly, for coastal land, Jessore, Khulna Relative Humidity (RH) (r = 0.47; p = 0.028), Barisal (Patuakhali) Relative Humidity (RH) (r = 0.47; p = 0.007), pressure (r = −0.429; p = 0.016), and Earth Skin Temperature (EST) (r = 0.51; p = 0.000). These specific variables were significantly correlated with COVID-19 pandemic spread because the p value was less than 0.05.
Table 3. Spearman correlation test result of Climatic parameters with COVID-19.
3.4. Interrelationships between meteorological attributes and COVID-19 cases
For this investigation, regional averages of the indices are considered. represents the WTC between COVID-19 and climatic variables for the coastal area, while illustrates the inland area. elicits some short-term coherence bands within the 0-4, 4-8, and 8-16 frequency bands throughout the time series, where most of the bands suggest an in-phase relationship between COVID-19 and EST. The WTC between COVID-19 and P reveals both short- and long-term coherence bands (correlations above 0.7) within the cone of influence throughout the time series ().
Figure 4. (a–j): Wavelet coherence (WTC) between COVID-19 confirmed case series with EST (a), P (b), RH (c), UVI (d), WS (e) for coastal area and EST (f), P (g), RH (h), UVI (i), WS (j) for inland.
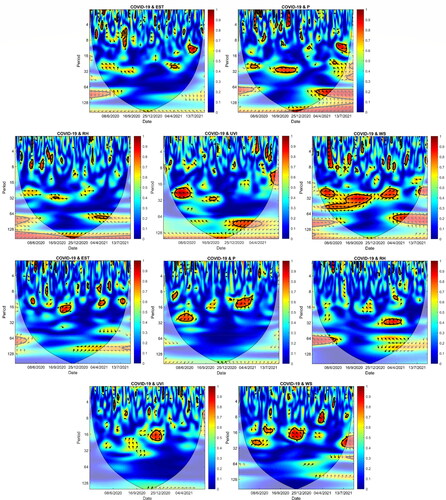
Although there is an out-of-phase-indicating angle within the 0–4 frequency band during the early phase of the time series, the majority of the phase angles also indicate an in-phase relationship between the indices. Like EST, RH shows some small islands within the 0–4 and 4–8 bands in the time-frequency map () all along the study period; the phase angles denote an out-of-phase relationship between COVID–19 and RH. A red island with a correlation value of 0.8–0.9 appears in the 16–32 frequency band, hinting at an out-of-phase relationship between COVID-19 and UVI () during the early period of the observation, while some short-term coherence bands are also seen with an out-of-phase relationship within the 0–4 and 4–8 frequency bands. Multiple large-sized islands emerge in the time-frequency map of COVID-19 and WS (), along with several small islands.
The largest island is observed in the 32–64 band extent from April 2020 to December 2020, with an in-phase arrow. The other two notable coherence bands are in the 16–32 frequency band and occur in May–June 2020 and February–April 2021, respectively, where COVID-19 and WS have an in-phase relationship. For inland areas, COVID-19 and EST () exhibit multiple short-term coherence bands, mainly in the 0-4, 4-8, and 8-16 bands all over the observation period, where the phase angles are mostly irregular. COVID-19 and P () depict two long-term coherence bands within the 8-16 and 16-32 frequency bands, while several short-term coherence bands are scattered mainly in the 0-4 band for inland areas.
The first long-term coherence was observed from May 2020 to July 2020 with a correlation value of 0.7–0.8, whereas the other band was found during February–April 2021. In both cases, the phase arrows indicate that the COVID-19 series lagged behind P. A single medium-sized island is noticeable at the edge of the 16–32 band in the time-frequency map of COVID-19 and RH () during February–April 2021, along with some tiny atolls mostly in the 0–4 band.
The phase angle for the larger island indicates that the COVID-19 series is ahead of the RH series during this time. depicts several small, medium, and large islands within the area of significance throughout the observation period. The largest of them appears in the middle of the time series, with a correlation value of around 0.8 ranging from November 2020 to January 2021 within the 16–32 frequency band. Two medium-sized coherence bands appear in June 2020 (8–16 band) and July 2020 (16–32 band), respectively, both having a correlation value of around 0.7. The phase angle of these islands indicates that the COVID-19 series is lagging behind the WS series. Another island with a correlation value of around 0.8 is seen during April 2021, occupying 4-8 and 8-16 bands, where WS has an in-phase relationship with COVID-19. WTC between COVID-19 and UVI () exhibits irregular short-term coherence in the 0-4 and 4-8 bands throughout the time series, while a medium-sized coherence band is observed within the 16-32 frequency band during December 2020, where COVID-19 series lags behind UVI.
In the WTC analysis, P and WS had more significant short- and long-term associations with COVID-19 confirmed cases than EST, RH, and UVI. P and WS were found to be more associated with COVID-19 in coastal areas than in inland areas. In the next step, we intend to investigate the independent effects of the less significant factors, namely EST and RH, while restricting the effects of the highly significant parameters, such as P and WS, by employing Partial Wavelet Coherence (PWC). Through multiple wavelet coherence (MWC), we also aim to study the combined effects of the lesser and greater significant variables on the COVID-19 confirmed cases. However, UVI is excluded from these analyses since this index does not have the same data length as the other indices.
In the coastal region, EST () and RH () have short-term coherence with COVID-19 while controlling the common effects of P. For EST, the small islands appear in the 0–4, 4–8, 8–16, and 16–32 frequency bands, whereas for RH, the islands are concentrated in the 0–4 and 4–8 bands. Even though P has less of an effect, WS shows multiple short- and long-term coherence bands with COVID-19 in coastal areas ().
Figure 5. Partial wavelet coherence (PWC) of COVID-19 confirmed case series with EST, P (a) RH, P (b), WS, P (c), EST, WS(d), RH, WS (e) WS, P (f) for coastal and EST, P (g) RH, P (h), WS, P (i), EST, WS(j), RH, WS (k) WS, P (l) for inland. The gradient bars indicate the variation in wavelet coefficients. The 5% significance level against red noise is shown as a thick contour.
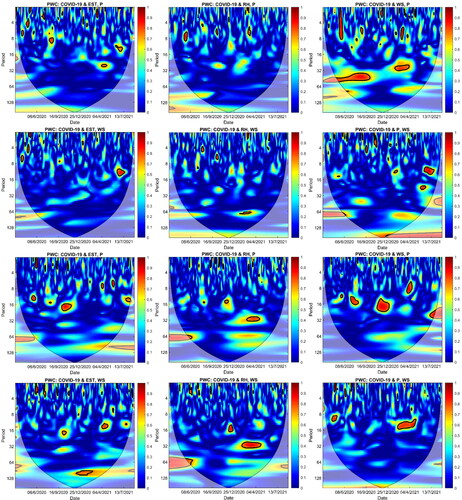
The short-term bands are floated mostly in the 0–4 and 4–8 bands, while a short-term but long band was seen in the 0–8 frequency band during May 2020. The longest coherence appears in the 32–64 frequency band with a correlation of approximately 0.8, extending from the beginning of the time series to September 2020. A medium-sized coherence band is also found within the 16–32 band during February–April 2021. While the common influences of WS are minimized, EST () and RH () reveal similar findings to when the influence of P was constrained. The coherence between COVID-19 and P () is significantly reduced compared to WTC’s () when the influence of WS is controlled in the coastal region. This time, no long-term coherence is seen between COVID-19 and P in the absence of the effects of WS, while some short-term coherence bands still occur within the 0–4, 4–8, 8–16, and 16–32 frequency bands.
elicit the PWC between COVID-19 and the climatic variables, while the common influence of P and WS is restricted, respectively, for the inland areas. EST shows some short-term coherence bands with the COVID-19 series in the absence of the influence of P () in the 0-4, 4-8, and 8-16 bands mostly, while a notable coherence band appears in the 16-32 band at the middle of the time series. RH also exhibits short-term coherence mainly in the 0–4 and 8–16 bands, with a medium-sized island in the 16–32 band (). However, WS elicits multiple notable islands in the 4–8, 8–16, and 16–32 frequency bands, along with some tiny atolls in the 0–4 band ().
The largest island appears at the juncture of the 8–16 and 16–32 bands during November 2020–January 2021, with a correlation value of nearly 0.85. COVID-19 and EST depict several small islands in the time-frequency map, while the common influence of WS is unavailable (Figure 7j). Most small islands appear in the 0–4, 4–8, and 6–32 bands, while some relatively larger islands are seen in the 8–16 and 16–32 bands. Also, an isolated island appears in the 64–128 band during December 2020–February 2021, with a correlation value of around 0.75.
depicts the coherence between COVID-19 and RH in the absence of the effects of WS. Several tiny atolls appear in the 0–4 bands, while a single island at the end of the 8–16 band and a relatively longer island are observed during February–April 2021 at the edge of the 16–32 band. The time-frequency map of COVID-19 and P shows several small and a single large coherence band (). The large coherence band was observed in the 8–16 frequency band during February–April 2021, with a correlation of nearly 0.8.
The PWC results show that the coherence of the variables, that is, EST and RH with COVID-19, diminished when the influences of P or WS were restricted. Furthermore, the coherence between COVID-19 and P was hampered mainly by the absence of the effects of WS in both coastal and inland areas. In contrast, the PWC between COVID-19 and WS exhibited both short- and long-term coherence, despite the common effects of P being minimized.
MWC can demonstrate how two linearly combined independent series run along with a dependent series. illustrates the MWC findings using the COVID-19 confirmed cases as the dependent series and different climatic variables as the independent series for the coastal region. MWC between the COVID-19 and EST-P combinations shows much short-term coherence, mostly concentrated on the frequency bands of 0–4 and 4–8 (). However, two relatively larger coherence areas appear in the 8–16 and 16–32 frequency bands during June–August 2021 and September–December 2020, respectively. Although some other long-term coherence bands are observed, those are outside the cone of influence. Like EST-P, RH-P displays lots of short-term coherence in the 0–4 and 4–8 bands all over the time series (). A long-term coherence is found during August–November 2020 at the edge of the 16–32 frequency band with a correlation of approximately 0.85. EST () and RH () delineate plenty of tiny atolls in the 0-4, 4-8, and 8-16 bands all over the given period when the influences of WS are added to them. They also have a very long coherence band that spans 16-32 and 32-64 frequency bands from April 2020 to April 2021, with a correlation value ranging from 0.75 to 0.85. Analogous results are found when P is incorporated with WS for the MWC with the COVID-19 series (). Also, some medium-sized islands appear in the 16–32 frequency band. The largest island started at the beginning of the time series and ended in December 2020, covering both 16-32 and 32-64 frequency bands, with a correlation value ranging from 0.75 to 0.85. For inland areas, the EST-P combination has multiple short- and long-term coherences (). The short-term coherence bands are found mainly in the 0–4 and 4–8 frequency bands, while the larger coherence areas are in the 8–16 and 16–32 frequency bands. Similarly, several small and large islands appeared in the time-frequency map () when we used COVID-19 as a dependent variable and RH-P as an independent variable. The larger islands are mostly found in the 8–16 and 16–32 bands, while the smaller atolls are mostly concentrated within the 0–4 and 4–8 bands. A lot of small areas of coherence are observed within the 0–4 and 4–8 frequency bands between the COVID–19 and EST–WS combinations (). Several medium-shaped areas of coherence are mostly found within the 8–16 band, while a large area of coherence occupies the 8–16 and 16–32 frequency bands from September 2020 to January 2021, with a correlation value ranging between 0.8 and 0.9 approximately. Another long-term coherence appears in the 64–128 frequency band extended from the middle to the end of the time series, but most of the area of this island is outside the area of significance. The time-frequency map of the COVID-19 and RH-WS combination reveals several medium- and large-sized red islands with thick black contours, mainly in the 8–16 and 16–32 frequency bands (). The small islands are seen in the frequency bands of 0–4 and 4–8. The largest of the islands is apparent in the middle of the time series, with a correlation value of nearly 0.9, occupying both the 8–16 and 16–32 frequency bands. The MWC between COVID-19 and P-WS reveals some large coherence bands as well as a lot of short-term coherence (). The largest coherence area covers the 4–8 and 8–16 frequency bands during February–May 2021, with a correlation value ranging from 0.8 to 0.95. The second-largest coherence area occurs at the joining point of the 8–16 and 16–32 bands during the middle of the time series, while the third-largest one occurs within the 16-32 band during May–July 2020.
Figure 6. MWC of COVID-19 confirmed case series climatic factors (The thick black cone shaped contours show the 95% significance level, and the black line is the cone of influence.
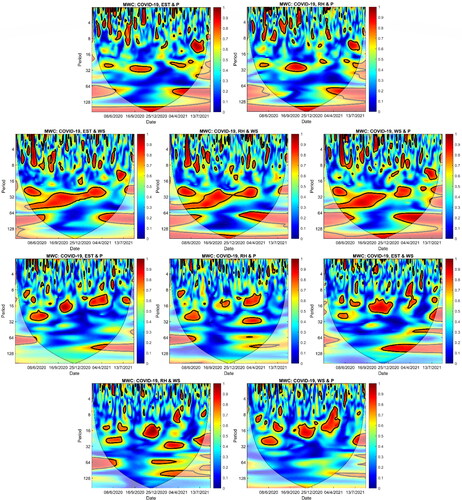
MWC results revealed that the coherence between the COVID-19 and climatic parameters substantially improved when two of the climatic parameters were combined. The coherences were more visible along the coast than inland. In both regions, the added influence of WS on the other climatic variables, i.e. EST and RH, was greater than that of P in relation to COVID-19 confirmed cases.
4. Discussion
COVID-19 has caused global health and economic problems. This study examined the COVID-19 vs meteorological factors nexus in two Bangladeshi areas. In South Asia’s sub-humid region, temperature and UV radiation index affected COVID-19 rates, while wind speed, temperature seasonality, and intensity were significantly impacted. The coastal area’s skin temperature, wind speed, and relative humidity affected COVID-19 transmission. Our findings also demonstrated that in the coastal region, the seasonality of temperature, wind speed, and COVID-19 transmission intensity is positive, while precipitation is negative. COVID-19 improves the earth’s skin temperature, relative humidity, and temperature in the inland zone. Climate relationship results match previous studies (Pramanik et al. Citation2020). Many studies have connected temperature changes to COVID-19 instances, especially lower temperatures (Fallah and Mayvaneh Citation2016; Dadbakhsh et al. Citation2017).
Other investigations have found that mean temperature and relative humidity have a significant influence on the COVID-19 era (Liu et al. Citation2020; Pani et al. Citation2020; Tantrakarnapa and Bhopdhornangkul Citation2020; Tobías and Molina Citation2020; Xie and Zhu Citation2020; Zoran et al. Citation2022b). However, most research showed a link between temperature and the COVID-19 pandemic (Hossain et al. Citation2020; Liu et al. Citation2020; Menebo Citation2020; Meyer et al. Citation2021; Shi et al. Citation2020; Tobías and Molina Citation2020; Pahuja et al. Citation2021; Zoran et al. Citation2022a). Our results further confirm the assumption that increased relative humidity may reduce the COVID-19 outbreak, as evidenced by the majority of previous research evaluating the same hypothesis using various data and techniques (Ahlawat et al. Citation2020; Qi et al. Citation2020; Sahin et al. Citation2020; Wu et al. Citation2020; Zhu et al. Citation2020). Other studies (Alkhowailed et al. Citation2020; Chien and Chen Citation2020; Pani et al. Citation2020) found a positive link, while a few (Pan et al. Citation2021) found none. Although many studies have been conducted to investigate the impact of weather conditions on the COVID-19 epidemic in Bangladesh (Hridoy et al. Citation2021; Islam, Hasanuzzaman, Shammi, et al. Citation2021), the findings did not indicate which geographic setting in Bangladesh was more likely to have outbreaks. Our research filled the gap. Like other studies with different objectives, this study aimed to understand the lag-based seasonal variance of the SARS-CoV-2 contamination trend. Since Bangladesh’s first confirmed case date, 542 days of data have been collected in this research.
Previous literature analysis suggested that relative humidity may be linked to the rise in COVID-19 cases in Bangladesh. This study also examined meteorological condition heterogeneity using sub-sample gaussian regression by location. Most studies on the pandemic’s impact on Bangladesh’s weather conditions used time series data from a single city or country (Hridoy et al. Citation2021; Rahman et al. Citation2021; Islam, Hasanuzzaman, Azad, et al. Citation2021; Islam, Hasanuzzaman, Shammi, et al. Citation2021). Due to sample and data structure restrictions, this research could not study the spatial heterogeneity of weather influence on COVID-19 era. Other Bangladeshi research incorporates samples from many cities (Hridoy et al. Citation2021; Islam, Islam, et al. Citation2021), however, they do not address regional climatic variability. In fact, two geographical areas of Bangladesh have quite different climatic features due to height and coastal and inland locations. So, heterogeneity research on climatic variables is needed to determine how mean temperature and relative humidity affect dispersion in various areas. No study has examined the seasonality of temperature differences with other meteorological variables (Liu et al. Citation2020; Park et al. Citation2020). Temperature variations should be considered even when humidity is the same. In dry inland and warm coastal locations, huge day-to-night temperature swings increase the chance of an outbreak of COVID-19.
This analysis identified the most COVID-19 instances in the humid summers of 2020 and 2021. Several studies (Auler et al. Citation2020; Bashir et al. Citation2020; Gautam Citation2020; Tosepu et al. Citation2020; Wu et al. Citation2020) suggest that MT and RH are the most important factors in COVID-19 transmission. Thus, relative humidity is the main climatic factor affecting COVID-19 infection in a different region. Climate variables are weakly correlated with COVID-19 new cases, according to the Spearman correlation coefficient. In the inland area, relative humidity correlates most with transmission rate across Rangpur and Dhaka districts while, in coastal area, relative humidity affects Khulna and Barisal contamination rates.
Based on seasonal fluctuation data, lag shows that coastal WS and inland UVI are influential during the summer. The GLM model displayed that EST, UVI, and RH had the most significant impact on contamination, and precipitation decreases confirmed the COVID-19 case. The temperature may be the most critical factor affecting COVID-19-confirmed case rates in humid or sub-humid climates like Bangladesh. In contrast to geographic conditions, patient demographics, social isolation policies, environmental factors, housing and age distribution, and health implications are risk factors for COVID-19 transmission (Fang et al. Citation2020; Zhou et al. Citation2020). These factors deserve further investigation.
A wavelet coherence study showed that P and WS were more coherent with COVID-19-positive instances than EST, RH, and UVI. Coastal coherency was higher than inland. The partial wavelet coherence findings showed that highly coherent parameters like P and WS were limited, while the coherence of other climatic components like EST and RH with COVID-19 declined. Hence, P and WS govern COVID-19's interaction with the GLM model’s most influential climatic variables (EST and RH). EST and RH had no effect in COVID-19 patients without P and WS. In coastal and inland locations, WS had a greater solo influence on COVID-19 than P. Multiple wavelet coherence revealed that COVID-19 and climatic parameters were much more coherent when P and WS were introduced. On COVID-19 confirmed cases, WS had a greater effect on EST and RH than P. The GLM model suggests EST, UVI, and RH are the essential elements for COVID-19 transmission, but the wavelet findings explain why WS and P are more important. These findings are intriguing and may help researchers understand COVID-19's shifting features. Large datasets and statistical analysis are needed to study this topic locally or globally. Our investigation indicated that COVID-19 and climatic parameters in coastal and inland locations match well. In Dhaka, Bangladesh, Rahman et al. (Citation2021) found connections between COVID-19 and meteorological markers such as mean temperature and relative humidity. Islam, Hasanuzzaman, Shammi, et al. (Citation2021) found that climate may directly and significantly alter COVID-19 infection rates. This study neglected contact transmission and population density, although COVID-19 spreads faster in urban cities than in rural areas. Pollution, exposure periods, and the COVID-19 pandemic require further investigation. Several factors may influence the public health lockdown policy.
Most of the work on how weather affects COVID-19 worldwide (Rosario et al. Citation2020; Rahimi et al. Citation2021; Alsayed Citation2022; Li and Zhang Citation2022) uses single samples, such as an entire county or city. These studies could not further investigate the geographical heterogeneity of the weather impact due to sample number and data structure restrictions. Although several works (Coccia Citation2020) included samples from many cities or countries, they must address regional heterogeneity. In reality, there are significant changes in the location of inland and coastal areas in Bangladesh, which affect how the weather is in different parts of the country. Thus, a heterogeneity study of weather effects is required to investigate the variations in the influence of mean temperature and relative humidity on the COVID-19 pandemic in different locations. The study’s main strength is its extensive observation datasets from disparate geographic locations, as well as its consideration of numerous confounding variables.
5. Limitations and future research
Our investigation has a limitation since we concentrated on climatic variables without taking into account other relevant factors. Moreover, a data system that is overburdened may cause a human error in the data route, and some government officials may hinder the real data release (Dubrow, 2021). Hence, the daily reported case data may under report COVID-19 and have an impact on the outcomes as the dependent variable. While the GLM approach we used may have lessened the effects of unobserved factors, investigations relating to COVID-19 were still limited by the reporting quality of case data (Rahman et al. Citation2021). The relationship between the weather and the transmission of COVID-19 is still up for debate. Weather events have very little influence on the distribution of COVID-19, whether it is required by the government or not (Hossain et al). Although air quality is out of scope of the study, we will incorporate air quality in the future study.
Seasonal variations and public health activities affect the COVID-19 pandemic (Polgreen and Polgreen Citation2018; Paraskevis et al. Citation2020). Quick and strict public health efforts may stop the pandemic (Thu et al. Citation2020; Lin et al. Citation2022), and significant social concern might promote public understanding of the epidemic and preventative awareness (Shammi et al. Citation2020). Further study will examine how each climatic factor affecting pandemic seasonality in Bangladesh. This study showed that the COVID-19 outbreak was affected differently by the environment in coastal and inland areas. This finding expands the study’s understanding of COVID-19 infections and climate in different places, which deserve further investigation. Future research should include evapotranspiration and other meteorological variables to increase accuracy. This research could not entirely depict the connectivity between each climatic parameter separately from others.
5. Conclusion
This study intends to explore the seasonality of meteorological factors affecting COVID-19 incidence over two distinct geographical settings in Bangladesh for the first time. The results demonstrated that EST, RH, UVI, and WS are all strongly linked to an increased incidence of COVID-19. On the other hand, this is highly correlated with a reduced daily P likelihood of COVID-19 occurrence. The results also suggest meteorological factors will mediate future COVID-19 transmission in Bangladesh. Moreover, the association was relatively stronger in the coastal region than in inland areas. The PWC and MWC results revealed that the coherence of the variables, that is, EST and RH with COVID-19, became weak when the influences of P or WS were restricted. However, when the effects of P and WS were added to the main variables, the coherence of EST and RH became much stronger in both regions. The study shows that Bangladesh needs to act quickly and take steps to fight the COVID-19 pandemic, taking climate into account. Notwithstanding government health regulations and measures, population immunity and capability against SARS-CoV2 are improving. So, this research strongly suggests that the only choices are to have the best health governance and give enough information to the general public. The inland region must continue vaccination and nonpharmaceutical measures of control, and good governance, considering the seasonality factors of climate from June through September due to a new variation. These findings support stronger prevention, control, and public awareness in severe weather areas. This paper suggests policymakers considering temperature-related seasonal fluctuations. This work may also be helpful for future research in developing countries with similar climates.
| Terms and Acronyms | ||
| RH | = | Relative Humidity |
| EST | = | -Earth Skin Temperature |
| WS | = | -Wind Speed |
| P | = | -Precipitation |
| UVI - | = | Ultraviolet Index |
| CC - | = | Confirmed Cases |
| GLM - | = | Generalized Linear Model |
Acknowledgements
Authors thankfully acknowledge the Deanship of Scientific Research for proving administrative and financial supports. Funding for this research was given under award numbers RGP2/190/43 by the Deanship of Scientific Research; King Khalid University, Ministry of Education, Kingdom of Saudi Arabia. We would like acknowledge to the Bangladesh Meteorological Department (BMD) and Institute of Epidemiology, Disease Control and Research (IEDCR) for providing data in this research work.
Disclosure statement
No potential conflict of interest was reported by the authors.
Correction Statement
This article has been corrected with minor changes. These changes do not impact the academic content of the article.
References
- Abdullah AYM, Bhuian MH, Kiselev G, Dewan A, Hassan QK, Rafiuddin M. 2022. Extreme temperature and rainfall events in Bangladesh: a comparison between coastal and inland areas. Intl J Climatol. 42(6):3253–3273.
- Adnan MSG, Dewan A, Zannat KE, Abdullah AYM. 2019. The use of watershed geomorphic data in flash flood susceptibility zoning: a case study of the Karnaphuli and Sangu River basins of Bangladesh. Nat Hazards. 99(1):425–448.
- Ahlawat A, Wiedensohler A, Mishra SK. 2020. An overview on the role of relative humidity in airborne transmission of sars-cov-2 in indoor environments. Aerosol Air Qual Res. 20(9):1856–1861.
- Alkhowailed MS, Rasheed Z, Shariq A, Elzainy A, El Sadik A, Alkhamiss A, Alsolai AM, Alduraibi SK, Alduraibi A, Alamro A, et al. 2020. Digitalization plan in medical education during COVID-19 lockdown. Inform Med Unlocked. 20:100432.
- Alsayed ARM. 2022. Association between coronavirus cases and seasonal climatic variables in Mediterranean European Region, evidence by panel data regression. Int J Environ Sci Technol (Tehran). 19(9):8265–8272.
- Ardiles AO, Grabrucker AM, Scholl FG, Rudenko G, Borsello T. 2017. Molecular and cellular mechanisms of synaptopathies. Neural Plast. 2017:2643943.
- Asyary A, Veruswati M. 2020. Sunlight exposure increased Covid-19 recovery rates: a study in the central pandemic area of Indonesia. Sci Total Environ. 729:139016.
- Auler AC, Cássaro FAM, da Silva VO, Pires LF. 2020. Evidence that high temperatures and intermediate relative humidity might favor the spread of COVID-19 in tropical climate: a case study for the most affected Brazilian cities. Sci Total Environ. 729:139090.
- Bashir MF, Ma B, Shahzad L. 2020. A brief review of socioeconomic and environmental impact of Covid-19. Air Qual Atmos Health. 13(12):1403–1409.
- BBS (Bangladesh Bureau of Statistics). 2015. Bangladesh Population and Housing Census 2011, Administrative Report. In Government of the People’S Republic of Bangladesh (Issue December).http://www.bbs.gov.bd/WebTestApplication/userfiles/Image/Census2011/Bangladesh_glance.pdf.
- Bodrud-Doza M, Shammi M, Bahlman L, Islam A, Rahman MM. 2020. Psychosocial and socio-economic crisis in Bangladesh due to COVID-19 pandemic: a perception-based assessment. Front Public Health. 8:341.
- Brassey J, Heneghan C, Mahtani KR, Aronson JK. 2020. Do weather conditions influence the transmission of the coronavirus (SARSCoV-2). https://www.cebm.net/COVID-19/doweather-conditions-influence-the-transmission-of-the-coronavirussars-cov-2/.
- Briz-Redón Á, Serrano-Aroca Á. 2020. The effect of climate on the spread of the COVID-19 pandemic: a review of findings, and statistical and modelling techniques. Prog Phys Geogr. 44(18):309133320946302.
- Buishand TA. 1982. Some methods for testing the homogeneity of rainfall records. J Hydrol. 58(1-2):11–27.
- Bukhari Q, Jameel Y. 2020. Will coronavirus pandemic diminish by summer? SSRN J. http://dx.doi.org/10.2139/ssrn.3556998
- Cai Q-C, Lu J, Xu QF, Guo Q, Xu DZ, Sun QW, Yang H, Zhao GM, Jiang QW. 2007. Influence of meteorological factors and air pollution on the outbreak of severe acute respiratory syndrome. Public Health. 121(4):258–265.
- Cao C, Chen W, Zheng S, Zhao J, Wang J, Cao W. 2016. Analysis of spatiotemporal characteristics of pandemic SARS spread in mainland China. Biomed Res Int. 2016:7247983.
- Casanova LM, Jeon S, Rutala WA, Weber DJ, Sobsey MD. 2010. Effects of air temperature and relative humidity on coronavirus survival on surfaces. Appl Environ Microbiol. 76(9):2712–2717.
- Chan KH, Peiris JSM, Lam SY, Poon LLM, Yuen KY, Seto WH. 2011. The effects of temperature and relative humidity on the viability of the SARS coronavirus. Adv Virol. 2011:734690.
- Chen B, Liang H, Yuan X, Hu Y, Xu M, Zhao Y, Zhang B, Tian F, Zhu X. 2020. Roles of meteorological conditions in COVID-19 transmission on a worldwide scale. MedRxiv.
- Chien LC, Chen LW. 2020. Meteorological impacts on the incidence of COVID-19 in the U.S. Stoch Environ Res Risk Assess. 34(10):1675–1680.
- Coccia M. 2020. Factors determining the diffusion of COVID-19 and suggested strategy to prevent future accelerated viral infectivity similar to COVID. Sci Total Environ. 729:138474.
- Coccia M. 2021. How do low wind speeds and high levels of air pollution support the spread of COVID-19? Atmos Pollut Res. 12(1):437–445.
- Cucinotta D, Vanelli M. 2020. WHO declares COVID-19 a pandemic. Acta Biomedica. 91(1):157–160.
- Dadbakhsh M, Khanjani N, Bahrampour A, Haghighi PS. 2017. Deaths from respiratory diseases and temperature in Shiraz, Iran (2006–2011). Int J Biometeorol. 61(2):239–246.
- Dai Q, Ma W, Huang H, Xu K, Qi X, Yu H, Deng F, Bao C, Huo X. 2018. The effect of ambient temperature on the activity of influenza and influenza like illness in Jiangsu Province, China. Sci Total Environ. 645(July):684–691.
- Das S, Islam ARMT. 2021. Assessment of mapping of annual average rainfall in a tropical country like Bangladesh: remotely sensed output vs. kriging estimate. Theor Appl Climatol. 146(1-2):111–123.
- Fallah GG, Mayvaneh F. 2016. Effect of air temperature and universal thermal climate index on respiratory diseases mortality in Mashhad, Iran. Arch Iran Med. 19(9):618–624.
- Fang Y, Nie Y, Penny M. 2020. Transmission dynamics of the COVID-19 outbreak and effectiveness of government interventions: a data-driven analysis. J Med Virol. 92(6):645–659.
- Ficetola GF, Rubolini D. 2021. Containment measures limit environmental effects on COVID-19 early outbreak dynamics. Sci Total Environ. 761:144432.
- Gautam S. 2020. COVID-19: air pollution remains low as people stay at home. Air Qual Atmos Health. 13(7):853–857.
- Ghose B, Islam ARMT, Islam HMT, Hasanuzzaman M, Huang J, Hu Z, Moniruzzaman M, Gustave W, Karim M, Ibrahim SI. 2021. Rain-fed rice yield fluctuation to climatic anomalies in Bangladesh. Int J Plant Prod. 15(2):183–201.
- Grinsted A, Moore JC, Jevrejeva S. 2004. Application of the cross wavelet transform and wavelet coherence to geophysical time series. Nonlin Processes Geophys. 11(5/6):561–566.
- Guan Y, Zheng B, He Y, Liu X, Zhuang Z, Cheung C, Luo S, Li P, Zhang L, Guan Y, et al. 2003. Isolation and characterization of viruses related to the SARS coronavirus from animals in southern China. Science 302(5643):276–278.
- Gurley K, Kareem A. 1999. Discussion. Eng Struct. 21(2):149–167.
- Gurley K, Asce M, Kijewski T, Asce S, Kareem A. 2003. First- and higher-order correlation detection using wavelet transforms. J Eng Mech. 129(2):188–201.
- Haque SE, Rahman M. 2020. Association between temperature, humidity, and COVID-19 outbreaks in Bangladesh. Environ Sci Policy. 114(July):253–255.
- Hossain MA, Jahid MIK, Hossain KMA, Walton LM, Uddin Z, Haque MO, Kabir MF, Arafat SMY, Sakel M, Faruqui R, et al. 2020. Knowledge attitudes and fear of COVID-19 during the rapid rise period in Bangladesh. PLoS ONE. 15(9):e0239646.
- Hridoy AEE, Mohiman MA, Tusher SMSH, Nowraj SZA, Rahman MA. 2021. Impact of meteorological parameters on COVID-19 transmission in Bangladesh: a spatiotemporal approach. Theor Appl Climatol. 144(1-2):273–285.
- IEDCR (Institute of Epidemiology, Disease Control and Research). 2021. COVID-19 Status Bangladesh. [accessed 202 Nov 130]. https://www.iedcr.gov.bd/.
- Iqbal N, Fareed Z, Shahzad F, He X, Shahzad U, Lina M. 2020. Nexus between COVID-19, temperature and exchange rate in Wuhan City: new findings from partial and multiple wavelet coherence. Sci Total Environ. 729:138916.
- Islam ARMT, Nabila IA. Hasanuzzaman M, Rahman MB, Elbeltagi A, Mallick J, Techato K, Rahman MM. 2022. Variability of climate-induced rice yields in northwest Bangladesh using multiple statistical modeling. Theor Appl Climatol. 147, 1263–1276.
- Islam ARMT, Shen S, Yang SB, Hu Z, Chu R. 2019. Assessing recent impacts of climate change on design water requirement of Boro rice season in Bangladesh. Theor Appl Climatol. 138(1-2):97–113.
- Islam ARMT, Hasanuzzaman M, Azad MAK, Salam R, Toshi FZ, Khan MSI, Alam GMM, Ibrahim SM. 2021. Effect of meteorological factors on COVID-19 cases in Bangladesh. Environ Dev Sustain. 23(6):9139–9162.
- Islam ARMT, Hasanuzzaman M, Shammi M, Salam R, Bodrud-Doza M, Rahman MM, Mannan MA, Huq S. 2021. Are meteorological factors enhancing COVID-19 transmission in Bangladesh? Novel findings from a compound Poisson generalized linear modeling approach. Environ Sci Pollut Res Int. 28(9):11245–11258.
- Islam ARMT, Islam HMT, Shahid S, Khatun MK, Ali MM, Rahman MS, Ibrahim SM, Almoajel AM. 2021. Spatiotemporal nexus between vegetation change and extreme climatic indices and their possible causes of change. J Environ Manage. 289:112505.
- Islam N, Bukhari Q, Jameel Y, Shabnam S, Erzurumluoglu AM, Siddique MA, Massaro JM, D'Agostino RB. 2021d. COVID-19 and climatic factors: a global analysis. Environ Res. 193:110355.
- Joshi YP, Kim E-H, Kim J-H, Kim H, Cheong H-K. 2016. Associations between meteorological factors and aseptic meningitis in six metropolitan provinces of the republic of Korea. IJERPH. 13(12):1193.
- Kamruzzaman M, Shahid S, Roy DK, Islam ARMT, Hwang S, Cho J, Zaman MAU, Sultana T, Rashid T, Akter F. 2022. Assessment of CMIP6 global climate models in reconstructing rainfall climatology of Bangladesh. Intl J Climatol. 42(7):3928–3953.
- Li H-L, Yang B-Y, Wang L-J, Liao K, Sun N, Liu Y-C, Ma R-F, Yang X-D. 2022. A meta-analysis result: uneven influences of season, geo-spatial scale and latitude on relationship between meteorological factors and the COVID-19 transmission. Environ Res. 212(Pt B):113297.
- Li Q, Guan X, Wu P, Wang X, Zhou L, Tong Y, Ren R, Leung KS, Lau EH, Wong JY, et al. 2020. Early transmission dynamics in Wuhan,China, of novel coronavirus–infected pneumonia. N Engl J Med. 382(13):1199–1207.
- Li Z, Zhang T. 2022. Analysis of a COVID-19 epidemic model with seasonality. Bull Math Biol. 84(12):146.
- Lin R, Wang X, Huang J. 2022. The influence of weather conditions on the COVID-19 epidemic: evidence from 279 prefecture-level panel data in China. Environ Res. 206:112272.
- Liu J, Zhou J, Yao J, Zhang X, Li L, Xu X, He X, Wang B, Fu S, Niu T, et al. 2020. Impact of meteorological factors on the COVID-19 transmission: a multi-city study in China. Sci Total Environ. 726:138513.
- Ma Y, Zhao Y, Liu J, He X, Wang B, Fu S, Yan J, Niu J, Zhou J, Luo B. 2020. Effects of temperature variation and humidity on the death of COVID-19 in Wuhan, China. Sci Total Environ. 724:138226.
- Mallick J, Islam ARMT, Ghose B, Islam HMT, Rana Y, Hu Z, Bhat SA, Pal SC, Ismail ZB. 2022. Spatiotemporal trends of temperature extremes in Bangladesh under changing climate using multi-statistical techniques. Theor Appl Climatol. 147(1-2):307–324.
- Mendez-Arriaga F. 2020. The temperature and regional climate effects on communitarian COVID-19 contagion in Mexico throughout phase 1. STOTEN 735:139560.
- Menebo MM. 2020. Temperature and precipitation associate with COVID-19 new daily cases: a correlation study between weather and Covid-19 pandemic in Oslo, Norway. Sci Total Environ. 737:139659.
- Meyer B, Zill A, Dilba D, Gerlach R, Schumann S. 2021. Employee psychological well-being during the COVID-19 pandemic in Germany: a longitudinal study of demands, resources, and exhaustion. Int J Psychol. 56(4):532–550.
- Ng EKW, Chan JCL. 2012. Geophysical applications of partial wavelet coherence and multiple wavelet coherence. J Atmospher Ocean Technol. 29(12):1845–1853.
- Pahuja S, Madan M, Mittal S, Pandey RM, Madan K, Mohan A, Hadda V, Tiwari P, Guleria, R, Nilima. 2021. Weather parameters and COVID-19: a correlational analysis. J Occupat Environ Med. 63(1):69–73.
- Pal M, Berhanu G, Desalegn C, Kandi V. 2020. Severe acute respiratory syndrome coronavirus-2 (SARS-CoV-2): an Update. Cureus 2(3):1–9.
- Pan K-Y, Kok AAL, Eikelenboom M, Horsfall M, Jörg F, Luteijn RA, Rhebergen D, Oppen P v, Giltay EJ, Penninx BWJH.,. 2021. The mental health impact of the COVID-19 pandemic on people with and without depressive, anxiety, or obsessive-compulsive disorders: a longitudinal study of three Dutch case-control cohorts. Lancet Psych. 8(2):121–129.
- Pani SK, Lin NH, Ravindra Babu S. 2020. Association of COVID-19 pandemic with meteorological parameters over Singapore. Sci Total Environ. 740:140112.
- Paraskevis D, Kostaki EG, Magiorkinis G, Panayiotakopoulos G, Sourvinos G, Tsiodras S.,. 2020. Full-genome evolutionary analysis of the novel corona virus (2019-nCoV) rejects the hypothesis of emergence as a result of a recent recombination event. Infect Genet Evol. 79:104212.
- Park YJ, Choe YJ, Park O, Park SY, Kim Y-M, Kim J, Kweon S, Woo Y, Gwack J, Kim SS, et al. 2020. Contact tracing during coronavirus disease outbreak, South Korea, 2020. Emerg Infect Dis. 26(10):2465–2468.
- Polgreen PM, Polgreen EL. 2018. Infectious diseases, weather, and climate. Clin Infect Dis. 66(6):815–817.
- Pramanik, et al. 2020. Climatic influence on the magnitude of COVID-19 outbreak: a stochastic model-based global analysis. medrxiv.
- Qi M, Li P, Moyle W, Weeks B, Jones C. 2020. Physical activity, health-related quality of life, and stress among the Chinese adult population during the COVID-19 pandemic. IJERPH. 17(18):6494.
- Rahimi NR, Fouladi-Fard R, Aali R, Shahryari A, Rezaali M, Ghafouri Y, Ghalhari MR, Asadi-Ghalhari M, Farzinnia B, Conti Gea O, et al. 2021. Bidirectional association between COVID-19 and the environment: a systematic review. Environ Res. 194:110692.
- Rahman MM, Bodrud-Doza M, Siddiqua MT, Zahid A, Islam ARMT. 2020. Spatiotemporal distribution of fluoride in drinking water and associated probabilistic human health risk appraisal in the coastal region, Bangladesh. Sci Total Environ. 724:138316.
- Rahman MS, Azad MAK, Hasanuzzaman M, Salam R, Islam ARMT, Rahman MM, Hoque MMM. 2021. How air quality and COVID-19 transmission change under different lockdown scenarios? A case from Dhaka city, Bangladesh. Sci Total Environ. 762:143161.
- Rahman MS, Islam A. 2019. Are precipitation concentration and intensity changing in Bangladesh overtimes? Analysis of the possible causes of changes in precipitation systems. Sci Total Environ. 690:370–387.
- Rendana M. 2020. Impact of the wind conditions on COVID-19 pandemic: A new insight for direction of the spread of the virus. Urban Clim. 34(July):100680.
- Rosario DKA, Mutz YS, Bernardes PC, Conte-Junior CA. 2020. Relationship between COVID-19 and weather: case study in a tropical country. Int J Hyg Environ Health. 229:113587.
- Sahin U, Muik A, Derhovanessian E, Vogler I, Kranz LM, Vormehr M, Baum A, Pascal K, Quandt J, Maurus D, et al. 2020. COVID-19 vaccine BNT162b1 elicits human antibody and TH1 T cell responses. Nature 586(7830):594–599.
- SarkerMAR, Alam K, Gow J. 2017. Performance of rain-fed Aman rice yield in Bangladesh in the presence of climate change. Renewable Agriculture and Food System.
- Sarkodie SA, Owusu PA. 2020. Impact of meteorological factors on COVID-19 pandemic: evidence from top 20 countries with confirmed cases. Environ Res. 191:110101.
- Shahid S. 2010. Recent trends in the climate of Bangladesh. Clim Res. 42(3):185–193.
- Shammi M, Bodrud-Doza M, Islam A, Rahman MM. 2020. COVID-19 pandemic,socioeconomic crisis and human stress in resource-limited settings: a case from Bangladesh. Heliyon. 6(5):e04063.
- Shi P, Dong Y, Yan H, Li X, Zhao C, Liu W, He M, Tang S, Xi S. 2020. The impact of temperature and absolute humidity on thecoronavirus disease 2019 (COVID-19) outbreak – evidence from China. https://doi.org/10.1101/2020.03.22.20038919
- Shi P, Dong Y, Yan H, Zhao C, Li X, Liu W, He M, Tang S, Xi S. 2020. Impact of temperature on the dynamics of the COVID-19 outbreak in China. Sci Total Environ. 728(77):138890.
- Sleziak P, Hlavčová K, Szolgay J. 2015. Advantages of a time series analysis using wavelet transform as compared with a fourier analysis. Slovak J Civil Eng. 23(2):30–36.
- Song P, Han H, Feng H, Hui Y, Zhou T, Meng W, Yan J, Li J, Fang Y, Liu P, et al. 2022. High altitude relieves transmission risks of COVID-19 through meteorological and environmental factors: evidence from China. Environ Res. 212(Pt B):113214.
- Tan J, Mu L, Huang J, Yu S, Chen B, Yin J. 2005. An initial investigation of the association between the SARS outbreak and weather: with the view of the environmental temperature and its variation. J Epidemiol Community Health. 59(3):186–192.
- Tantrakarnapa K, Bhopdhornangkul B. 2020. Challenging the spread of COVID-19 in Thailand. One Health. 11:100173.
- Thu TPB, Ngoc PNH, Hai NM, Tuan LA. 2020. Effect of the social distancing measures on the spread of COVID-19 in 10 highly infected countries. Sci Total Environ. 742:140430. doi:
- Tobías A, Molina T. 2020. Is temperature reducing the transmission of COVID-19? Environ Res. 186:109553.
- Torrence C, Compo GP. 1998. A practical guide to wavelet analysis. Bull Amer Meteor Soc. 79(1):61–78.
- Tosepu R, Gunawan J, Effendy DS, Ahmad LOAI, Lestari H, Bahar H, Asfian P. 2020. Correlation between weather and Covid-19 pandemic in Jakarta. Indonesia. Sci Total Environ. 725:138436.
- Ver Hoef JM, Boveng PL. 2007. Quasi-Poisson vs. negative binomial regression: how should we model overdispersed count data? Ecology 88(11):2766–2772.
- Wang M, Jiang A, Gong L, Luo L, Guo W, Li C, Zheng J, Li C, Yang B, Zeng J, et al. 2020. Temperature significant change COVID-19 Transmission in 429 cities. MedRxiv.
- Weiss A, Jellingso M, Sommer MOA. 2020. Spatial and temporal dynamics of SARSCoV-2 in COVID-19 patients: a systematic review and meta-analysis. EBioMedicine. 58:102916.
- WHO. 2020. Situation report—51. [accessed 2020 Aug 04]. https://www.who.int/emergencies/diseases/novel-coronavirus-2019/situation-reports.
- Wu Y, Jing W, Liu J, Ma Q, Yuan J, Wang Y, Du M, Liu M. 2020. Effects of temperature and humidity on the daily new cases and new deaths of COVID-19 in 166 countries. Sci Total Environ. 729:139051.
- Xie J, Zhu Y. 2020. Association between ambient temperature and COVID-19 infection in 122 cities from China. Sci Total Environ. 724:138201.
- Yin C, Zhao W, Pereira P. 2022. Meteorological factors’ effects on COVID-19 show seasonality and spatiality in Brazil. Environ Res. 208:112690.
- Zambrano-Monserrate MA, Ruano MA, Sanchez-Alcalde L. 2020. Indirect effects of COVID-19 on the environment. Sci Total Environ. 728:138813.
- Zhou P, Yang X-L, Wang X-G, Hu B, Zhang L, Zhang W, Si H-R, Zhu Y, Li B, Huang C-L, et al. 2020. A pneumonia outbreak associated with a new coronavirus of probable bat origin. Nature 579(7798):270–273.
- Zhu N, Zhang D, Wang W, Li X, Yang B, Song J, Zhao X, Huang B, Shi W, Lu R, et al. 2020. A novel coronavirus from patients with pneumonia in China, 2019. N Engl J Med. 382(8):727–733.
- Zoran MA, Savastru RS, Savastru DM, Tautan MN. 2022a. Impacts of exposure to air pollution, radon and climate drivers on the COVID-19 pandemic in Bucharest, Romania: A time series study. Environ Res. 212(Pt D):113437–113410.
- Zoran MA, Savastru RS, Savastru DM, Tautan MN. 2022b. Cumulative effects of air pollution and climate drivers on COVID-19 multiwaves in Bucharest, Romania. Process Saf Environ Prot. 166:368–383.
- Zoran M, Savastru R, Savastru D, Tautan M, Baschir L, Tenciu D. 2021. Exploring the linkage between seasonality of environmental factors and COVID-19 waves in Madrid, Spain. Process Saf Environ Prot. 152:583–600.