
 ?Mathematical formulae have been encoded as MathML and are displayed in this HTML version using MathJax in order to improve their display. Uncheck the box to turn MathJax off. This feature requires Javascript. Click on a formula to zoom.
Abstract
The majority of people living on earth rely on groundwater as their primary supply of water for daily needs. However, human activities continuously threaten this natural resource. In an attempt to unravel the extent of the impact of human-related activities on groundwater physicochemical characteristics in Nnewi and Awka urban clusters (Nigeria), several techniques were integrated in this study. Groundwater samples were warm and acidic in nature. Concentrations of SO42-, NO3-, PO43-, Cl-, HCO3-, Ca2+, Mg2+, Na+ and K+ were within set benchmarks. The water nutrient pollution index (ranging from 0.060 to 0.745), nitrate pollution index (varying between −0.999 and −0.790) and water pollution index (ranging from 0.057 to 0.630) estimated the extent of anthropogenic contamination and showed low anthropogenic impact on the groundwater physicochemical characteristics. The health risks due to the ingestion and skin absorption of the nitrate-contaminated water computed for six age groups (6–12 months, 5–10 years, 10–15 years, 15–20 years, 20–60 years and >60 years) showed health risk values that were < 1, implying low chronic health risks to humans. The cumulative total health hazard index ranged between 0.006 and 0.787 with a mean value of 0.167. Chemometric analyses and geochemical plots revealed the relationships between the variables and contamination sources. Chadha’s plot showed that 55% of the samples were Ca2+-Mg2+-Cl- waters, predominating over Na+-Cl- and Ca2+-Mg2+-HCO3- waters. Bivariate and multivariate geochemical plots also indicated low anthropogenic impact. Furthermore, principal component analysis and R-type hierarchical clustering confirmed that the groundwater chemistry and quality were mostly influenced by geogenic processes than human-related acts. Conclusively, the extent of anthropogenic influence on groundwater physicochemical characteristics is low. These findings would be useful in future monitoring of groundwater in both urban clusters.
1. Introduction
The vast majority of urbanizations on earth are closely related to water resources. However, the activities of humans, such as waste generation and poor management strategies, threaten natural water resources. The increase in the population of humans in most urban and rural areas has led to an equivalent rise in the amount of waste generated daily by residential, commercial and industrial activities (Egbueri Citation2018; Ozoko et al. Citation2022). Contrary to the majority of developed nations, the majority of developing nations dispose of waste indiscriminately around residential areas, marketplaces, farmlands, roadside ditches and open dumpsites (Ozoko et al. Citation2022). Numerous anthropogenic activities, including industrialization, mining, extensive use of potentially dangerous chemicals in agriculture, inefficient land use, unsanitary conditions and overuse of water, have a negative impact on groundwater quality and, as a result, human health (Onyemesili et al. Citation2022; Singh et al. Citation2022; Egbueri and Enyigwe Citation2020; Egbueri Citation2018, Citation2020a, Citation2020b; Mukherjee et al. Citation2021; Pal et al. Citation2022). Life quality is influenced by water and access to freshwater is essential for maintaining the general public’s health and the welfare of society. Physical, chemical and biological factors that are helpful in monitoring or assessing the water quality for a given purpose are dependent on the water quality of a specific source and locality. The measured values of the physicochemical and biological factors could be dangerous to human health if they fall too far short of the standards or exceed the acceptable limitations (Mukate et al. Citation2019; Mukherjee and Singh Citation2022a; Pal et al. Citation2022). Therefore, understanding groundwater’s chemistry and quality is essential for determining if it is suitable for drinking, irrigation and industrial purposes (Egbueri Citation2021; Subba Rao et al. Citation2021; Mukherjee and Singh Citation2022b). For analysing the water quality and contamination processes for these various uses, established procedures and distinct criteria are frequently followed (Thakur et al. Citation2018; Ako et al. Citation2009; Agbasi et al. Citation2023). It is only when the pollution status is well known that effective mitigation strategies can be developed (Egbueri et al. Citation2022a; Mukherjee et al. Citation2021).
A major environmental problem on a global scale is groundwater contamination. Using low-quality water frequently leads to the development of several waterborne illnesses (Onyemesili et al. Citation2022; Egbueri Citation2020b; Ako et al. Citation2009; Mukherjee and Singh Citation2018; Biswas et al. Citation2023). In light of its implications on health, the general population is now more aware of the importance of safe drinking groundwater. Groundwater pollution is extremely complicated and frequently challenging to detect (Shrestha et al. Citation2016). Data-driven methods have been adopted by researchers to study the impact of natural and human-induced processes on water quality (Ruidas et al. Citation2021, Citation2023; Agbasi and Egbueri Citation2023). But in order to assess the quality of groundwater, which is notably impacted by a number of natural geological and geochemical processes as well as anthropogenic activities, physical and chemical parameters have historically served as the functional guides (Verma et al. Citation2020; Naik et al. Citation2022; Egbueri and Agbasi Citation2022a, Citation2022b). In contrast to surface water, it is more challenging to restore polluted groundwater (Rahmati et al. Citation2015). Some physicochemical characteristics, excluding heavy metals, have been utilized to determine the roles and extent of human-related impacts on groundwater contamination and pollution. For instance, some of the most commonly used are pH, fluoride (F-), chloride (Cl-), phosphate (PO43-), potassium (K+) and nitrate (NO3-). Among the listed parameters, Cl-, F- and NO3- have been mostly used to unravel the contributions of anthropogenic inputs in water pollution (Mukherjee and Singh Citation2018; Jaydhar et al. Citation2022; Unigwe et al. Citation2022; Pal et al. Citation2022; Biswas et al. Citation2023). In this study, special emphasis is laid on NO3. Nitrogen is a nutrient required for improving crop productivity and plant growth and can be found in groundwater in the various forms of ammonium, nitrite or nitrate. However, overuse of N-rich fertilizers in farming might raise the danger of water pollution. Several studies have demonstrated that the nitrate component of water contamination can come from both point sources (e.g. industrial pollution and intense animal husbandry) and non-point sources (e.g. agricultural runoffs have loads of fungicides and fertilizers, etc.). For example, research by Rahmati et al. (Citation2015) revealed a favourable correlation between the quantity of nitrogen fertilizers used in a region and the nitrate concentration in groundwater. Babiker et al. (Citation2004) conducted research on nitrate contamination and discovered that the extensive use of chemical fertilizers on a farmland where vegetables were grown greatly increased the nitrate level in groundwater. Several other recent studies have reported similar correlations, not only to the use of fertilizers but also to other human-induced processes and activities (Balamurugan et al. Citation2020a; Abugu et al. Citation2021; Agbasi and Egbueri Citation2022; Ayejoto et al. Citation2022b; Unigwe et al. Citation2022). Factually, hundreds of tons of nitrogen are unnoticeably released into the air, soil and water systems by a variety of man-made processes, including farming, the use of smokestacks and automobile emissions, on a daily basis (Ramalingam et al. Citation2022). Studies have also been conducted across the globe to predict the concentration of NO3 in water resources using data-driven methods (Pal et al. Citation2022; Egbueri Citation2023).
Nitrate contamination also leads to poor and degraded ecosystem, which may have a negative impact on the health of humans and the environment. In Nigeria, the majority of urban and rural residents highly rely on groundwater for domestic, industrial, agricultural and drinking needs. Communities, the general public and animals are now seriously impacted by the effects of groundwater contamination. When it comes to toxins, NO3 pollution is the most severe environmental issue (Ramalingam et al. Citation2022). In light of an ecosystem that has been negatively impacted by nitrates, excess nitrate may be responsible for water pollution, decreased biodiversity and the extinction of some species of plants (Balamurugan and Kumar Citation2016). Nitrate in water is consumed continuously, and when in excess amounts, results in significant illnesses in children such as blue-baby syndrome (also known as methemoglobinemia) and defects in foetal formation in adults (Balamurugan et al. Citation2020b; Karunanidhi et al. Citation2019; Unigwe et al. Citation2022; Mukherjee and Singh Citation2021; Egbueri Citation2023). In view of the potential health effects of nitrate in water, some indexical methods, such as the nitrate pollution index (NPI) (Obeidat et al. 2012; Ramalingam et al. Citation2022), have been utilized to evaluate the extent of nitrate contamination in water resources. Applying the right indices is a quick and easy way to learn about water quality for a particular usage. Also, numerous studies conducted in different regions of the world computed the deterministic nitrate health risks for different exposure pathways and for different ages (Kumar et al. Citation2014; Soomro et al. Citation2017; Gutierrez et al. Citation2018; Zhang et al. Citation2020; Panneerselvam et al. Citation2020a, Citation2020b; Mukherjee and Singh Citation2021; Unigwe et al. Citation2022). In India, Mukherjee and Singh (Citation2021) characterized the exposure of nitrate in groundwater by utilizing Monte Carlo kriging and Sobol sensitivity indexing. However, most studies on nitrate human health risk exposures have only considered three human populations (children, males and females). There is paucity of literatures that determined nitrate health risks for more than three human populations. Interestingly, a recent study conducted by Ramalingam et al. (Citation2022) assessed the risk of nitrate contamination for six age groups. With broader scope, their deterministic health risk assessment provided a more comprehensive and robust details that could foster great insights for more effective natural water resources management and pollution mitigation.
In the study region, there have been increases in human population growth, agriculture, urbanization and commercial activities. Unfortunately, studies that have investigated water resources with special emphasis on nutrient and nitrate pollution are scarce. However, Unigwe et al. (Citation2022) recently studied the human health risks due to nitrate contamination in groundwater in the Ogbaru agricultural province. Their studies focussed on three human population categories and also suggested that children inhabiting the area were more exposed to the risk than the female and male populations. Nevertheless, no such study has been documented for Awka and Nnewi urban areas in Southeast Nigeria. Also, no study has investigated the health risk due to nitrate contamination for six age groups in Nigeria. Some previous studies in the area were focussed on heavy metals, their risks and source apportionment (Onyemesili et al. Citation2022; Okoye et al. Citation2016; Onunkwo et al. Citation2014; Agu et al. Citation2014). Therefore, in this study, the impact of anthropogenic activities on natural groundwater resources was investigated with respect to the water nutrient pollution index (WNPI), nitrate pollution index (NPI), water pollution index (WPI) and nitrate health risk assessment for six human populations. Additionally, the sources of contamination were investigated using chemometric analyses and geochemical plots. The specific objectives of the present study include (1) to evaluate the extent of NO3-, PO43- and K+ contaminations due to human-related activities based on WNPI and NPI; (2) to identify the relationships between analysed physicochemical variables and contamination sources based on chemometric analyses and geochemical plotting; (3) to determine the suitability of the groundwater for human consumption based on WPI; and (4) to determine the health risks due to the ingestion and absorption of nitrate-contaminated water for six age groups (6–12 months, 5–10 years, 10–15 years, 15–20 years, 20–60 years and >60 years). A study of the literature indicates that different age brackets are usually exposed to water pollutants at varying risk levels. Additionally, it has been learned that the amount of information provided to policymakers and inhabitants always depends on the number of age groups considered in each evaluation. Thus, this study would give a more versatile and simplified risk assessment that will adapt dual exposure routes and also take into perspective the age effects of the exposed human populations.
2. Materials and methods
2.1. Description of the areas under study
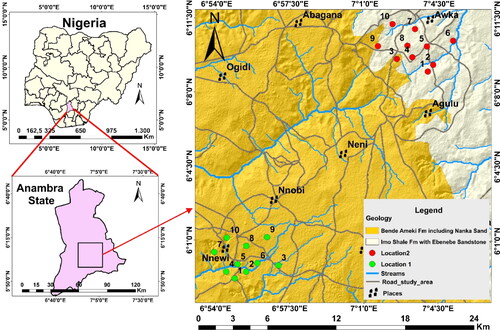
The Awka and Nnewi urbans are the two largest cities in Anambra State, located in southeast Nigeria. They are located between latitudes 5° 58′ and 6° 12′ north of the equator and between longitudes 6° 53′ and 7° 07′ east (). With an average elevation above the sea level of roughly 60 m and 70 m, respectively, these places are topographically distinguished by sporadic lowlands and valleys with a few undulating hills (Omeka and Egbueri Citation2023). The topography is assumed to alter the region’s drainage pattern, with the streams showing dendritic drainage patterns and feeding into the Niger River through tributaries (). The vegetation and climate are typical of Nigeria’s tropical rainforest, with two unusual weather patterns predominating: the wet season, which lasts from April to November and has an average annual rainfall of 2000–3000 mm and the dry season, which lasts from November to February and is accompanied by dry, dusty winds (Onyido et al. Citation2014; Egbueri Citation2018). Both regions have rather mild temperatures (between 22 °C and 32 °C) and high relative humidity levels (between 68 and 79%) (Onyido et al. Citation2014). The natural vegetation cover has been greatly altered or eliminated in some parts as a result of the boom in urbanization and industrialization in the two cities, leaving the lands exposed to intense rainfall. The high flow regime and infiltration capacity can be enhanced by the high intensity of the rainfall (Omeka and Egbueri Citation2023). By infiltration, contaminants could get into the aquifer layers. Similar to this, heavy rainfall can hasten the movement of pollutants from non-point sources that are situated on land into neighbouring streams, where they may eventually recharge and enter the groundwater aquifer (Omeka and Egbueri Citation2023).
Figure 1. Maps showing the location of the metropolises and their underlying geologic formations.
The State’s capital, Awka, has a limited number of commercial operations, whereas Nnewi is the region’s second industrial and commercial centre (after Onitsha) and is well-known for producing and marketing food and beverages, petrochemicals, automobiles and their spare parts. Both cities are populated heavily, with more than 300,000 people living there. Due to its greater economic and industrial activity, Nnewi is believed to be more populated than Awka, with a stunning population of over 388,397 and a population density of about 2,233/km2 spanning an area of about 173.9 km2. According to Moran et al. (Citation2018) and the Centre for International Earth Science Network (CIESIN Citation2004), the Awka area has about 206,484 residents and a population density of 1,213/km2. Between the ages of 1 and 5 in the Awka area, there are about 11,228 males and 10,793 females, while between the ages of 5 and 9, there are 11,589 males and 10,783 females (female) (CIESIN Citation2004). According to the CIESIN, the adult population between the ages of 20 and 24 is made up of 13,189 men and 13,443 women, while the adult population between the ages of 54 and 49 is made up of 4490 men and 3715 women (2004). The dense population records of the urban areas correlate with the high volumes of waste generated in the study area. Thus, there could be a significant impact human activities leave on groundwater resources.
Geologically, the Paleocene Imo Formation (also known as Imo Shale) and the Eocene Nanka Formation (of the Ameki Group) underlie the study areas (). Sands that have not been properly cemented and lithified and low permeability mudrocks intercalated are characteristic lithologies of the Imo Formation (Nwajide Citation2013; Omeka and Egbueri Citation2023). A sedimentological investigation of the outcropping sections of the Eocene Nanka Formation of the Ameki Group revealed that fine to coarse-grained and cross-bedded sandstone units that have clay-drapes and some mudstone make up the formation and that the sediments of the formation are mineralogically mature but texturally sub-mature (Ogbe and Osokpor Citation2021). Moreover, with a little proportion of rock fragments, the sediments are mainly recycled quartz grains that are sub-angular to sub-rounded (Ogbe and Osokpor Citation2021). The Nanka Formation is distinguished by units of friable and very porous sandstone. Groundwater aquifers covered by mudrock lithologies will be less susceptible to contamination because of their limited permeability. The reason for this is because the mudrocks’ limited permeability will act as ionic exchange sites, which will slow the migration of impurities (pollutants) into the aquifer system. On the other hand, the sandstone unit-underlain localities would be more susceptible due to high infiltration processes, raising their risk of pollution (Omeka and Egbueri Citation2023). According to a study conducted by Nfor et al. (Citation2007) comparing the hydrogeological features of Anambra State (including the two urban localities), the depth to the water table and static water level in the Nnewi urban are around 110 m and 120 m, respectively, on average. Lower values were found in the Awka region, where the mean static water level was about 40 m and the depth to the water table varied from 16 m to 35 m. The likelihood of contaminants entering the groundwater system near the city of Awka at this depth seems to be higher.
2.2. Groundwater sampling and physicochemical characterization
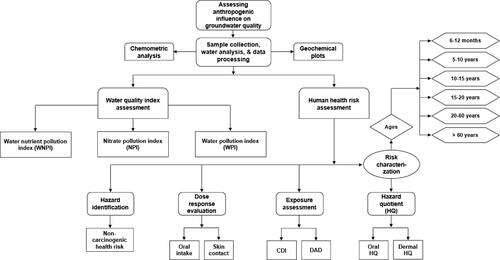
A simplified methodological flowchart for this investigation is shown in . Twenty groundwater sources (boreholes) throughout the two urban areas were sampled using 1 L bottles sanitized with diluted HCl. Before being submitted to the lab for physicochemical investigation, the collected groundwaters were kept in an ice-filled container to keep them refrigerated and prevent any reactivity or algal activity. Source water was used to rinse the sterilized sampling bottles prior to each collection. The locations’ coordinates were noted using GARMIN GPSMAP 78S. For this water quality evaluation, twelve (12) physicochemical variables—pH, temperature (T), electrical conductivity (EC), NO3-, PO43-, K+, Na+, Cl-, HCO3-, SO42-, Mg2+ and Ca2+—that were tested in the samples were used. Groundwater pH was assessed on-site using a Testr-2 pH metre. With the aid of a portable analysis tool (portable HM Digital COM-100), the T and EC were evaluated. In an attempt to ensure quality assurance and quality control (QA/QC) in all cases, standard practices and procedures were carefully followed for the laboratory analysis of the chemical ions in accordance with the American Public Health Association (APHA Citation2005, Citation2012) recommendations. It is also worth stating that APHA (Citation2012)-recommended precautions were taken during the water sampling exercise, sample transportation and storage, prior to the laboratory analysis. The reliability of the chemical results was confirmed for each sample by utilizing ionic charge balance error (ICBE). The ICBE was found to be low and within the ±5% acceptable limit.
Figure 2. A methodology flowchart depicting the study components and steps.
2.3. Contamination status assessment using water quality indices
2.3.1. Nitrate pollution index
As is well-know, one of the most frequent contaminants that are introduced by humans into surface water and groundwater resources is nitrate. Evaluating its effects on human health and the substantial level of contamination in groundwater is a major issue globally (Obeidat et al. 2012; Panneerselvam et al. Citation2020b; Ramalingam et al. Citation2022). NPI is a useful indexical method for assessing the degree of groundwater nitrate pollution. As has been reported in the literature (Obeidat et al. 2012; Ramalingam et al. Citation2022), nitrate in groundwater has a maximum acceptable threshold (benchmark) value of 20 mg/L. The term ‘NO3-polluted groundwater’ refers to a concentration that is higher than this threshold value. To calculate the NPI of the analysed groundwater resources, EquationEquation (1)(1)
(1) was utilized.
(1)
(1)
where
represents the benchmark value of NO3 due to anthropogenic inputs and CN is the concentration of NO3 in the groundwater samples (Obeidat et al. 2012; Ramalingam et al. Citation2022).
2.3.2. Water nutrient pollution index
The water nutrient pollution index (WNPI) is a crucial method for assessing the level of nutrient contamination in drinking water. A previous study conducted by Tokatli (Citation2021) calculated the nutrient pollution index for groundwater samples in Turkey. However, Isiuku and Enyoh (Citation2020) calculated nutrient pollution index for major surface water bodies in Southeast Nigeria using subsurface water samples. In this study, the WNPI was calculated to ascertain the impact of the use of NPK fertilizers and indiscriminate disposal of organic wastes on groundwater in the study area. It is believed that surface waters, which are usually the first to receive contaminants from runoffs, are in regular interactions with groundwater systems. Studies from different regions of the world have also identified the use of NPK fertilizers and organic wastes as a major source of nutrient pollution in groundwater systems (Babiker et al. Citation2004; Khandare Citation2013; Aschebrook-Kilfoy et al. Citation2012; Rahmati et al. Citation2015; Gutierrez et al. Citation2018; Egbueri Citation2019; Shalev et al. Citation2015; Ramalingam et al. Citation2022). The WNPI formula reported by Tokatli (Citation2021) and Isiuku and Enyoh (Citation2020) considered only NO3 and PO4. However, in this research study, NO3, PO4 and K (representing the NPK) were utilized for the computation of the WNPI (see Equation [2]).
(2)
(2)
where CN, CP and CK are the concentrations levels of NO3, PO4 and K detected in the groundwater resources. MACN, MACP and MACK are the permissible limits of NO3, PO4 and K specified by WHO (World Health Organization) (Citation2017). The WNPI was used to classify the extent of nutrients in the natural water resources as follows: WNPI < 1 (Not polluted), WNPI = 1–2 (Moderately polluted), WNPI = 3–6 (Considerably polluted) and WNPI >6 (Very highly polluted). With respect to the classes, human health risks increase from not polluted water to very highly polluted water. In other words, the higher the nutrient pollution level, the higher the health risks.
2.3.3. Water pollution index
Hossain and Patra (Citation2020) established the water pollution index (WPI) using nineteen input parameters. This model is easier to calculate and more versatile than many current indexical approaches. Standard allowable concentration (Si) and observed concentration (Ci) are the main factors used to determine the quality of water. The WPI was created to support an infinite number of input parameters, enabling an in-depth study of water quality. Based on seventeen input factors, this model has been used to calculate the effect of COVID-19 on India’s water quality (Chakraborty et al. Citation2021). Recently, Ravindra et al. (Citation2022) assessed groundwater pollution levels in Andhra Pradesh using the WPI model based on twelve input parameters. In Nigeria, Agbasi et al. (Citation2023) and Agbasi and Egbueri (Citation2023) utilized varied parameter sizes in calculating the WPI of water resources. In the present research, the WPI model was integrated for the analysis of the effects of anthropogenic activities on the groundwater quality of the area under study. Eleven input parameters (pH, EC, NO3-, PO43-, K+, Na+, Cl-, HCO3-, SO42-, Mg2+ and Ca2+) were utilized in this case. Temperature (T) was excluded from the WPI computation because it is known to be ambient and has no standard limit. The WPI calculation does not require weight assignment to input variables. By doing this, the bias brought on by indices that need to be weighted is removed. The following procedures were implemented in order to apply the WPI model:
Step 1
The mathematical expression given in EquationEquation (3)(3)
(3) was used to compute the PLi representing the pollution load of the ith parameter.
(3)
(3)
where Si the ith parameter’s standard allowable limit and Ci denotes the ith parameter’s concentration. The study adhered to the WHO (World Health Organization) (Citation2017)-approved permitted limits for water quality variables.
It is advised to use a different approach to calculate PLi of the pH, if the pH value is between 7 and above. EquationEquation (4)(4)
(4) is advised if the pH is less than 7.
(4)
(4)
where Sia represents the minimum WHO-permitted pH score, given as 6.5.
The suggested equation is presented in EquationEquation (5)(5)
(5) , if the pH is greater than 7.
(5)
(5)
where Sib represents the maximum WHO-permitted pH score, given as 8.5.
Step 2
The sum of the obtained PLi scores from all variables was divided by n number of variables to determine the final WPI (Equation [6]). A parameter should be removed from the sample’s total number of variables (n) if its measured concentration in the sample is zero.
(6)
(6)
With respect to the WPI, four classification categories are obtainable: excellent water (has WPI < 0.50), good water (has 0.75 > WPI ≥ 0.50), moderately contaminated water (has 1.00 ≥ WPI ≥ 0.75) and extremely polluted water (has WPI >1) (Hossain and Patra Citation2020; Agbasi et al. Citation2023; Agbasi and Egbueri Citation2023).
2.4. Contamination status assessment using nitrate health risk analysis
Assessment of the risk to human health as a result of excessive chemical concentrations in groundwater is an important method for estimating the influence human activities have on groundwater and the possible consequent impact the contaminated water has on humans. Through a variety of exposures, including oral (direct ingestion) and skin contact (cutaneous absorption), drinking contaminated water can seriously harm people’s health. Both oral and skin contact routes could expose a higher percentage of the human populations in the research area to risks associated with nitrate-contaminated water. In order to analyse the health risk, the United States Environmental Protection Agency (USEPA Citation2014, Citation2006) suggested four steps: hazard identification, dosage response evaluation, exposure assessment and risk characterization. These steps and their sub-steps are illustrated in the study flowchart (). To assess the dosages obtained via particular pathways, the chronic daily intake (CDI) and dermally absorbed dose (DAD) were computed (Equations [7] and [8]). The components of EquationEquations (7)(7)
(7) and Equation(8)
(8)
(8) are defined in .
(7)
(7)
(8)
(8)
Table 1. Nitrate health risk parameters and their values for the various age groups (Ramalingam et al. Citation2022).
Using the following EquationEquations (9)(9)
(9) and Equation(10)
(10)
(10) , the hazard quotient (HQ) scores for oral and dermal exposures for the assessment of the health risks associated with nitrate were calculated. CDI stands for chronic daily intake (mg/kg per day), DAD for dermally absorbed dose (mg/kg per day) and RfD for reference dose (1.6 mg/kg per day) (USEPA Citation2014, Citation2006; Unigwe et al. Citation2022; Ramalingam et al. Citation2022; Mukherjee and Singh Citation2020; Mukherjee et al. Citation2019, Citation2020; Egbueri Citation2023). EquationEquations (11)
(11)
(11) and Equation(12)
(12)
(12) were used to calculate the health hazard index (HI) for the different exposure pathways for all groundwater locations within the study region. The total health hazard index (THI) is the result of adding the oral and dermal HQs for each age group (Equation [13]). A value of more than 1 indicates a considerable risk, while a value of less than 1 indicates no significant danger of non-carcinogenic risk to human health (). Cumulative THI values were also computed in this study by simple summation of the THI values for the six age groups (Equation [14]). This approach attempts to present a wholistic picture of nitrate health risk in the study area.
(9)
(9)
(10)
(10)
(11)
(11)
(12)
(12)
(13)
(13)
(14)
(14)
2.5. Contamination source assessment using geochemical plots
Chadha (Citation1999)’s plot was the main plot used in this research study to investigate the geochemical associations and influencers of the groundwater composition. The hydrogeochemical visual depiction that the Chadha (Citation1999) diagram suggests often identifies the primary controlling influencers of groundwater quality and chemistry. Additionally, other bivariate geochemical plots of the physicochemical variables were integrated to further explore the geochemical associations and their natural versus anthropogenic implications. Several studies have shown that geochemical plots are very useful in unravelling the hydrogeochemical evolution of water (Mgbenu and Egbueri Citation2019; Saha et al. Citation2022; Ruidas et al. Citation2022c).
2.6. Contamination source assessment using chemometric analysis
Multivariate chemometric techniques, specifically principal component analysis (PCA) and hierarchical cluster analysis (R-mode HCA), were utilized in the present study to investigate the interrelationships of the physicochemical characteristics of the groundwater resources and the possible sources of contamination and influencers of the water chemistry. The Statistical Package for Social Sciences (SPSS v. 22) and Excel software (v. 2016) were employed for the current statistical analyses, data calculation and bivariate/multi-variate geochemical plotting.
2.6.1. Principal component analysis
To evaluate the potential impacts on water chemistry, a statistical computing technique called PCA was used to identify the implicit connections from the variety of water quality variables (Simeonov et al. Citation2003; Egbueri Citation2018). The correlation matrix between a chemical parameter and the data matrix was used to standardize the data matrix prior to the PCA to ensure that all variables were treated equally and that no parameter with larger absolute scores dominated the principal component extractions (Onyemesili et al. Citation2022; Simeonov et al. Citation2004). The adequacy of the sample size for the PCA was tested using the Kaiser-Meyer-Olkin (KMO) index. The KMO index was 0.571, which confirmed that the sampling was adequate for the analysis. The principal components (PCs) were extracted in a sequentially organized manner with decreasing contributions to variances in the water chemistry. For example, the first principal component (PC 1) significantly contributes to variations in the initial results and subsequent PCs account for decreasing proportions of water chemistry variances (Vieira et al. Citation2012; Egbueri and Agbasi Citation2022a).
2.6.2. Hierarchical cluster analysis
The multivariate technique of objectively grouping a huge set of data into various clusters on the basis of a predetermined set of attributes is called hierarchical cluster analysis (HCA). The fundamental goal of this clustering is to categorize clusters or groups of physicochemical parameters for monitoring groundwater stations. R-type HCA was used to classify the datasets for the evaluated groundwater samples into various clusters by comparing or contrasting the physicochemical parameters in the datasets (Ravindra et al. Citation2022). Based on their similar physicochemical composition, this HCA type groups physicochemical parameters, identifying the potential source of pollutants in the areas (Egbueri and Agbasi Citation2022b). For this study, the hierarchical technique was used to base the cluster observations, which were carried out on a standardized dataset using the Ward (Citation1963) linkage approach, which quantifies similarity or dissimilarity and builds a dendrogram using squared Euclidean distance. A visual representation of the grouping, the dendrogram, shows the clusters and their proximities while significantly reducing the complexity of the original water quality data (Egbueri Citation2020a, Citation2020b; Simeonov et al. Citation2003; Singh et al. Citation2005). In this statistical computation, was used, and the water quality datasets were normalized using the Z-score transformation methodology.
3. Results and discussion
3.1. General characteristics of groundwater quality
The analytical physicochemical characteristic data for the present study are presented in . Also, the descriptive statistics and their matching with national and international standard limits are given in . With a mean temperature (T) of 26.05 °C and a range of 23 °C–28 °C, the groundwater in the urban clusters was relatively warm. Although there is no set T limit, the WHO (World Health Organization) (Citation2008) reported that as water T rise, the rate of rock weathering or mineral dissolution will also rise. The concentration of hazardous elements in water could be affected by the increased rate of mineral dissolution (WHO (World Health Organization) Citation2008, Citation2017). Since warm water encourages the growth of potentially dangerous germs and bacteria, it may have an impact on the tastes, odours, colours and water corrosivity potential (Egbueri Citation2022, Citation2019; WHO (World Health Organization) Citation2008). According to the physicochemical analysis, the pH of the groundwaters in Awka urban ranged from 4.8 to 6.1, while those in Nnewi urban ranged from 4.2 to 7.5. ( and ). Although it is controlled by other chemical constituents, groundwater pH has little impact on human health. The Awka urban’s groundwater samples were all a little bit higher acidic than the recommended minimal levels. Based on pH values for drinking water (SON (Standard Organization of Nigeria) Citation2015; WHO (World Health Organization) Citation2017). Sixty percent of the groundwater samples taken from the Nnewi urban were above the prescribed norm, while forty percent were below safe limits. Acidic water has been reported to have negative effects on water taste, human health, metallic water channels and aesthetics (Egbueri Citation2022; Subba Rao et al. Citation2021; Egbueri et al. Citation2022a; Ravindra et al. Citation2022). Ailments linked to consuming acidic water include mucous membrane degeneration and gastrointestinal disorders (Omeka and Egbueri Citation2023; Gaikwad et al. Citation2020). In the studied urban clusters, the excessive use of chemicals in urban residences and improper disposal of acidic organic and inorganic wastes may be to blame for the low pH levels in both urban clusters. Because of the presence of organic matter and weathering of certain geologic deposits (e.g. iron sulphide) can increase the concentrations of water acidity and sulphate as expressed by the chemical reaction given in EquationEquation (14)(14)
(14) . When there is an elevated quantity of acid in water, it can further raise the rate of weathering and dissolution of geologic materials.
(14)
(14)
Table 2. Physicochemical variables tested in groundwater resources from the urban clusters.
Table 3. Descriptive statistics of the analysed water quality parameters.
In general, all of the concentrations of the other physicochemical parameters examined for this investigation fell within the established benchmarks ( and ). However, the obtained results provide useful insights regarding the extent of geogenic and anthropogenic impacts on water resources. One of the crucial physicochemical characteristics of water is its electrical conductivity (EC), which is one of the primary indicators used to gauge the degree of water quality degradation (Weber-Scan and Duffy Citation2007). (Egbueri and Agbasi Citation2022a). As a result, changes in water’s EC level offer information on the degree and likely primary causes of water contamination (Egbueri and Agbasi Citation2022a). Water resources with high EC values are more likely to contain pollutants. It can be used to control pollution in the aquatic environment because it is a trustworthy indication (Sun et al. Citation2021; Shah et al. Citation2021). In this study, the groundwater EC measured in the urban areas of Awka and Nnewi varied from 12.0 to 412.00 µS/cm and from 30.50 to 108.40 µS/cm, respectively (). The standard allowable limit for these values was determined to be 1000 µS/cm (WHO (World Health Organization) Citation2017; SON (Standard Organization of Nigeria) Citation2015). Therefore, it is expected that all of the water samples will have minimal levels of pollutants in relation to the EC. High EC water may result in several undesirable bodily effects. The inorganic salts and organic debris in the groundwater may have had an impact on the measured EC values (Sun et al. Citation2021; Wagh et al. Citation2020; Shah et al. Citation2021). The extent of man-made contamination and rock-water interactions may also be connected to the EC level (Egbueri and Agbasi Citation2022a; Wagh et al. Citation2020). Additionally, it is thought that the low-moderate EC found in this study may have been diluted as a result of rainwater seeping through the aquifer systems.
The concentrations of the chemical ions (SO42-, NO3-, PO43-, Cl-, HCO3-, Ca2+, Mg2+, Na+ and K+) in the groundwater resources from the study area were also tested and compared with the WHO (World Health Organization) (Citation2017) and SON (Standard Organization of Nigeria) (Citation2015) admissible limits ( and ). Their concentrations in Nnewi urban and Awka urban were observed to be above their respective recommended benchmarks in specific sample sites. PO43- content was found to be the lowest in all the groundwater samples from both localities. Generally, with respect to their mean values, the ionic concentrations in the groundwater resources were found in the order Cl- > HCO3- > Ca2+ > Mg2+ > Na+ > SO42- > K+ > NO3- > PO43- for Awka and Cl- > SO42- > Na+ > Ca2+ > HCO3- > K+ > Mg2+ > PO43- > NO3- for Nnewi. From these findings, it was realized that while Ca2+-Cl- water predominated the Awka area, Na+-Cl- water predominated the Nnewi area. Among the chemical parameters, NO3- and PO43- are primarily related to anthropogenic origins (Egbueri Citation2019; Ramalingam et al. Citation2022; Egbueri and Agbasi Citation2022b). However, K+, Cl- and SO42- have been primarily traced to anthropogenic and geogenic origins (Ravindra et al. Citation2022; Subba Rao et al. Citation2021; Egbueri Citation2019; Ge et al. Citation2021; Mgbenu and Egbueri Citation2019). Some studies have also reported that the sources of Mg2+ and Na+ ions in groundwater are partially attributed to anthropogenic activities (Subba Rao Citation2021). It is also realized from the chemical ion concentrations that the extent of anthropogenic impact on the urban groundwater resources is low. This observation might have been so because of issues related to the nature of the aquifer, depth of the aquifer, nature of leachates from anthropogenic sources and the other contamination mechanisms and factors.
Table 4. Results of the WNPI, NPI and WPI assessments of the groundwater quality of the urban clusters.
In urban areas, chloride (Cl) can be attributed to non-lithological contamination sources like septic tank leakages, domestic effluents and irrigation-return flows (Ravindra et al. Citation2022; Egbueri Citation2020a). It has also been attributed to lithological sources such as silicate minerals (Mgbenu and Egbueri Citation2019). Sulphur is one of the most abundant elements in sediments and in the crust of the earth (Kaplan Citation1972). The oxidation of sulphide minerals, organic sulphur or elemental sulphur produces a soluble divalent SO42- (Alley Citation1993; Wetzel Citation1983; Field Citation1972). Through ionic bonding, the anion is frequently connected to alkaline earth, alkali or transition metals (Field Citation1972). While Ca sulphate and many heavy metal sulphates are less soluble in water, Na, K and Mg sulphates are very soluble (WHO (World Health Organization) Citation2004). Water typically has the highest sulphate concentrations, which are thought to be a combination of sulphates from geochemical, biological and atmospheric sources. The sulphur cycle continuously transfers sulphate across compartments, and it is present everywhere in the environment. At least, 80% of worldwide SO2 emissions and over 45% of water-borne SO4 can be attributed to human activities, which has a considerable impact on the sulphur cycle (Moore Citation1991). Sulphates are used in the production of several chemicals, glass, dyes, astringents, paper, textiles, soaps, insecticides, fungicides and emetics as well as in the mining, metal and plating industries, pulping, leather processing and water and sewage treatment (Greenwood and Earnshaw Citation1984; Sharma and Kumar Citation2020). For instance, ammonium sulphate is utilized in fertilizer production, and a variety of sulphate salts are employed in food production (FDA Citation1999). Also, when treating drinking water, alum (i.e. aluminium sulphate) is utilized as a sedimentation agent. Algae in water supply systems have also been controlled with copper sulphate. Additionally, silicate weathering processes, industrial operations, atmospheric precipitation (in the form of sulphur dioxide) and sewage inputs in the study area are probable sources of groundwater SO42- (Ge et al. Citation2021; WHO (World Health Organization) Citation2004). By combining with water vapour (H2O(g)), sulphur trioxide, which is created by catalytic or photolytic oxidation of SO2, creates diluted sulphuric acid, which is what is known as ‘acid rain’ (Delisle and Schmidt Citation1977). In relation to the acidic water reported in this study, it is anticipated that acid rain, which possibly recharged the aquifer systems, influenced the pH of the water samples.
The vulnerability to water nitrate contamination seems to be higher in urban areas where human activities are high. The main causes of nitrate contamination in the groundwater could be excessive anthropogenic loading, which includes wastes, e.g. fertilizers, pesticides and animal dung, sewer pipeline leaks, landfill leachate, drainage of poultry waste, organic and inorganic waste and household waste (Egbueri Citation2020a; Balamurugan et al. Citation2020a; Rahman et al. Citation2021; Egbueri and Agbasi Citation2022b; Ravindra et al. Citation2022). The nitrate contamination vulnerability could be predetermined by the redox water environment in the geological strata underground and at the earth’s surface (Voutchkova et al. Citation2021; Hansen et al. Citation2016). Numerous factors, including geological features, anthropogenic activities, water environment, atmospheric nitrogen fixation and nitrogen-bearing soil, can affect the overall NO3- content in groundwater (Khandare Citation2013). In most cases, nitrate dissolves quickly in surface water and readily permeates the groundwater as well. Additionally, a nitrification reaction that typically turns NH3 or NH4 into NO3 (Equation [15]) and boosts the NO3- concentration in groundwater, may be triggered by an oxidizing state in waste sites (Rahman et al. Citation2021; Ahamad et al. Citation2019). Moreover, NO3- levels may change if water from several sources is mixed. This may happen naturally (for instance, as a result of quick recharging) or as a result of subpar well construction efforts. These elements, however, are subject to alter both within and between groundwater aquifers. Different groundwater locations may have different NO3 levels because of cyclical precipitation patterns, groundwater flow rates, evapotranspiration mechanisms and other factors (Shalev et al. Citation2015; Ramalingam et al. Citation2022; Buvaneshwari et al. Citation2017; Nakagawa et al. Citation2017).
(15)
(15)
3.2. Contamination status assessment using water quality indices
3.2.1. Nitrate pollution index
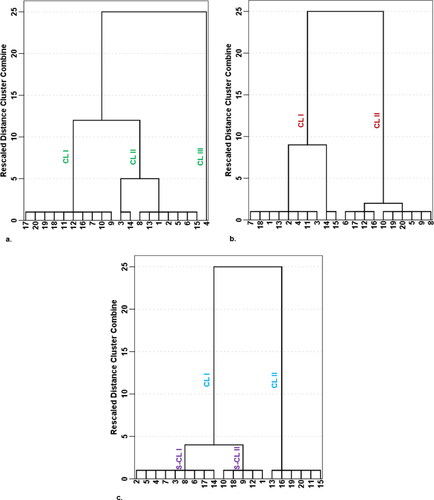
The NPI exclusively considers NO3- for the assessment of anthropogenic influence on groundwater. NPI of the analysed groundwater samples was computed and also shown in . The NPI explains the extent of human-induced contamination impact into five key categories: no impact (NPI < 0), light impact (NPI = 0–1), moderate impact (NPI = 1–2), significant impact (NPI = 2–3) and very significant impact (NPI > 3) (Obeidat et al. 2012). The classification of groundwater on the basis of NPI showed that all of the groundwater locations received light contamination impact, as the NPI values were all below 1 (). The current research observation deviated from the study carried out by Ramalingam et al. (Citation2022), who reported that the water samples they analysed in India fell into three NPI categories – light, moderate and significant categories. The present NPI results ranged between −0.999 and −0.790 with an average score of −0.956. Three main clusters were identified on the basis of the NPI (). The order of nitrate contamination risk as demonstrated by the dendrogram in is Cluster III > Cluster II > Cluster I. With continuous anthropogenic activities in the study area, groundwater locations in Clusters II and III would be more vulnerable to nitrate pollution than those in Cluster I. The NPI result appears to show that nitrate leaching rates and content in the investigated groundwater are not significantly increased by diffuse sources of nitrate, such as excessive use of synthetic fertilizers and municipal and domestic wastes (Panneerselvam et al. Citation2020a; Obeidat et al. Citation2012). Moreover, the rate of transformation of nitrate from root zones of plants in the study area into the aquifers harbouring the groundwater resources seems to be low, as is evident from the low nitrate values. The low concentrations of NO3 are a plus, as excessive nitrate (NO3) concentrations would accelerate algal growth in the natural waters. Eutrophication, which results from algae development and frequently leads to toxic algal blooms and water column anoxia, has a detrimental effect on the environment, human health and increasing water demand (Ramalingam et al. Citation2022).
Figure 3. Q-mode hierarchical dendrograms for classifying the water samples based on (a) NPI, (b) WNPI and (c) WPI. Samples 1–10, respectively, represent ABH1–ABH10, whereas samples 11–20 represent NBH1–NBH10, respectively.
3.2.2. Water nutrient pollution index
The WNPI has been computed in this study to show the impact of N-P-K nutrients on the groundwater of the study area. The sources of N-P-K compounds in groundwater are mainly from anthropogenic inputs like organic matter, municipal wastewater, sludge, septic tanks and nitrate-phosphate-potassium-rich fertilizers (Tokatlı 2021; Egbueri Citation2019; Onyemesili et al. Citation2022). The result of the applied WNPI of the drinking groundwater resources is shown in . According to the obtained WNPI values, which integrated the parameters of NO3-, PO43- and K+, it was indicated that the drinking waters of the investigated urban clusters recorded ‘no pollution’ status of water quality, ranging from 0.060 to 0.745 with an average value of 0.277. However, two clusters were formed regarding the WNPI (). Cluster I is comprised of water samples with the lowest WNPI values of <0.2 while Cluster II mainly comprises of samples with WNPI values > 0.2. It was thought that the groundwater locations found in Cluster I would become more vulnerable to nutrient pollution than those in Cluster II with a continuous increase in anthropogenic activities in the area. The WNPI result suggests that the anthropogenic influence, in terms of nutrient enrichment in the groundwater, is quite low. A similar finding has been reported in Turkey by Tokatli (Citation2021). The order of risk of the input parameters utilized for the WNPI calculation showed that, in general, the K+ ion predominated over PO43- and NO3-. Although the present study area includes urban clusters where human activities are intensive, the key reason for the low WNPI scores recorded in this research is thought to be the inhibition of organic contaminant movement into the aquifer systems by clayey geologic units and soil structure.
3.2.3. Water pollution index
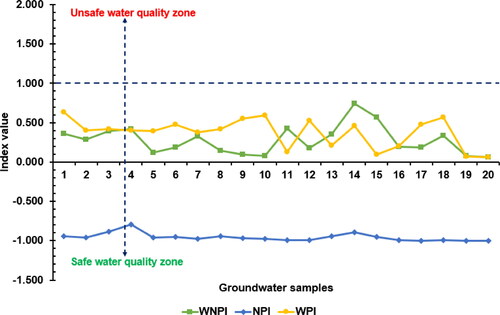
The WPI is based on WHO (World Health Organization) (Citation2017)-recommended acceptable drinking water quality limits. Eleven water quality physicochemical characteristics were used in this study to compute the WPI for each groundwater sample and determine the level of contamination in groundwater for drinking purposes (pH, EC, NO3-, PO43-, K+, Na+, Cl-, HCO3-, SO42-, Mg2+ and Ca2+). The pollution load of the individual parameters (i.e. PLi, which revealed the individual contributions of the parameters) and the final WPI values of the water samples are presented in . The computed WPI values were found to vary from 0.057 to 0.630, with a mean value of 0.373 (). According to the WPI classification scheme given by Hossain and Patra (Citation2020), groundwater resources were classified into two water quality types – excellent water type (75%) and good water type (25%). In this study, two hierarchical clusters were noticed based on the WPI model (; ). It was seen that Cluster I is comprised of groundwater samples with WPI values > 0.3 (having samples in excellent and good water categories) while Cluster II was constituted by water samples with the lowest WPI values < 0.3 (indicating the best samples within the excellent water quality group). The first sub-cluster (S-CL I) in Cluster I represents some groundwater samples in the excellent water category, whereas the second sub-cluster (S-CL II) represents the five groundwater samples in the good water class (; ). It was thought that the groundwater locations found in S-CL II would become more vulnerable to overall physicochemical pollution than those in CL I and S-CL I with a steady increase in anthropogenic activities in the area. Ravindra et al. (Citation2022) applied the WPI model in India and obtained two groundwater quality classes – highly polluted water (40%) and moderately polluted water (60%). However, the findings of the present study indicate that the groundwater resources, with respect to the considered water quality physicochemical parameters, are still in a state where they do not pose significant threats to human health. The WPI findings also confirm that the anthropogenic processes, which often heighten the pollution loading of water resources, still have a low impact on the groundwater in the study area. The WPI implication is quite consistent with those of the NPI and WNPI. As can be observed from the graphical plot in , the NPI, WNPI and WPI confirm that the groundwater resources quality in the urban clusters is still within safe zones, with no index value found to be greater than 1.
Figure 4. Trends observed from the distribution of the water quality indices – WNPI, NPI and WPI. Samples 1–10, respectively, represent ABH1–ABH10, whereas samples 11–20 represent NBH1–NBH10, respectively.
3.3. Contamination status assessment using nitrate health risk analysis
The USEPA recommended that the NO3 content to not go over 45 mg/L, as this level can have substantial negative effects on human health. However, studies have shown that even lower nitrate concentrations could pose low to moderate chronic health risks (Unigwe et al. Citation2022). In the present study, the developed health risk model was used to evaluate the possible impacts of nitrate in the groundwater resources due to oral and dermal exposure pathways. Six age groups have been established for the human population: 0–6 months, 5–10, 10–15, 15–20, 20–60 and > 60 years. For each age group in the study area, the summation of oral and dermal health hazard values was also completed. For all the age groups, the CDI and DAD values for the oral and dermal pathways were lower than 1 ( and ). The same is true for the HQ and HI values ( and ). This implies that the chronic health risks due to nitrate contamination in the study area are low. However, it was realized that the risk associated with oral pathway for the six population groups is higher than those due to dermal pathway. Moreover, the THI values are consistent with the HI values, summing lower than 1 (). From the youngest to the eldest, the THI values varied from 0.001 to 0.191 with an average of 0.040; 0.001 to 0.142 with an average of 0.030; 0.001 to 0.143 with an average of 0.030; 0.001 to 0.105 with an average of 0.022; 0.001 to 0.102 with an average of 0.022; and 0.001 to 0.105 with an average of 0.022 for the six human age populations, respectively (). The cumulative THI values were seen to range between 0.006 and 0.787 with a mean value of 0.167 ().
Table 5. Result of the nitrate oral exposure health risk computation for the six age groups in the urban clusters.
Table 6. Result of the nitrate dermal contact exposure health risk computation for the six age groups in the urban clusters.
Table 7. Total hazard index (THI) for the six age groups and the cumulative THI values for the urban clusters.
The results of these health risk indices show that all the analysed groundwater samples in the urban clusters would not cause significant health effects due to ingestion plus dermal absorption for the six age groups. Nevertheless, some previous studies conducted in the urban clusters, with respect to heavy metal pollution assessment, have indicated very low to high human health risks (Onyemesili et al. Citation2022; Okoye et al. Citation2016; Onunkwo et al. Citation2014; Agu et al. Citation2014; Omeka and Egbueri Citation2023). Although heavy metals could occur in water as an implication of human-related activities, the results of the nitrate health risk analysis and the other physicochemical parameters suggest that the extent of anthropogenic activities that could influence their presence in the groundwater is low. In some regions of the world where higher anthropogenic impacts have been reported, their nitrate health risk evaluation revealed higher human health risks (Ramalingam et al. Citation2022; Panneerselvam et al. Citation2020a, Citation2020b; Rahman et al. Citation2021). For instance, in India, Mukherjee and Singh (Citation2021) and Ramalingam et al. (Citation2022) reported higher human health risk exposures. However, in southeast Nigeria, Unigwe et al. (Citation2022) reported nitrate health risk ranges similar to those obtained in this study. The findings of the NO3 health risk assessment are comforting, in that the continuous use of the groundwater resources would not cause some serious effects on the health of the various age groups of inhabitants. Some of the health impacts that could be anticipated, if the groundwater resources were observed to have elevated concentrations of NO3, include blue baby syndrome (methemoglobinemia) for infants; acute respiratory infection, high blood pressure, and type 1 child diabetes for the 5–10 years’ age group; high blood pressure, prematurity, blood acidity, vasodilation, immune-regulatory and antithrombotic effects for the 10–20 years age bracket (Ramalingam et al. Citation2022; Unigwe et al. Citation2022; Egbueri Citation2020b, Citation2023; Aschebrook-Kilfoy et al. Citation2012; Zeman et al. Citation2011). Furthermore, for the 20–60 years human age group, issues related to conception and pregnancy, such as retardation of the intrauterine growth, foetal deaths, spontaneous abortion, congenital malformation, low birth weight and neonatal deaths are some health-related issues due to elevated NO3- concentrations (Ramalingam et al. Citation2022; Garcia Torres et al. Citation2020; Migeot et al. Citation2013). Finally, for the human age groups above 60 years, there could be risks of heart attack, cardiovascular hypertrophy, heart diseases, myocardial infraction and retinal lipid peroxidation when the nitrate level is high (Ramalingam et al. Citation2022; Garcia Torres et al. Citation2020; Migeot et al. Citation2013).
3.4. Contamination source assessment using geochemical plots
3.4.1. Chadha’s plot
The Chadha (Citation1999)’s plot provides an excellent alternative to the Piper plot, for understanding water types and the factors that affect groundwater geochemistry. The fundamental determinants of the ion concentration in groundwater are usually the geological compositions and environmental conditions such as evaporation rate, rainfall, runoff and water flow underground (Egbueri Citation2019; Mgbenu and Egbueri Citation2019; Eyankware et al. Citation2020; Ramalingam et al. Citation2022). Chadha’s plot used in this study identified the primary controlling influencers of groundwater chemistry and quality. The Chadha’s plot comprises of four quadrants (). Each of the quadrants (fields) represents an influencing factor of water quality. This plot has been found very applicable and useful in hydrogeochemical studies performed by previous researchers from different regions of the world (Wagh et al. Citation2019; Ravindra et al. Citation2022; Mukherjee et al. Citation2022). The plot mainly expresses the differences between the cations, K++Na+ (alkali metals) and Mg2++Ca2+ (alkaline earth metals) the anions, CO32− +HCO3− (weak acids) and SO42−+Cl− (strong acids).
Figure 5. Chadha plot showing the predominant water types in the study area.
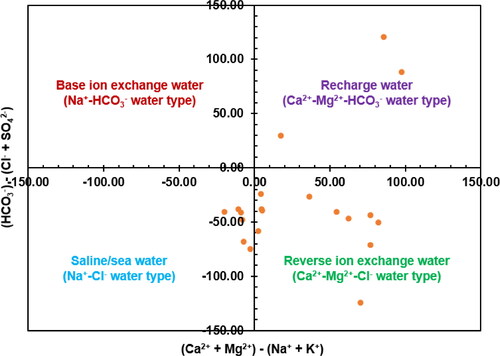
The four fields of Chadha’s plot typically represent water mainly influenced by base ion exchange (Na+-HCO3−), saline or sea water (Na+-Cl−), reverse ion exchange water (Ca2+-Mg2+-Cl−) and recharging water (Ca2+-Mg2+-HCO3−). According to the base ion exchange field, groundwater processes involving Ca2+ and Mg2+ reactions are followed by the adsorption of Na+ onto mineral surfaces. According to the saline or seawater field, the research location is influenced by coastal areas and may experience seawater intrusion or salt precipitation in an evaporative water environment. The reverse ion exchange field shows that higher contents of Ca2+ and Mg2+ were released during the weathering of the host rock and mineral breakdown. The recharging water field shows that surface water that contains significant ions like Ca2+, Mg2+ and HCO3- penetrated the subsurface (; Ramalingam et al. Citation2022). In , it was seen that 55% of the groundwater samples plotted in the reverse ion exchange quadrant/field, which explains why Ca2+-Mg2+-Cl- water type predominates over Na+-Cl- water type. This is consistent with the initial order of ionic contents mentioned earlier, whereby Ca2+ and Mg2+ are the predominant cations and Cl- is the predominant anion.
It was also noticed that 30% of the samples plotted in the saline water field (), indicating that evaporation processes in the past played a role in creating the Na+-Cl− groundwater chemistry in the study area. This observation is different from that reported by Ravindra et al. (Citation2022), Mukherjee et al. (Citation2022) and Wagh et al. (Citation2019), who observed the predominance of other water types. This water type predominant in the area could be as a result of septic tank leaks, sewage sludge, agrochemicals, irrigation-return flows, etc., in groundwater (Ravindra et al. Citation2022). The Na+ and Cl− concentrations would increase in the groundwater by substantial decreases in the Ca2+ (and maybe Mg2+) concentrations in groundwater, giving room for the dominance of saline groundwater (Mgbenu and Egbueri Citation2019; Subba Rao et al. Citation2021). While the reverse ion exchange that favours the dominance of Ca2+-Mg2+-Cl− water type is expressed with EquationEquation (16)(16)
(16) , the reaction (forward ion exchange) that favours the occurrence of Na+-Cl− water type is expressed with EquationEquation (17)
(17)
(17) (Mgbenu and Egbueri Citation2019). Finally, the remaining 15% of the water samples are plotted in the recharging water field that is defined by Ca2+-Mg2+-HCO3− water type. This study indicates that the groundwater in the study area is influenced by multiple/mixed geochemical processes, excluding base ion exchange ().
(16)
(16)
(17)
(17)
3.4.2. Other bivariate geochemical plots
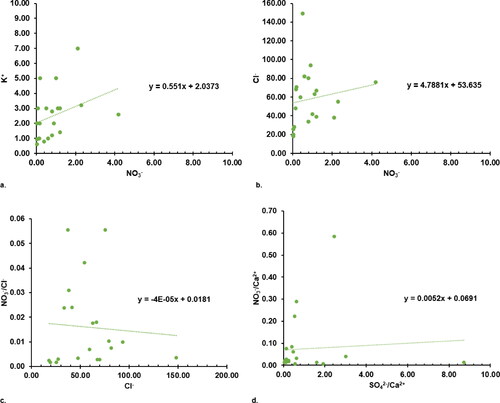
In an attempt to confirm and establish the findings and deductions made from Chadha’s plot given in , the relationships and correlations of Ca2+/Na+ versus Mg2+/Na+ and Ca2+/Na+ versus HCO3−/Na+ were plotted (as shown in ) to analyse the hydrogeochemical processes that influence the groundwater chemistry. These plots presented in have been widely used for predicting the different origins of groundwater geochemistry – which might be either silicate weathering, carbonate dissolution or evaporite dissolution (Subba Rao et al. Citation2021). In this study, all of the analysed groundwater resources were observed to be in the silicate weathering domain (). This shows strong agreement with Chadha’s plot, which identified reverse ion exchange, salinization (forward ion exchange) and rock weathering during water recharge flow as the prevalent hydrogeochemical processes influence groundwater chemistry. It is known that these prevalent hydrogeochemical processes are substantially associated with silicate weathering, as has been reported by previous studies (Mgbenu and Egbueri Citation2019; Verma et al. Citation2020; Subba Rao et al. Citation2021; Egbueri Citation2019; Ravindra et al. Citation2022). As a result, the groundwater sample scatter plot in depicted the ionic concentration, which was mostly controlled by silicate weathering, with minimal or no contributions from evaporite or carbonate dissolution. The lack of CaCO3 (carbonate) deposits in the study area suggests that there is no direct natural evidence of intense evaporation in the past. Further, shows some plots for investigating the anthropogenic implications of the relationships between NO3- versus K+, NO3- versus Cl-, NO3-/Cl- versus Cl- and SO42-/Ca2+ versus NO3-/Ca2+. The ions NO3-, Cl-, K+ and SO42- are noted to have anthropogenic sources. Such implications have been reported by Mgbenu and Egbueri (Citation2019), Ravindra et al. (Citation2022), Ge et al. (Citation2021), WHO (World Health Organization) (Citation2004) and Sharma and Kumar (Citation2020). Based on the level of correlation and linear trends observed amongst the plotted parameters, it is indicated that the level of anthropogenic influence on groundwater quality and chemistry is quite low. Moreover, the anthropogenic origins they were derived from seem to differ across the study area.
Figure 6. Plots showing the geogenic implication of the relationships between (a) Ca2+/Na+ versus HCO3-/Na+ and (b) Ca2+/Na+ versus Mg2+/Na+.
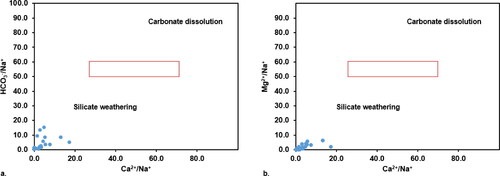
Figure 7. Plots showing the anthropogenic implications of the relationships between (a) NO3- versus K+, (b) NO3- versus Cl-, (c) NO3-/Cl- versus Cl- and (d) SO42-/Ca2+ versus NO3-/Ca2+.
3.5. Contamination source assessment using chemometric analysis
3.5.1. Principal component analysis
In order to identify and differentiate the main possible sources of contaminants in the study region, PCA was applied on the hydrogeochemical datasets. The PCA of the groundwater resources in the research area () revealed four most important principal components (PCs) which were extracted and explained 73.024% of the cumulative variances in the hydrogeochemical data. It was realized that the PC 1, PC2, PC 3 and PC 4, explained 27.357%, 21.874%, 12.818% and 10.975% of the total hydrogeochemical variances, respectively. The 3D spatial distribution of the PCs is shown in . The eigenvalues of the four PCs decreased from the first (PC 1) to the last (PC 4) (). It was noticed in this study that the PC 1 was strongly associated with HCO3-, Ca2+, Mg2+ and Cl-; PC 2 characterized was by EC, NO3-, PO43-, SO42- and K+; PC 3 characterized by T, SO42- and Na+; and PC 4 characterized by T and pH ().
Figure 8. 3D image showing the graphical distribution of the principal components.
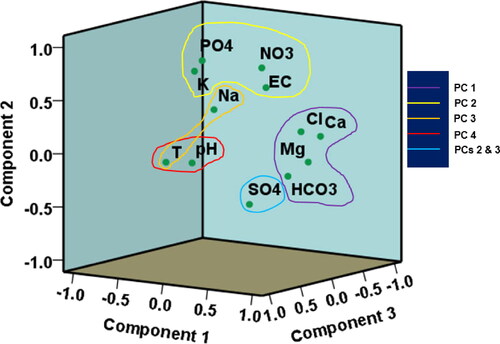
Table 8. Main extractions from the principal component analysis.
Similar to the findings of the geochemical plots presented in and , the PC 1 is indicative of silicate weathering origin of the predominant Ca2+-Mg2+-Cl− water type and HCO3- in the study area (Mgbenu and Egbueri Citation2019; Subba Rao et al. Citation2021; Ravindra et al. Citation2022; Mukherjee and Singh Citation2022b). This also suggests that the concentrations of HCO3- were not from carbonate rock weathering but possibly have the same silicate rock origin as Ca2+, Mg2+ and Cl−. The PC 2 is typical of a parametric assemblage from anthropogenic sources. However, the negative loading on SO42- suggests that it could be from an alternative origin. Meanwhile, its presence seems to influence the other anions in the PC. Moreover, the anions appear to influence the conductivity of the groundwater. In PC 3, temperature (T) seems to influence the Na+ enrichment. However, this is not the same for SO42-, which has a negative loading within this PC class. Additionally, it is suspected that there are no occurrences of Na+-SO42- water type and Na2SO4 salt in the area. This inference is consistent with the implications of the water types already reported in this study. PC 4 suggests that the groundwater temperature does not influence its acidity and vice versa.
Based on the PCs identified in this study, it becomes worthy to note that PCs 1, 3 and 4 represent the various geogenic processes that define the groundwater chemistry and quality. However, PC 4 represents the various anthropogenic activities that influence groundwater chemistry and quality. Overall, it is adjudged that the groundwater quality in the present study area is mostly influenced by geogenic, natural processes. Thus, the extent of anthropogenic influence on the groundwater, with respect to the analysed physicochemical variables, is still low.
3.5.2. Hierarchical cluster analysis
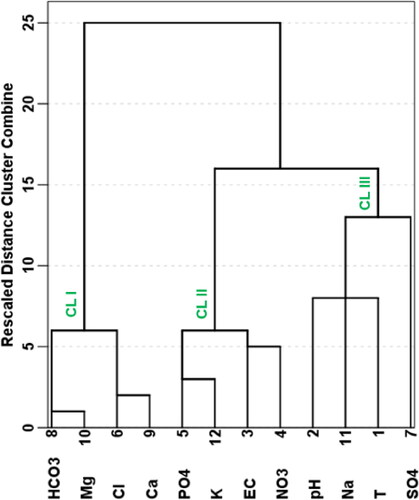
The HCA was used in this study to complement the PCA, towards the identification of the various sources of groundwater contamination (Egbueri Citation2020a, Citation2020b; Egbueri and Agbasi Citation2022b; Ravindra et al. Citation2022; Ayejoto et al. Citation2022a; Mukherjee and Singh Citation2022c). The same physicochemical parameters utilized for the PCA were used for the R-type HCA. The dendrogram produced from the present HCA is presented in . As can be noticed from , three main clusters were identified, namely Clusters I, II and III. Cluster I represented HCO3-, Mg2+, Cl- and Ca2+. Cluster II included PO43-, K+, EC and NO3−. However, Cluster III is comprised of pH, Na+, T and SO42-. Interestingly, the HCA findings maintained good agreement with those of the PCA. It was noted that Cluster I typically represents the PC 1; Cluster II mimics the PC 2; and Cluster III integrated the PCs 3 and 4 (; ). Overall, Clusters I and III represent groundwater contamination from geogenic origins whereas Cluster II represents anthropogenic groundwater contamination origins – which their implications have been discussed in some sections previously.
Figure 9. R-mode hierarchical dendrogram for evaluating the possible influencers of water contamination.
4. Conclusions
This study has evaluated the extent of anthropogenic activities on the groundwater quality with Awka and Nnewi urban clusters in southeastern Nigeria using an integrated approach based on selected physicochemical parameters (T, pH, EC, NO3-, PO43-, K+, Na+, Cl-, HCO3-, SO42-, Mg2+ and Ca2+). The aim of the study was achieved with respect to WNPI, NPI, WPI and oral and dermal contact nitrate health risk assessment for six human populations (0–6 months, 5–10, 10–15, 15–20, 20–60 and >60 years). With a mean temperature of 26.05 °C and a range of 23 °C–28 °C, the groundwater in the urban clusters was relatively warm. The pH of the groundwaters in Awka urban ranged from 4.8 to 6.1, while those in Nnewi urban ranged from 4.2 to 7.5. In general, all of the concentrations of the other physicochemical parameters examined for this investigation were within the established benchmarks. The concentrations of the chemical ions (SO42-, NO3-, PO43-, Cl-, HCO3-, Ca2+, Mg2+, Na+ and K+) in the groundwater resources from the study area were also tested and compared with the WHO (World Health Organization) (Citation2017) and SON (Standard Organization of Nigeria) (Citation2015) admissible limits. However, the obtained results provided useful insights regarding the extent of anthropogenic and geogenic impacts on water resources. The classification of groundwater on the basis of NPI showed that all of the water locations received light contamination impact, as the NPI values were all below 1. According to the obtained WNPI values, it was indicated that the drinking waters recorded ‘no pollution’ status of water quality. The order of risk of the input parameters utilized for the WNPI calculation showed that, in general, the K+ ion predominated over PO43- and NO3-. According to the WPI classification scheme, the groundwater resources were classified into two water quality types – excellent water type (75%) and good water type (25%). The NPI, WNPI and WPI results implied that anthropogenic processes have low impact on the physicochemical characteristics of the groundwater in the area. For all the age groups, the CDI, DAD, HQ, HI, THI and cumulative THI values for the oral and dermal pathways were lower than 1. This implies that the chronic health risks due to nitrate contamination in the study area are low. In Chadha’s plot, 55% of the samples plotted in the reverse ion exchange quadrant/field, which explains why Ca2+-Mg2+-Cl- water type predominates over Na+-Cl- water type. It was also noticed that 30% of the samples plotted in the saline water field, indicating that evaporation processes in the past played a role in creating Na+-Cl− water chemistry in the area. Then, 15% of the samples were plotted in the recharging water field that defined Ca2+-Mg2+-HCO3− water type. The bivariate and multivariate geochemical plots indicated that the level of anthropogenic influence on groundwater quality and chemistry is lower than the geogenic influences. They also revealed that the anthropogenic origins they were derived from seem to differ across the area. Strong agreement was established between the findings of the PCA and HCA. Overall, the PCA and HCA confirmed that the groundwater chemistry and quality are mostly influenced by geogenic, natural processes.
5. Merits of the study, limitations and perspectives for future research
The overall findings of this research have conclusively shown that the extent of anthropogenic influence on groundwater physicochemical characteristics is low. This research is considered beneficial as it provides the decision-makers with ready tool for quick identification of the various types of persons who are exposed to nitrate contamination in the research region according to the results and findings of the current study. As there is a paucity of literatures that have analysed the health risk of nitrate to six age groups, this study stands out to be the first in Nigeria to address this subject and contributes significantly to the global literature bank. The six age groups’ deterministic health risk from nitrate provided more extensive and in-depth insights needed for effective management plans for groundwater resources in the research area. Additionally, the sources of groundwater contamination were investigated using an integrated study approach, which provided a robust analysis of the results. The integrated study approach contributes to a better understanding of groundwater contamination from human activities and inputs in the study area and would aid in the effective management of the environment and groundwater resources. Although these merits exist, some limitations of the study that could be taken care of in future studies, are also noted. The present study did not consider the impact of seasonal variations over a long period of time. Thus, future research is encouraged to address this issue. Also, for improved monitoring, machine learning and other artificial intelligence techniques are recommended. There is also a limitation in the number of water stations covered. Therefore, it is advised that future studies cover more urban clusters and water stations in Southeast Nigeria for more detailed, comprehensive and comparative analyses. Finally, the water management authorities in the area should ensure that there are improvements in their management strategies to protect the groundwater from human-related impacts, as the area experiences a further increase in human population.
Acknowledgements
The authors gratefully acknowledge the technical and financial support provided by the Ministry of Education and King Abdulaziz University, DSR, Jeddah, Saudi Arabia. We also thank Mary Couts Burnett Library at Texas Christian University for supporting the APC for open access to this research manuscript.
Data availability statement
All the data used in this article are provided herein.
Disclosure statement
There are no competing interests regarding this work.
Additional information
Funding
References
- Abugu HO, Egwuonwu PF, Ihedioha JN, Ekere NR. 2021. Hydrochemical evaluation of river Ajali water for irrigational application in agricultural farmland. Appl Water Sci. 11(4):71.
- Agbasi JC, Chukwu CN, Nweke ND, Uwajingba HC, Khan MYA, Egbueri JC. 2023. Water pollution indexing and health risk assessment due to PTE ingestion and dermal absorption for nine human populations in Southeast Nigeria. Groundw Sustain Dev. 21:100921.
- Agbasi JC, Egbueri JC. 2022. Assessment of PTEs in water resources by integrating HHRISK code, water quality indices, multivariate statistics, and ANNs. Geocarto Int. 37(25):10407–10433.
- Agbasi JC, Egbueri JC. 2023. Intelligent soft computational models integrated for the prediction of potentially toxic elements and groundwater quality indicators: a case study. J Sediment Environ. 8(1):57–79.
- Agu KC, Orji MU, Onuorah SC, Egurefa SO, Anaukwu CG, Okafor UC, et al. 2014. Influence of solid waste dumps leachate on bacteriological and heavy metals contamination of groundwater in Awka. Am J Life Sci Res. 2(4):450–457.
- Ahamad A, Raju NJ, Madhav S, Gossel W, Wycisk P. 2019. Impact of non-engineered Bhalswa landfill on groundwater from Quaternary alluvium in Yamuna flood plain and potential human health risk, New Delhi, India. Quat Int. 507:352–369.
- Ako AA, Nkeng E, Takem GEE. 2009. Water quality and occurrence of water-borne diseases in the Douala 4th District, Cameroon. Water Sci Technol. 59(12):2321–2329.
- Alley WM. 1993. Regional ground-water quality. New York: van Nostrand Reinhold, p. 633.
- APHA. 2005. Standard methods for the examination of water and wastewater, 21st edn. New York
- APHA. 2012. Standard methods for the examination of water and wastewater. AWWA and WEF (22nd ed.). Washington, USA: American Public Health Association.
- Aschebrook-Kilfoy B, Heltshe SL, Nuckols JR, Sabra MM, Shuldiner AR, Mitchell BD, Airola M, Holford TR, Zhang Y, Ward MH. 2012. Modeled nitrate levels in well water supplies and prevalence of abnormal thyroid conditions among the Old Order Amish in Pennsylvania. Environ Health. 11:6.
- Ayejoto DA, Agbasi JC, Egbueri JC, Echefu KI. 2022b. Assessment of oral and dermal health risk exposures associated with contaminated water resources: an update in Ojoto area, southeast Nigeria. Int J Environ Anal Chem. 1–21. https://doi.org/10.1080/03067319.2021.2023515
- Ayejoto DA, Egbueri JC, Enyigwe MT, Chiaghanam OI, Ameh PD. 2022a. Application of HMTL and novel IWQI models in rural groundwater quality assessment: a case study in Nigeria. Toxin Rev. 41(3):918–932.
- Babiker IS, Mohamed MAA, Terao H, Kato K, Ohta K. 2004. Assessment of groundwater contamination by nitrate leaching from intensive vegetable cultivation using geographical information system. Environ Int. 29(8):1009–1017.
- Balamurugan P, Kumar PS. 2016. Quality of ground water assessment in Salem District using GIS Techniques. Adv Nat Appl Sci. 10(3):22–32.
- Balamurugan P, Kumar PS, Shankar K, Nagavinothini R, Vijayasurya K. 2020a. Non-Carcinogenic risk assessment of groundwater in southern part of Salem district in Tamilnadu, India. J Chil Chem Soc. 65(1):4697–4707.
- Balamurugan P, Shunmugapriya K, Vanitha R. 2020b. GIS based assessment of groundwater for domestic and irrigation purpose in Vazhapadi Taluk, Salem, Tamil Nadu, India. Taiwan Water Conserv. 68(2):1–10.
- Biswas T, Pal SC, Saha A, Ruidas D, Islam ARMT, Shit M. 2023. Hydro-chemical assessment of groundwater pollutant and corresponding health risk in the Ganges delta, Indo-Bangladesh region. J Clean Prod. 382:135229.
- Buvaneshwari S, Riotte J, Sekhar M, Mohan Kumar MS, Sharma AK, Duprey JL, Audry S, Giriraja PR, Praveenkumarreddy Y, Moger H, et al. 2017. Groundwater resource vulnerability and spatial variability of nitrate contamination: insights from high density tube well monitoring in a hard rock aquifer. Sci Total Environ. 579:838–847.
- Center for International Earth Science Information Network (CIESIN). 2004. Gridded population of the World (GPW), version 3. Columbia University. Available at http://beta.sedac.ciesin.columbia.edu/gpw.
- Chadha DK. 1999. A proposed new diagram for geochemical classification of natural waters and interpretation of chemical data. Hydrogeol J. 7(5):431–439.
- Chakraborty B, Roy S, Bera A, Adhikary P, Bera B, Sengupta D, Bhunia G, Shit P. 2021. Cleaning the river Damodar (India): impact of COVID-19 lockdown on water quality and future rejuvenation strategies. Environ Dev Sustain. 23(8):11975–11989.
- Delisle CE, Schmidt JW. 1977. The effects of sulphur on water and aquatic life in Canada. In Sulphur and its inorganic derivatives in the Canadian environment. Ottawa, Ontario: National Research Council of Canada (NRCC No. 15015)
- Egbueri JC. 2018. Assessment of the quality of groundwaters proximal to dumpsites in Awka and Nnewi metro-polises: a comparative approach. Int J Energ Water Res. 2(1–4):33–48.
- Egbueri JC. 2019. Water quality appraisal of selected farm provinces using integrated hydrogeochemical, multivariate statistical, and microbiological technique. Model Earth Syst Environ. 5(3):997–1013.
- Egbueri JC. 2020a. Groundwater quality assessment using pollution index of groundwater (PIG), ecological risk index (ERI) and hierarchical cluster analysis (HCA): a case study. Groundw Sustain Dev. 10:100292.
- Egbueri JC. 2020b. Heavy metals pollution source identification and probabilistic health risk assessment of shallow groundwater in Onitsha, Nigeria. Anal Lett. 53(10):1620–1638.
- Egbueri JC. 2021. Prediction modeling of potentially toxic elements’ hydrogeopollution using an integrated Q–mode HCs and ANNs machine learning approach in SE Nigeria. Environ Sci Pollut Res Int. 28(30):40938–40956.
- Egbueri JC. 2022. Incorporation of information entropy theory, artificial neural network and soft computing models in the development of integrated industrial water quality index. Environ Monit Assess. 194(10):693.
- Egbueri JC. 2023. A multi‑model study for understanding the contamination mechanisms, toxicity and health risks of hardness, sulfate, and nitrate in natural water resources. Environ Sci Pollut Res. 1–33. https://doi.org/10.1007/s11356-023-26396-5
- Egbueri JC, Agbasi JC. 2022a. Data-driven soft computing modeling of groundwater quality parameters in southeast Nigeria: comparing the performances of different algorithms. Environ Sci Pollut Res Int. 29(25):38346–38373.
- Egbueri JC, Agbasi JC. 2022b. Combining data-intelligent algorithms for the assessment and predictive modeling of groundwater resources quality in parts of southeastern Nigeria. Environ Sci Pollut Res Int. 29(38):57147–57171.
- Egbueri JC, Ayejoto DA, Agbasi JC. 2022a. Pollution assessment and estimation of the percentages of toxic elements to be removed to make polluted drinking water safe: a case from Nigeria. Toxin Rev. 42(1):146–160.
- Egbueri JC, Enyigwe MT. 2020. Pollution and ecological risk assessment of potentially toxic elements in natural waters from the Ameka metallogenic district in southeastern Nigeria. Anal Lett. 53(17):2812–2839.
- Egbueri JC, Unigwe CO, Agbasi JC, Nwazelibe VE. 2022. Indexical and artificial neural network modeling of the quality, corrosiveness, and encrustation potential of groundwater in industrialized metropolises, Southeast Nigeria. Environ Dev Sustain. https://doi.org/10.1007/s10668-022-02687-8
- Eyankware MO, Aleke CG, Selemo AOI, Nnabo PN. 2020. Hydrogeochemical studies and suitability assessment of groundwater quality for irrigation at Warri and environs, Niger delta basin, Nigeria. Groundw Sustain Dev. 10:100293.
- FDA. 1999. Code of Federal Regulations: food and Drugs Part 182 and 184, Office of the Federal Register. Washington, DC: National Archives and Records Administration.
- Field CW. 1972. Sulfur: element and geochemistry. In Fairbridge RW, editor. The Encyclopedia of Geochemistry and Environmental Sciences. New York: van Nostrand Reinhold, p. 1142–1148.
- Gaikwad S, Gaikwad S, Meshram D, Wagh V, Kandekar A, Kadam A. 2020. Geochemical mobility of ions in groundwater from the tropical western coast of Maharashtra, India: implication to groundwater quality. Environ Dev Sustain. 22(3):2591–2624.
- Garcia Torres E, Perez Morales R, Gonzalez Zamora A, Rios Sanchez E, Olivas Calderon EH, A, Romero JDJ, Calleros Rincon EY. 2020. Consumption of water contaminated by nitrate and its deleterious effects on the human thyroid gland: a review and update. Int J Environ Health Res. 32(5):984-1001.
- Ge X, Wu Q, Wang Z, Gao S, Wang T. 2021. Sulfur isotope and stoichiometry–based source identification of major ions and risk assessment in Chishui River Basin, Southwest China. Water. 13(9):1231.
- Greenwood NN, Earnshaw A. 1984. Chemistry of the Elements. Oxford, England: pergamon Press.
- Gutierrez M, Biagioni RN, Alarc On-Herrera MT, Rivas-Lucero BA.’ 2018. An overview of nitrate sources and operating processes in arid and semiarid aquifer systems. Sci Total Environ. 624:1513–1522.
- Hansen B, Sonnenborg TO, Møller I, Bernth JD, Høyer A-S, Rasmussen P, Sandersen PB, Jørgensen F. 2016. Nitrate vulnerability assessment of aquifers. Environ Earth Sci. 75(12):999.
- Hossain M, Patra PK. 2020. Water pollution index: a new integrated approach to rank water quality. Ecol Indic. 117:106668.
- Isiuku BO, Enyoh CE. 2020. Pollution and health risks assessment of nitrate and phosphate concentrations in water bodies in South Eastern, Nigeria. Environ Adv. 2:100018.
- Jaydhar AK, Pal SC, Saha A, Islam ARMT, Ruidas D. 2022. Hydrogeochemical evaluation and corresponding health risk from elevated arsenic and fluoride contamination in recurrent coastal multi-aquifers of eastern India. J Clean Prod. 369:133150.
- Kaplan IR. 1972. The Encyclopedia of Geochemistry and Environmental Sciences. New York: van Nostrand Reinhold, p. 1148–1151.
- Karunanidhi D, Aravinthasamy P, Subramani T, Wu J, Srinivasamoorthy K. 2019. Potential health risk assessment for fluoride and nitrate contamination in hard rock aquifers of Shanmuganadhi River basin, South India. Hum Ecol Risk Assess. 25(1–2):250–270.
- Khandare HW. 2013. Scenario of nitrate contamination in groundwater: its causes and prevention. Int J Chem Tech Res. 5:1921–1926.
- Kumar PS, Jegathambal P, James EJ. 2014. Chemometric evaluation of nitrate contamination in the groundwater of a hard rock area in Dharapuram, south India. Appl Water Sci. 4(4):397–405.
- Mgbenu CN, Egbueri JC. 2019. The hydrogeochemical signatures, quality indices and health risk assessment of water resources in Umunya district, southeast Nigeria. Appl Water Sci. 9(1):22.
- Migeot V, Albouy-Llaty M, Carles C, Limousi F, Strezlec S, Dupuis A, Rabouan S. 2013. Drinking-water exposure to a mixture of nitrate and low-dose atrazine metabolites and small-for-gestational age (SGA) babies: a historic cohort study. Environ Res. 122:58–64.
- Moore JW. 1991. Inorganic contaminants of surface water, research and monitoring priorities. Springer series on environmental management. De Santo RS, series ed. New York: Springer Verlag, p. 334.
- Moran D, Kanemoto K, Jiborn M, Wood R, Többen J, Seto KC. 2018. Carbon footprints of 13,000 cities. Environ Res Lett. 13(6):64041.
- Mukate S, Wagh V, Panaskar D, Jacobs JA, Sawant A. 2019. Development of new integrated water quality index (IWQI) model to evaluate the drinking suitability ofwater. Ecol Indic. 101:348–354.
- Mukherjee I, Singh UK. 2018. Groundwater fluoride contamination, probable release, and containment mechanisms: a review on Indian context. Environ Geochem Health. 40(6):2259–2301.
- Mukherjee I, Singh UK. 2020. Fluoride abundance and their release mechanisms in groundwater along with associated human health risks in a geologically heterogeneous semi-arid region of east India. Microchem J. 152:104304.
- Mukherjee I, Singh UK. 2021. Characterization of groundwater nitrate exposure using Monte Carlo and Sobol sensitivity approaches in the diverse aquifer systems of an agricultural semiarid region of Lower Ganga Basin, India. Sci Total Environ. 787:147657.
- Mukherjee I, Singh UK. 2022a. Exploring a variance decomposition approach integrated with the Monte Carlo method to evaluate groundwater fluoride exposure on the residents of a typical fluorosis endemic semi-arid tract of India. Environ Res. 203:111697.
- Mukherjee I, Singh UK. 2022b. Hydrogeochemical characterizations and quality evaluation of groundwater in the major river basins of a geologically and anthropogenically driven semi-arid tract of India. Sci Total Environ. 805:150323.
- Mukherjee I, Singh UK. 2022c. Environmental fate and health exposures of the geogenic and anthropogenic contaminants in potable groundwater of Lower Ganga Basin, India. Geosci Front. 13(3):101365.
- Mukherjee I, Singh UK, Chakma S. 2022. Evaluation of groundwater quality for irrigation water supply using multi-criteria decision-making techniques and GIS in an agroeconomic tract of Lower Ganga basin, India. J Environ Manage. 309:114691.
- Mukherjee I, Singh UK, Patra PK. 2019. Exploring a multi-exposure-pathway approach to assess human health risk associated with groundwater fluoride exposure in the semi-arid region of east India. Chemosphere. 233:164–173.
- Mukherjee I, Singh UK, Singh RP. 2021. An overview on heavy metal contamination of water system and sustainable approach for remediation. In Singh, A., Agrawal, M., Agrawal, S.B., Editors. Water Pollution and Management Practices. Singapore: Springer.
- Mukherjee I, Singh UK, Singh RP, Kumari D, Jha PK, Mehta, P, Anshumali. 2020. Characterization of heavy metal pollution in an anthropogenically and geologically influenced semi-arid region of east India and assessment of ecological and human health risks. Sci Total Environ. 705:135801.,
- Naik MR, Barik M, Prasad KV, Kumar A, Verma AK, Sahoo SK, Jha V, Sahoo NK. 2022. Hydro-geochemical analysis based on entropy and geostatistics model for delineation of anthropogenic ground water pollution for health risks assessment of Dhenkanal district, India. Ecotoxicology. 31(4):549–564.
- Nakagawa K, Amano H, Takao Y, Hosono T, Berndtsson R. 2017. On the use of coprostanol to identify source of nitrate pollution in groundwater. J Hydrol. 550:663–668.
- Nfor B, Olobaniyi S, Ogala J. 2007. Extent and distribution of groundwater resources in parts of Anambra State, Southeastern, Nigeria. J Appl Sci Environ Manag. 11(2):215–221.
- Nwajide CS. 2013. Geology of Nigeria’s sedimentary basins. Lagos: CSS Press.
- Obeidat MM, Awawdeh M, Al-Rub FA, Al-Ajlouni A. 2012. An innovative nitrate pollution index and multivariate statistical investigations of groundwater chemical quality of Umm Rijam Aquifer (B4), North Yarmouk River Basin, Jordan. Vouddouris K, Voutsa D. Water Quality Monitoring and Assessment. Croatia: inTech, p. 169–188.
- Ogbe OB, Osokpor J. 2021. Depositional facies, sequence stratigraphy and reservoir potential of the Eocene Nanka Formation of the Ameki Group in Agu-Awka and Umunya, southeast Nigeria. Heliyon. 7(1):e05846.
- Okoye NM, Orakwe LC, Nwachukwu PC. 2016. Groundwater quality mapping using GIS: a case study of Awka, Anambra state. Nigeria. IJEMR. 6(2):579–584.
- Omeka ME, Egbueri JC. 2023. Hydrogeochemical assessment and health-related risks due to toxic element ingestion and dermal contact within the Nnewi-Awka urban areas, Nigeria. Environ Geochem Health. 45(5):2183–2211.
- Onunkwo AA, Nwagbara JO, Ahiarakwem CA. 2014. Assessment of heavy metals in Nnewi underground water. Int J Eng Res Dev. 10(11):1–5.
- Onyemesili OO, Egbueri JC, Ezugwu CK. 2022. Assessing the pollution status, ecological and health risks of surface waters in Nnewi urban, Nigeria: implications of poor waste disposal. Environ Forensics. 23(3–4):346–360.
- Onyido AE, Nwangwu UC, Aribodor DN, Umeanaeto PU, Ugha CN, Ugwu FM, Onwude CO. 2014. Bacterial pathogens associated with wild-caught houseflies in Awka metropolis of Anambra state. Southeastern Nigeria. New York Sci J. 7(12):1–8.
- Ozoko DC, Onyekwelu IL, Aghamelu OP. 2022. Multivariate and health risks analysis of heavy metals in natural water sources around Enugu dumpsite, southeastern Nigeria. Appl Water Sci. 12(9):224.
- Pal SC, Ruidas D, Saha A, Islam ARMT, Chowdhuri I. 2022. Application of novel data-mining technique based nitrate concentration susceptibility prediction approach for coastal aquifers in India. J Clean Prod. 346:131205.
- Panneerselvam B, Karuppannan S, Muniraj K. 2020b. Evaluation of drinking and irrigation suitability of groundwater with special emphasizing the health risk posed by nitrate contamination using nitrate pollution index (NPI) and human health risk assessment (HHRA). Hum Ecol Risk Assess. 27(5):1324-1348.
- Panneerselvam B, Paramasivam SK, Karuppannan S, Ravichandran N, Selvaraj P. 2020a. A GIS-based evaluation of hydrochemical characterisation of groundwater in hard rock region, South Tamil Nadu, India. Arab J Geosci. 13(17):1–22.
- Rahman A, Mondal NC, Tiwari KK. 2021. Anthropogenic nitrate in groundwater and its health risks in the view of background concentration in a semi-arid area of Rajasthan, India. Sci Rep. 11(1):9279.
- Rahmati O, Samani AN, Mahmoodi N, Mahdavi M. 2015. Assessment of the contribution of N-fertilizers to nitrate pollution of groundwater in Western Iran (case study: ghorveh–Dehgelan aquifer). Water Qual Expo Health. 7(2):143–151.
- Ramalingam S, Panneerselvam B, Kaliappan SP. 2022. Effect of high nitrate contamination of groundwater on human health and water quality index in semi‑arid region, South India. Arab J Geosci. 15(3):242.
- Ravindra B, Subba Rao N, Dhanamjaya Rao EN. 2022. Groundwater quality monitoring for assessment of pollution levels and potability using WPI and WQI methods from a part of Guntur district, Andhra Pradesh, India. Environ Dev Sustain. https://doi.org/10.1007/s10668-022-02689-6
- Ruidas D, Pal SC, Islam ARMT, Saha A. 2021. Characterization of groundwater potential zones in water-scarce hardrock regions using data driven model. Environ Earth Sci. 80(24):809.
- Ruidas D, Pal SC, Islam ARMT, Saha A. 2023. Hydrogeochemical evaluation of groundwater aquifers and associated health hazard risk mapping using ensemble data driven model in a water scares plateau region of Eastern India. Expo Health. 15(1):113–131.
- Ruidas D, Pal SC, Saha A, Chowdhuri I, Shit M. 2022c. Hydrogeochemical characterization based water resources vulnerability assessment in India’s first Ramsar site of Chilka lake. Mar Pollut Bull. 184:114107.
- Saha A, Pal SC, Chowdhuri I, Roy P, Chakrabortty R. 2022. Effect of hydrogeochemical behavior on groundwater resources in Holocene aquifers of moribund Ganges Delta, India: infusing data-driven algorithms. Environ Pollut. 314:120203.
- Shah MI, Alaloul WS, Alqahtani A, Aldrees A, Musarat MA, Javed MF. 2021. Predictive modeling approach for surface water quality: development and comparison of machine learning models. Sustainability. 13(14):7515.
- Shalev N, Burg A, Gavrieli I, Lazar B. 2015. Nitrate contamination sources in aquifers underlying cultivated fields in an arid region—The Arava Valley, Israel. Appl Geochem. 63:322–332.
- Sharma MK, Kumar M. 2020. Sulphate contamination in groundwater and its remediation: an overview. Environ Monit Assess. 192(2):74.
- Shrestha S, Semkuyu DJ, Pandey VP. 2016. Assessment of groundwater vulnerability and risk to pollution in Kathmandu Valley (Nepal). Sci Total Environ. 556:23–35.
- Simeonov V, Simeonova P, Tsitouridou R. 2004. Chemometric quality assessment of surface waters: two case studies. Ecol Chem Eng. 11:449–469.
- Simeonov V, Stratis JA, Samara C, Zachariadis G, Voutsa D, Anthemidis A, Sofoniou M, Kouimtzis T. 2003. Assessment of the surface water quality in Northern Greece. Water Res. 37(17):4119–4124.
- Singh KP, Malik A, Sinha S. 2005. Water quality assessment and apportionment of pollution sources of Gomti river (India) using multivariate statistical techniques: a case study. Anal Chim Acta. 538(1-2):355–374.
- Singh RK, Villuri VGK, Pasupuleti S. 2022. Evaluation of water quality and risk assessment by coupled geospatial and statistical approach along lower Damodar river. Int J Environ Sci Technol. 19(10):9549–9570.
- SON (Standard Organization of Nigeria). 2015. Nigerian standard for drinking water quality—NIS-554–2015 (p. 1–28). Abuja: Standard Organization of Nigeria.
- Soomro F, Rafique T, Michalski G, Ali SA, Naseem S, Khan MU. 2017. Occurrence and delineation of high nitrate contamination in the groundwater of Mithi sub-district, Thar Desert, Pakistan. Environ Earth Sci. 76(10):355.
- Subba Rao N. 2021. Spatial distribution of quality of groundwater and probabilistic non-carcinogenic risk from a rural dry climatic region of South India. Environ Geochem Health. 43(2):971–993.
- Subba Rao N, Dinakar A, Sravanthi M, Karuna Kumari B. 2021. Geochemical characteristics and quality of groundwater evaluation for drinking, irrigation, and industrial purposes from a part of hard rock aquifer of South India. Environ Sci Pollut Res. 28(24):31941–31961.
- Sun K, Rajabtabar M, Samadi SZ, Rezaie-Balf M, Ghaemi A, Band SS, Mosavi A. 2021. An integrated machine learning, noise suppression, and population-based algorithm to improve total dissolved solids prediction. Eng Applic Comput Fluid Mech. 15(1):251–271.
- Thakur N, Rishi M, Sharma DA, Keesari T. 2018. Quality of water resources in Kullu Valley in Himachal Himalayas, India: perspective and prognosis. Appl Water Sci. 8(1):20.
- Tokatli C. 2021. Application of nutrient pollution index and water pollution index to evaluate the drinking water quality of the villages located in Edirne. Turkey. International Agricultural, Biological & Life Science Conference, Edirne, Turkey, 1–3 September, 2021. p. 554–559.
- Unigwe CO, Egbueri JC, Omeka ME. 2022. Geospatial and statistical approaches to nitrate health risk and groundwater quality assessment of an alluvial aquifer in SE Nigeria for drinking and irrigation purposes. J Indian Chem Soc. 99(6):100479.
- USEPA. 2006. USEPA Region III Risk-based Concentration Table: technical background information. Washington, DC: United States Environmental Protection Agency.
- USEPA. 2014. Human Health Evaluation Manual, Supplemental Guidance: update of standard default exposure factors-OSWER Directive 9200.1–120. 6p
- Verma A, Yadav BK, Singh NB. 2020. Hydrochemical monitoring of groundwater quality for drinking and irrigation use in Rapti Basin. SN Appl Sci. 2(3):460.
- Vieira JS, Pires JCM, Martins FG, Vilar VJP, Boaventura RAR, Botelho CMS. 2012. Surface water quality assessment of Lis River using multivariate statistical methods. Water Air Soil Pollut. 223(9):5549–5561.
- Voutchkova DD, Schullehner J, Rasmussen P, Hansen BA. 2021. High-resolution nitrate vulnerability assessment of sandy aquifers (DRASTIC-N). J Environ Manage. 277:111330.
- Wagh V, Mukate S, Muley A, Kadam A, Panaskar D, Varade A. 2020. Study of groundwater contamination and drinking suitability in basaltic terrain of Maharashtra, India through PIG and multivariate statistical techniques. J Water Supply Res Technol. 69(4):398–414.
- Wagh VM, Mukate SV, Panaskar DB, Muley AA, Sahu UL. 2019. Study of groundwater hydrochemistry and drinking suitability through water quality index (WQI) modelling in Kadava river basin India. SN Appl Sci. 1(10):1251.
- Ward JH. 1963. Hierarchical grouping to optimize an objective function. J Am Stat Assoc. 58(301):236–244.
- Weber-Scan PK, Duffy LK. 2007. Effects of total dissolved solids on aquatic organism: a review of literature and recommendation for salmonid species. American J of Environmental Sciences. 3(1):1–6.
- Wetzel RG. 1983. Limnology, 2nd ed., p. 767 Philadelphia: Saunders College Publishing.
- WHO (World Health Organization). 2004. Sulfate in Drinking-water: background document for development of WHO guidelines for drinking-water quality. World Health Organization. (WHO/SDE/WSH/03.04/114):16p.
- WHO (World Health Organization). 2008. Guidelines for drinking water quality: second addendum. Recommendations.Vol. 1. Geneva: World Health Organization
- WHO (World Health Organization). 2017. Guidelines for drinking water quality, 3rd Edn. Geneva: World Health Organization.
- Zeman C, Beltz L, Linda M, Maddux J, Depken D, Orr J, Theran P. 2011. New questions and insights into nitrate/nitrite and human health effects: a retrospective cohort study of private well users’ immunological and wellness status. J Environ Health. 74(4):8–18.
- Zhang M, Huang G, Liu C, Zhang Y, Chen Z, Wang J. 2020. Distributions and origins of nitrate, nitrite, and ammonium in various aquifers in an urbanized coastal area, south China. J Hydrol. 582:124528.