
 ?Mathematical formulae have been encoded as MathML and are displayed in this HTML version using MathJax in order to improve their display. Uncheck the box to turn MathJax off. This feature requires Javascript. Click on a formula to zoom.
Abstract
Soil erosion is a worldwide problem leading to loss of nutrient rich top soil resulting in reduction of agricultural productivity that threatens the livelihood of agrarian societies. Assessment of soil loss due to water-induced erosion using Models is essential to quantify and map erosion prone areas for possible application of soil conservation measures. In the current study, GIS, RS, and USLE model were integrated with the aim to quantify LULC classes, estimate soil loss rates, and identify priority areas for conservation in the Lake Hawassa Watershed for the two temporal instants, 1975 and 2020. The use of thematic recoding and model maker during LULC classification process has improved the accuracy of thematic classes, producing more than 89% for both classified images. The LULC change analysis showed that agricultural land and built-up area expanded by 0.44% and 15.26% per annum, respectively over the last 45 years. The declines in vegetation cover coupled with steep slopes have contributed to the increase in soil loss from 1975 to 2020 by 65%. The model estimated annual soil erosion rate in 1975 that ranged from nil to 158.77 t ha−1 yr−1 with a mean annual soil loss rate of 25.16 t ha−1 yr−1. Likewise, the annual soil loss estimated for the year 2020 varied from zero to 262.48 t ha−1 yr−1 with a mean annual soil loss rate of 28.20 t ha−1 yr−1. Generally, a total of 23,580.59 and 27,783.35 tons of soil have been lost per annum for the year 1975 and 2020, respectively, which is a direct reflection of vegetation clearance. The identified highest three severity classes combined accounted for 50.54% in 1975 and 55.40% of the entire soil loss in 2020 and these losses occurred on areas less than 2% in both 1975 and 2020 periods. Besides, 23.48% and 31.04% of soil loss rates exceeded the established tolerable limit of soil loss for the study area. The integrated use of USLE model, GIS and RS have identified erosion risk areas that could help apply conservation measures.
1. Introduction
Water erosion is the main cause of soil degradation (Efe et al. Citation2008; Bekele and Gemi Citation2021) and about 80% of the world’s agricultural land suffers from moderate to severe erosion (Ritchie et al. Citation2005) and it is one of the biggest threats to agricultural productivity in Ethiopian highlands (ibid.). Of the total global agricultural soil degradation, water erosion accounts for 56% of the observed damage (Gashaw et al. Citation2017). Soil erosion by water has been challenging and continuous problem in Ethiopia for decades (Hurni Citation1988) and land degradation in this country accounts for 8% of the global total, the most series problem being the removal of fertile topsoil by water (Ayalew and Selassie Citation2015). Water and soil are vital natural resources to maintain environment and livelihoods of humankind, particularly for countries with agrarian economy like that of Ethiopia. Mainly, water is at the heart of most efforts to address economic growth, energy production, human health, food security, and poverty reduction (Berhanu et al. Citation2013). On the other hand, when the raindrops, which are the major sources of water, fall on a soil devoid of vegetation, the water becomes trouble. Hence, land with no vegetation cover to control soil erosion by reducing the direct impacts of raindrops and the velocity of runoff will always be vulnerable to erosion (Qiang et al. Citation2016; Negese Citation2021). According to the Ethiopian highland reclamation study report, 27 million ha or almost 50% of the highland areas were eroded, 14 million ha seriously and over 2 million ha has become beyond reclamation level (Assefa et al. Citation2015; Bekele and Gemi Citation2021).
As in most tropical developing nations, the unsustainable and exploitative land use practices have accelerated soil erosion in many parts of Ethiopia (Shiferaw Citation2011; Tessema et al. Citation2020) reducing the protective plant cover and exposing the topsoil to high-intensity rainfall. Besides, the dependency of majority of population in Ethiopia on rain fed farming coupled with population pressure, overgrazing, and deforestation have led to accelerated erosion and land degradation. In the highlands of Ethiopia, which carry the highest density of population, soil loss rates on single fields are up to 300 t/ha/year, where rainfall erosivities are highest (Hurni Citation1993). Soil loss rates are highest from cultivated land, the country average being 42 t/ha/year (Hurni Citation1993; Shiferaw Citation2011) and the resulting annual production loss due to soil loss is estimated to be in the order of 2% (ibid.).
The empirical analysis of previous studies confirmed that the mean annual erosion rate of the study watershed was high, 37 t ha−1yr−1 (Degife et al. Citation2021), however, the soil erosion rate could be much higher where wide and deep gullies are formed. The change in land use and land cover in Ethiopia also played a substantial role in changing hydrological processes such as an increase in surface runoff volumes, reduction of infiltration, and reduction of groundwater recharge in the country (Tesfaye et al. Citation2017; Negese et al. Citation2021). Furthermore, LULC change is one of the factors responsible for the sedimentation or siltation of lakes in the country at large and in the Lake Hawassa Watershed in particular. The extinction of Lake Cheleleka with an area of about 12 km2 in 1972, estimated average depth of 5 m and a storage volume of ca. 60 × 106 m3 (Ayenew Citation2004) due to runoff and sedimentation is a manifestation of LULC changes.
To solve the soil degradation problems, wider conservation programs were launched in Ethiopia, after 1970s and 1980s (Bewket Citation2007; Tessema et al. Citation2020). Consequently, vast areas have been covered with terraces and millions of trees have been planted in different parts of the country. However, this has not solved the problem of land degradation and the success rate has been minimal (Desta et al. Citation2005). The reasons for failure are owed to poor watershed management approaches that were especially focussed on physical soil and water conservation practices, which are not based on scientific reasoning like constructing structures without determining the amount of runoff expected (Adimassu et al. Citation2014). To minimize soil degradation, we need to identify areas with high risk of soil erosion using soil erosion models and thereby use the results to plan and implement the best-suited soil conservation measures.
Currently, there are many models around the world used to estimate soil erosion by runoff, which incorporate the topographic features with land use and soil characteristics with Geographic Information System (GIS) and Remote Sensing (RS) (Star et al. Citation1997). Among the various erosion models developed globally, Universal Soil Loss Equation (USLE) (Wischmeier and Smith Citation1978; Balabathina et al. Citation2020) and its Revised Universal Soil Loss Equation (RUSLE) are the most widely used erosion prediction models (Masha et al. Citation2021). The USLE model has been widely used as it combines the impact of climate, soil, topography and land use on soil loss with limited data (Wischmeier and Smith Citation1978; Bekele and Gemi Citation2021). USLE in its original form does not predict spatial erosion risk status, which was the major limitation of this model. However, integrating the model with GIS had solved this limitation (Fistikoglu and Harmancioglu Citation2002) and it became a viable option to estimate soil erosion. Considering the effectiveness of integrating erosion models with GIS and RS, many researchers quantified the rate and severity of soil erosion worldwide and in Southern Ethiopia (Oliveira et al. Citation2015; Wolka et al. Citation2015; Marondedze and Schütt Citation2020).
Soil erosion studies have been widely conducted in Ethiopia, however, estimation of spatially distributed soil erosion on grid cell basis and micro units has not been adequately addressed (Balabathina et al. Citation2020). Similarly, in spite of the presence of erosion in the present study area, the rate of soil loss and its spatial patterns are poorly understood. The study conducted in the Watershed by Wolka et al. (Citation2015) covers only the Lake Cheleleka wetland, which is about 5% of the current study area extent. Therefore, the present study has been initiated to estimate the soil loss rate in the Lake Hawassa Watershed by integrating USLE Model, GIS and RS techniques. The study objectives are to (i) classify remote sensing data from two points in time and map LULC classes, (ii) estimate soil loss rate in the watershed using USLE factors, (iii) develop the spatial pattern of erosion severity map, and (iv) recommend possible management measures for optimal soil conservation intervention. We believe that the soil loss estimates and erosion prone area maps provided a clear understanding of the erosion processes at landscape level and the results will guide methodological decision-making and enable conservation planners to protect the watershed from further damage.
2. Materials and methods
2.1. Description of the study area
The study area is part of the Great Ethiopian Rift Valley and it is located 275 km south of the Capital City, Addis Ababa, along the high way to Moyale, Kenya. The Lake Hawassa watershed is geographically located between 6° 49′ and 7° 14′ N latitude and 38° 17′ and 38° 44′ E longitude and it covers an area of 1302.94 km2. It constitutes seven districts, of which four districts (19.17%) fall under Oromia Region while the remaining three districts (80.83%) fall under the newly established Sidama Regional State.
Ethiopia is located in the region where the main rainy season is from June through September. However, Lake Hawassa watershed () has even more extended period of wet season (March to October) with mean monthly rainfall varying from 85 to 133 mm (Gebreegziabher Citation2004). The mean annual precipitation based on 15 to 56 years of recorded meteorological data amounts to 955.85 mm.
Figure 1. Map showing location of the study area.
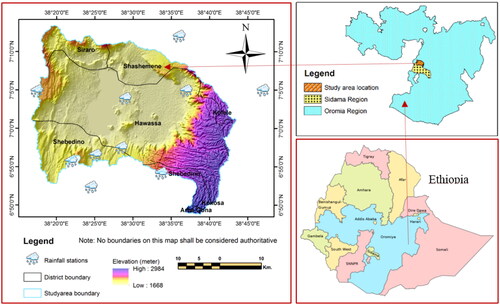
Topography of the area exhibits flat low-lying plains, steep hills, and dissected rolling land features with an altitude ranging from 1668 to 2984 m above mean sea level. The mean annual temperature of the area varies from 12.5 to 26.01 °C as computed from the meteorological data recorded for ten years in Hawassa and Wondo Genet stations (Wondrade et al. Citation2014).
The major LULC of this area is agriculture, which constitutes nearly 60% of the entire watershed with the projected human population of 1,103,507 (Wondrade et al. Citation2016). The vegetation cover is mainly characterized by natural and plantation forest, at Abaro Mountain, the scrubland located at the northwestern part of the watershed serving as a sanctuary to shelter Swayne’s Hartebeest, and woody vegetation mostly found in the eastern part. Settlement is heavily expanding all over the study area including in the wetland. Currently there are more than 1000 thatched houses illegally built in the wetland indicating the expansion of settlement in the study watershed. Natural forest on the Wondo Genet escarpments have always been under continued threat due to illegal logging, settlement and agricultural expansion, demand for firewood and construction materials. Particularly, northern and northwestern part of the watershed represents the border between Oromia and Sidama Region, where vegetation cover has been depleted leading to severe erosion, which requires establishment of inter-regional collaboration to thwart further threats to ecosystem and thereby reduce erosion risk.
An overlapping pair of calderas namely, Hawassa and Corbeti containing Lake Cheleleka and Hawassa geologically characterizes the study area. The Caldera complex forms a giant elliptical depression 30–40 km wide on the rift floor (Gebreegziabher Citation2004). The watershed was formed during the tertiary uplifting following the regression of the Mesozoic Sea towards the southeast. The uplifting was associated with the intrusion of basaltic magma through fissures. Later tectonics and geomorphic processes resulted with the present shape of the area (Eshete Citation2009). The majority of the watershed, the flat caldera floor, is composed of lacustrine sediments of Pleistocene age and the north-west part of the study areas are composed of pumice, un-welded tuffs, obsidian and pitchstone, while the hills and the steep escarpment to the north of Lake Cheleleka are rhyolitic and trachytic lava flows (Belete et al. Citation2013). The hills of eastern escarpment are composed of Nazret silicic volcanic comprising ignimbrites, un-welded tuffs, ash flows, rhyolites and trachyte, while hilly lands in the east are underlain by rocks of the Dino formation comprising ignimbrites, tuffs, water lain pyroclastic and occasional lacustrine beds (ibid.).
2.2. Data types and sources
The process of soil erosion by water is a complicated system controlled by a multitude of factors comprising LULC, slope of the terrain, climate condition, soil characteristics, conservation practices and interaction between them (Yesuph and Dagnew Citation2019). Hence, the estimation of soil loss due to erosion requires several data related to these factors. The data required for this study were collected from different sources. Shuttle Radar Topography Mission (SRTM) DEM with a grid resolution of 30 m × 30 m, Landsat 1 satellite image with MSS sensor, and Sentinel 2 A-MSI were downloaded from Earth Explorer, US Geological Survey website, http://www.earthexplorer.usgs.gov. Long-term rainfall data from 11 rain gauge stations found within and in close proximity to the study watershed that ranges from 15 to 56 years were acquired from the National Meteorological Agency of Ethiopia ().
Table 1. Rainfall stations and their corresponding mean annual precipitation.
To identify the major soil types covering the Lake Hawassa watershed and compute K-Factor, digital soil map of the world published by Food and Agriculture Organization-United Nations Educational, Scientific and Cultural Organization (FAO-UNESCO Citation1974) was used. The soil map was obtained from Oromia Agricultural Bureau.
2.3. Image data sets and pre-processing
Image datasets were selected based on the available images covering our study area and the amount of funding at our disposal. Accordingly, two satellite images were used in the current study: The first image was Landsat1 acquired on 27 October 1975 and the second was Sentinel-2A acquired on 19 November 2020. The latter is a product of European Space Agency (ESA), but both images were downloaded from Earth Explorer, US Geological Survey website http://www.earthexplorer.usgs.gov. Such images have been used for LULC change analysis in similar scenario (Aneseyee et al. Citation2019; Eisenberg and Muvundja Citation2020). Both images that cover our area were cloud cover free and acquired during the same vegetation season not to affect the classification result (Congalton and Green Citation2009). The two images were checked for geometric correctness with the scanned and mosaicked reference topographic map prepared for spatial compatibility and both images were projected to Universal Transverse Mercator (UTM), Zone 37 North. As part of image pre-processing, the reflective spectral bands of Landsat1-MSS: 4(green), 5(red), 6(NIR), and 7(NIR) with a pixel size of 60 m × 60 m and the reflective bands of Sentinel-2A-MSI: 2(blue), 3(Green), 4(red), 8(NIR), and 12(SWIR) with a pixel size of 10 m × 10 m were stacked into one multi-band image. The SWIR band of Sentinel-2A image was resampled from 20 m to 10 m to match the other bands during stacking process. Part of each raster image data covering an area including DEM was then extracted by importing shapefile of the study area in Erdas Imagine Software Version 2014 to make it readily available for classification. However, before classification, an appropriate classification scheme has to be devised. Such classification scheme should be mutually exclusive and given due attention (Congalton and Green Citation1993; Wondrade et al. Citation2014). Since there is no one ideal classification of LULC and considering the heterogeneous character of the landscape, LULC types identifiable by remote sensing are organized on the basis of modified USGS Level I classification scheme (Jensen Citation2005). Based on the defined classification scheme, the area was described into nine LULC classes ().
Table 2. LULC classification scheme.
2.4. Image classification and accuracy assessment
Perhaps the most basic form of LULC analysis within the field of remote sensing is LULC classification, which involves the association of features within remotely sensed imagery with specific LULC maps (Aplin Citation2004; Wondrade et al. Citation2014). Classifying most African landscapes including the current study area is particularly challenging because of the heterogeneous biophysical features captured by remote sensing instrument and fragmented land-holding system. Classification of the images was performed based on the classes defined in the classification scheme using Supervised (Maximum Likelihood) classification algorithm available in Erdas Imagine software version 2014. Besides, Thematic Recode and Model Maker image correction tools in Erdas Imagine were used to minimize misclassification errors in each thematic class. Supervised classification method demands the need to use training areas to train the computer algorithm the brightness values that will represent one category of LULC in each band of the digital image (Wondrade et al. Citation2014) having in mind a set of desired classes. Training samples were collected from ancillary data such as mosaic of topographical map sheets from 1976, 1978 and 1979, and aerial photographs from 1972/73 for the Landsat image acquired in 1975. For the image acquired in 2020, training areas were selected from google earth image of 2020. To ensure representativeness of the spectral signature of the LULC class to be discerned, each training area ranges in size from few to large number of pixels. Accordingly, 385 and 1186 training areas were used for the image in 1975 and 2020, respectively.
The overall classification of remotely sensed data cannot be 100 percent accurate as errors originate from different sources including the classification algorithm itself (Smits et al. Citation1999; Okeke and Karnieli Citation2006). Before using the classified thematic maps for post-processing, one has to know the accuracy of the classification results. Thus, in remote sensing, accuracy assessment is mandatory (Foody Citation2002; Okeke and Karnieli Citation2006) and is important for providing information about the quality of the produced classification result. The process of accuracy assessment was performed in Erdas Imagine software version 2014 by collecting 309 and 809 reference points for the image in 1975 and 2020, respectively. The reference points were generated by stratified random sampling method using topographical maps, aerial photo, and google earth image as a reference data. The collected reference points were compared with the classified image in an error matrix (Foody Citation2002; Congalton and Green 2009) to check the level of classification accuracy. This will produce accuracy measures that will enable us to accept or reject the classification results.
Besides, the average temporal and annual rates of LULC change dynamicity were estimated for the purpose of comparison. The annual rates of change were computed by dividing the temporal rates of change by the number of years in the interval (Zhang et al. Citation2010; Wondrade et al. Citation2016), which is calculated based on the following formula: and
where
are the annual and temporal change rates of the LULC class in question, respectively. While
are the area of the target LULC class at the current and previous study points in time, respectively, and
is the length of the study period measured in the unit of years.
2.5. Soil erosion model and estimation of soil loss
There are different models used to estimate soil erosion in watershed and such models vary based on the ease with which they are applied and the input data they demand to predict soil loss due to erosion. The Universal Soil Loss Equation (USLE) model proposed by Wischmeier and Smith (Citation1978) is the most widely used model in different countries. The reason for the popularity of USLE model is that it is a good compromise between applicability in terms of required input data and relatively good reliability of obtainable soil loss estimates (Alewell et al. Citation2019). The model was developed ‘to compute long time average soil losses from sheet and rill erosion’, while considering numerous physical and management variables (Wischmeier and Smith Citation1978; Eisenberg and Muvundja Citation2020). The model, integrated with GIS and RS, was applied for the estimation of soil erosion in the study watershed. It estimates the annual soil loss rate in ton/hectare/year by multiplying the respective USLE factor values (R, K, LS, C, and P) as per the recommendations of Wischmeier and Smith (Citation1978), Hurni (Citation1985) and Belay et al. (Citation2020) (EquationEq. (1)(1)
(1) ). Each factor is a numerical estimate, which indicates how an area is affected by soil erosion.
(1)
(1)
where A is mean annual soil loss in tons per hectare per year (t ha−1yr–1), R is the rain fall runoff erosivity factor in MegaJoule Millimeter per hectare per hour per year (MJ mm ha−1 h−1 yr−1), K is the soil erodibility factor in tons hour per MegaJoule per Millimeter (t*h MJ−1 mm−1), LS is slope length and steepness factor (unitless), C is the cover and management factor (unitless), and P is the support practice factor (unitless).
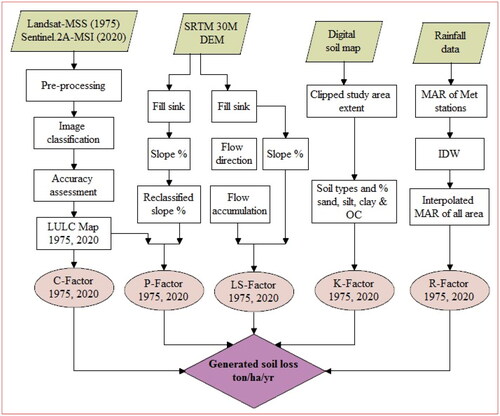
The USLE model was implemented on a cell-by-cell basis using Spatial Analyst Tool, Map Algebra, and Raster Calculator in ArcGIS 10.1 environment to investigate soil loss (Hurni Citation1985; Yesuph and Dagnew Citation2019). The flow chart of the methods used to estimate soil erosion rate is depicted in .
Figure 2. Flow chart of the methodology.
2.5.1. Rainfall runoff erosivity factor (R)
Rainfall-runoff erosivity is the primary factor causing soil erosion and accounts for about 80% of the soil loss (Gezahegn and Arus Citation2020). Erosivity of rain is the product of storm kinetic energy (KE) and maximum 30-min intensity (EI30) (Wischmeier and Smith Citation1978; Renard et al. Citation1997). However, the data on rainfall kinetic energy and rainfall intensity are not available in our study area to compute rainfall erosivity. In this study, we calculated the annual rainfall erosivity using the empirical Equationequation (2)(2)
(2) utilized by Bagegnehu et al. (Citation2019) and applied by other researchers (Bagegnehu et al. Citation2019; Bekele and Gemi Citation2021) in Ethiopia. The R factor value was calculated in GIS Environment based on mean yearly precipitation for the period 1965–2020.
(2)
(2)
where P is mean annual precipitation
Rainfall data from 11 rain gauge stations were used to estimate the rainfall erosivity (R) in the watershed. The missing rainfall data for all areas were filled in using Inverse Distance Weighting (IDW) interpolation method using the tool available in ArcGIS 10.1.
2.5.2. Soil erodibility (K)
Soil erodibility factor (K) is the average soil loss for a specified soil and it is a measure of the susceptibility of soil particles to detachment and transport by raindrop impact and runoff (Wischmeier and Smith Citation1978; Chadli Citation2016). All equations for determining K factor are associated to soil organic matter, soil texture, and percentage of sand, silt, and clay in soil (Basri et al. Citation2019). The observed data of the local soil properties in the Lake Hawassa Watershed are not available. Hence, the major soil types for soil erodibility analysis were extracted from digital soil map in a vector format. The data on soil properties were analyzed following the methods used by several authors (Chadli Citation2016; Chuenchum et al. Citation2019; Eisenberg and Muvundja Citation2020), in which the soil erodibility factors of USLE were calculated using percentages of silt, clay, sand and organic carbon fractions (EquationEqs. (3)–(7)).
(3)
(3)
(4)
(4)
(5)
(5)
(6)
(6)
(7)
(7)
where fcsand is the function of high-coarse sand content in soil; fcl-si is the function of clay and silt in soil; forgC is the function of organic carbon content in soil; fhisand is the function of high sand content in soil; ms is the percentage of sand fraction content (particles with diameters from 0.05 to 2mm)%; msilt is the percentage of silt fraction content (particles with diameters from 0.002 to 0.05 mm)%; mc is the percentage of clay fraction content (particles with diameters of <0.002)%; and orgC is the percentage of organic carbon content of the layer (%).
K-Factor values were assigned for each soil type (), and the soil map with K values was converted to raster format in ArcGIS 10.1 software package for further processing. The areas of each soil units were calculated and shown in . Here it has to be noted that the only difference of area in 1975 and 2020 was in water body and swamp classes. The areas of water body and swamp written in brackets are for the year 2020 and this happened for the reason that the area, which was water in 1975, has been converted into swamp (Gh) in 2020.
Table 3. The major soil types identified in the Lake Hawassa Watershed.
2.5.3. Slope length and steepness (LS) factor
Slope length and slope steepness are topographic factors that represent the effect of both slope length (L) and slope steepness (S) on soil erosion. LS is defined as the estimated ratio of soil loss per unit area from a field slope to soil loss from a 22.13 m length of uniform 9% slope (Wischmeier and Smith Citation1978; Balabathina et al. Citation2020). The slope length L is defined as the distance between the upslope starting point of a slope segment to the downslope point where deposition begins (Panagos et al. Citation2015; Marondedze and Schütt Citation2020). Increasing slope length and steepness per unit area results in increased runoff and flow velocity and consequently in increased soil loss (Desmet and Govers Citation1996). Numerous methods were proposed to calculate the combined LS factor for complex terrain over the past few decades (Desmet and Govers Citation1996; Zhang et al. Citation2013). However, a simplified equation suggested by several authors (Wischmeier and Smith Citation1978; Gashaw et al. Citation2017; Girmay et al. Citation2020; Tessema et al. Citation2020) using a unit contributing area to calculate the LS was used in the current study (EquationEq. (8)(8)
(8) ).
(8)
(8)
where
is slope length (m), and it is the product of flow accumulation and cell value,
is a variable slope-length exponent that depends on slope steepness,
is slope gradient in percentage, cell value is the resolution of the DEM used.
if the % slope is 5 or more, 0.4 on slopes of 3.5 to 4.5%, 0.3 on slopes of 1 to 3%, and 0.2 on uniform gradients of less than 1%.
In this study, the SRTM-DEM with grid cell size of 30 m × 30 m, that was obtained from usgs.gov website was used. The flow accumulation and LS factor were calculated and mapped as a raster layer from DEM using hydrology toolset found in ArcGIS Spatial Analyst Tool box.
2.5.4. Cover and management (C) factor
The cover and management (C) factor represents the ratio of soil loss from land with specific vegetation to the corresponding soil loss from clean-tilled, continuous fallow conditions (Wischmeier and Smith Citation1978; Morgan Citation2005; Gelagay and Minale Citation2016). The cover management is a dimensionless factor that ranges from 0 for a completely non-erodible condition in areas with high vegetation cover to 1 which corresponds to the greater magnitude of soil loss due to very extensive tillage that produces much runoff (Renard et al. Citation1997; Woldemariam et al. Citation2018). The vegetation type, stage of growth, and canopy percentage conditions mainly affect the value of C factor (Hagos Citation2020).
Due to spatial and temporal variations, many studies used remote sensing data to classify LULC classes for quantification of C values (Beskow et al. Citation2009; Molla and Sisheber Citation2017). The procedure for classification and analysis of satellite images to generate LULC classes is given in Sec. 2.4. The values of C factor for each LULC classes were obtained from published tables (). Then, the corresponding C factor value of each LULC class was assigned based on the literature recommendation in the highlands of Ethiopia (Yesuph and Dagnew Citation2019).
Table 4. LULC classes and values of C factor adopted from published sources.
2.5.5. Support practice (P) factor
The support practice (P) factor is the ratio of soil loss with a specific conservation practice like contouring, strip-cropping, or terracing measures to the corresponding loss with straight-row farming up and down the slope (Wischmeier and Smith Citation1978; Gashaw et al. Citation2017). The P factor ranges between 0 and 1, where the value closer to 0 shows good conservation practices and the values close to 1 shows little conservation practices (Ganasri and Ramesh Citation2016; Woldemariam et al. Citation2018).
The P factor could be mapped by collecting data from frequent field observation (Bewket and Teferi Citation2009; Amsalu and Mengaw Citation2014). However, in the Lake Hawassa Watershed, there were few attempts to construct conservation measures at limited locations, for which no complete data was found. Besides, the map of conserved areas was not available and hence the P factor was assessed using major LULC types and slope interaction as suggested by Wischmeier and Smith (Citation1978) and similar studies have been applied for Ethiopian conditions (Bewket and Teferi Citation2009; Gelagay and Minale Citation2016; Gashaw et al. Citation2017; Yesuph and Dagnew Citation2019; Negese et al. Citation2021). This method categorizes the study area into agricultural land and other lands. The agricultural lands are classified into six slope groups, converted to vector format and P-factor values were assigned, while P-Factor value of 1 was allocated to all non-agricultural lands (Gashaw et al. Citation2017) including agricultural lands with slope greater than hundred percent, if it exists (). The slope gradient ranges in percentage were generated from SRTM-DEM in ArcGIS environment, while the types of LULC classes were produced by classifying Landsat-MSS and Sentinel-2A-MSI satellite images. At the end, P factor was assigned by combining the LULC types and slope maps in a raster using Spatial Analyst Tools in ArcGIS 10.1.
Table 5. Slope classes and support practice (P) factor, (Wischmeier and Smith Citation1978).
3. Results and discussion
3.1. Accuracy assessment
Before using image classification results for further analysis, it is mandatory to assess their accuracy to evaluate the percentage of pixels classified correctly and incorrectly per LULC cluster (Foody Citation2002; Okeke and Karnieli Citation2006; Wondrade et al. Citation2014). One of the most common ways of representing accuracy assessment information is in the form of an error matrix or contingency table (Congalton Citation1991; Congalton and Green Citation1993; Smits et al. Citation1999; Congalton Citation2001; Okeke and Karnieli Citation2006). Error matrix provides a detailed assessment of the agreement between the sample reference data and classification data at specific locations, together with a complete description of the misclassifications registered for each category (ibid.). According to Congalton (Citation1991) and Congalton and Green (Citation2009), the use of classification measures such as overall accuracy, Kappa statistics, producer’s accuracy, and user’s accuracy is quite common and all accuracy measures are acceptable if greater than 85%.
The result of accuracy assessment for the image in 1973 and 2020 indicated an overall accuracy of 89.97 and 92.83%, respectively, while corresponding kappa statistics of 88.47 and 91.64% for Landsat-MSS and Sentinel-2A-MSI, respectively. The accuracy measures generated by Erdas Imagine software 2014 are presented in .
Table 6. Accuracy assessment results of the classified images.
The producer’s accuracies (PA) in the classified maps of 1975 and 2020 were 72–96%, and 88–96%, respectively, while the user’s accuracies (UA) were greater than 80% for a Landsat image and greater than 90% for the Sentinel image. Overall kappa coefficients were all greater than 0.88 showing a strong agreement between the remotely sensed classification and reference data. Though the achieved accuracy measures were reasonable, there were some misclassifications as expected. Such misclassifications were observed in built-up and agricultural land, which could be attributed to difficulties to discern pixels with mixed spectral signatures. The classification error in the thematic map generated from Landsat could also be due to course spatial resolution. Spectral confusions were also noted in woody vegetation and grassland classes.
3.2. Spatial pattern and dynamics of LULC changes
The spatial pattern and extent of LULC classes play a significant role in reducing raindrop impacts on soil particles (Belay et al. Citation2020). Tropical regions with poor surface cover are highly susceptible to soil erosion and consequent soil loss following rainfall. As the result of classification, nine LULC classes were identified using supervised maximum likelihood classification algorithm () augmented by field observation and ancillary data. The spatial pattern and magnitude of LULC classes extracted from classified images () revealed that agricultural land was the most dominant in the study watershed in both 1975 and 2020. Agricultural land covered 44.79% (583.86 km2) and 53.75% (700.36 km2) area in 1975 and 2020, respectively. For agricultural domain in Africa, Brink and Eva (Brink and Eva Citation2009) analyzed a 57% increase from the year 1975 to 2000. Similar studies conducted in the highlands of Ethiopia indicated an increase in agricultural land from 43–57% (Ali et al. Citation2011) and 47.9–64.4% (Gezahegn and Arus Citation2020). Study from the same watershed conducted between 1973 and 2011 also recorded an increase in agricultural land from 43.6 to 56.4% (Wondrade et al. Citation2014). This shows that agricultural expansion is at a decelerating rate as other land to be converted into agriculture is becoming scarce and agricultural land is losing its area too. The annual rate of change in agricultural land for the current study between 1975 and 2020 was estimated at 0.44%. The main reasons for land resource degradation and particularly agricultural expansion can be attributed to factors such as population pressure (currently growing at a rate of 2.5%), migration and resettlement, environmental pollution, the change in climate, and rapid change in the lifestyle of people among others (Wassie Citation2020). The population density of the area was predicted to be 870 persons per square kilometre in 2013, which is much higher than the regional and country average (141 and 84.47 persons per square kilometer) for the same year, respectively (Wolka et al. Citation2015).
Figure 3. LULC maps of the study watershed.
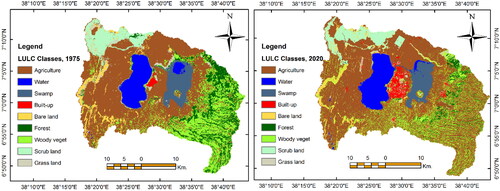
Table 7. Spatial coverage and proportion of LULC classes and change pattern.
A close examination of other lands also revealed that woody vegetation was with the second highest coverage in both classified images, followed by forest in 1975 and water body in 2020. Forest cover declined from 10.53% in 1975 to 4.21% in 2020, while woody vegetation declined at a rate of −1.33% between the two temporal instants. The decline in forest class could have been much more, if it was not for the farmers who are growing Eucalyptus and other trees on their farmsteads to overcome the shortage of construction materials and fuelwood. Of the three LULC classes that increased throughout the study period, viz., built-up, agricultural land, and water body, built-up area increased by 686.72% between 1975 and 2020, which is the highest temporal growth rate recorded between the two dates. Driven by a constantly accelerating urban population in recent decades, urbanization has become one of the most dynamic processes in the context of global land cover transformations and land resource degradation (Bhandari Citation2010; Wondrade et al. Citation2016). Such urban expansion processes are occurring at the expense of green spaces. The promotion of Hawassa City as a political centre of the Southern Nations, Nationalities, and People’s Regional State (SNNPRS) and encouraging investment endeavours demonstrated by the establishment of huge industrial parks coupled with the recent upgrading of Sidama Zone to Regional State have contributed to the expansion of built-up area at an annual rate of 15.26%. As presented in the LULC maps of the study area, water body has shown a positive change in area (98.60 km2 from 1975 to 100.43 km2 in 2020), which is accounted for the surface area expansion of Lake Hawassa despite the conversion of Lake Cheleleka into mudflat swamp area. Lake Cheleleka, which serves as natural trap, has been progressively silted-up over the past nearly four decades at a rate of about 2.25% per annum (Dadi Citation2020), showing the presence of erosion in the area. The descent in swamp area has shown not only the effect of intensive anthropogenic activities, but also a serious threat to the sustainability of the wetland ecosystem.
Bare land cover declined at an annual rate of −0.51% from 1975 to 2020 due to population pressure and expansion of rain fed agriculture, which elevates land demand and leads to the encroachment to marginal lands that are not suitable for farming. Onsite observations also showed that large extents of bare lands are more prevalent in the western part of the study area and these areas were exposed to gully formations due to erosion. Uncontrolled quarrying of construction materials as a source of instant cash have also led to a wide spread clearance of vegetation cover and soil degradation. Scrubland was the area restricted as Swayne’s Hartebeest Sanctuary, which is located in the northwestern part of the study watershed. However, the area declined from 80.25 km2 in 1975 to 75.02 km2 in 2020 because of the disturbance imposed by individual intruders and encroaching settlers. Today it is common to see the Swayne’s Hartebeests and domestic animals grazing in unison suppressing the vegetation growth and affecting the wildlife. Grassland occupied the smallest area in 2020 and the second smallest in 1975 next to built-up area. The area of grassland cover has declined at an annual rate of −0.69% between 1975 and 2020. Grassland, which was found in the northern part of the study area in 1975 have visibly been converted into farmland in 2020.
3.3. USLE factors and raster maps
3.3.1. Rainfall erosivity (R) factor
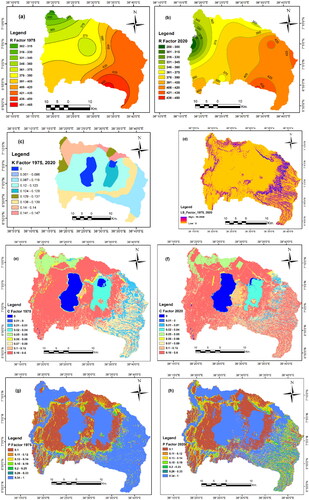
To estimate the erosivity of the study watershed, mean annual precipitation data of 6 and 11 stations were used for 1975 and 2020, respectively. The result of IDW indicated that the mean annual rainfall ranged from 706.41 to 1123.74 mm for 1975 and from 667.02 to 1080.18 mm for the 2020 study periods. The result revealed that eastern part of the study area receives the highest rainfall. It was found that the long-term erosivity values ranged from 302 to 465 and 288 to 450 MJmmha−1 h−1 yr−1 ( and ) for the year 1975 and 2020, respectively. The heaviest rainfall for the study area occurs in the eastern part and it gradually decreases towards the west. It was observed that elevated areas are with more rainfall and consequently induces more erosion due to runoff. Although the rainfall erosivity values of the current study watershed is less than the global average, which is 2000 MJmmh−1 ha−1yr−1, the amount of soil loss generated by R factor is substantial (Borrelli et al. Citation2017; Kidane et al. Citation2019). Other studies (Ganasri and Ramesh Citation2016; Kidane et al. Citation2019) also recorded that of the USLE factors, soil erosion rate is more sensitive to rainfall.
Figure 4. Maps of USLE factors in 1975 and 2020: (a, b) rainfall erosivity (R) factors; (c) soil erodibility (K) factor; (d) slope length and steepness (LS) factor; (e, f) cover and management (C) factors; (g, h) support practice (P) factors in the Lake Hawassa Watershed.
3.3.2. Soil erodibility (K) factor
The erodibility of soil is an expression of its inherent resistance to particle detachment and transport by rainfall, which may depend on the presence of vegetation cover and the erodibility factor (K) of the different soil types. K factors of Ethiopia were computed and the values ranged from 0 to 0.18 t h MJ−1mm−1 (Berhanu et al. Citation2013). The estimated K-factor values of the study watershed varied between 0.086 and 0.146 t h MJ−1 mm−1, the average being 0.127 t h MJ−1mm−1 showing erodibility of the study area is fairly low. This in turn indicates that the influence of soil factor in estimation of soil loss is relatively lower than other factors. Generally, eight types of soil units and water body were identified in the study watershed () and the dominant soil type was Eutric Fluvisols followed by Chromic Luvisols and Orthic Luvisols covering an area of 478.45, 229.38, and 215.42 km2, respectively. The erodibility map () shows that Vitric Andosols, Chromic Vertisols, and Lithosols are more vulnerable to soil erosion, with K-factor values of 0.147, 0.140, and 0.139, respectively. These types of soil units were found in Shashemene and Siraro districts, where vegetation cover is highly affected. Here, it has to be noted that K-factor map for the 1975 and 2020 are the same, except that the Lake Cheleleka has been converted into Swamp in the year 2020 and consequently the soil unit is merged with Umbric Gleyosols. The result also revealed that Eutric Fluvisols covered about 37% of the study area, which is predominantly agricultural land.
3.3.3. Slope length and steepness (LS) factor
The LS factor map and flow accumulation were generated using void filled SRTM-DEM with 30mx30m grid cells, while the LS factor was computed using Map Algebra-Raster Calculator of Spatial Analyst Tool in ArcGIS 10.1 environment. The result revealed that the LS factor values ranged from 0 in areas with flat terrain including waterbody to 18.28 in steep slope areas (). Findings of the current study also corroborates with other previous Ethiopian highland study reports (Tessema et al. Citation2020; Negese et al. Citation2021). The LS factor was higher in the highland areas, predominantly in the eastern part and along hillsides of the watershed and it is low in the central part due to the flat topography of the terrain. The distribution of LS factor showed that about 99.9% of the watershed corresponds to a LS factor value of less than three. About 50% of the study area (652.36 km2) lies with slope ≤5% (which ranges from flat to gently sloping according to FAO (FAO-UN Citation2006) slope classification). A relatively small variation of slope length and steepness factor could be accounted for the 50% flat and nearly flat terrain of the watershed.
3.3.4. Cover and management (C) factor
The LULC map of the watershed was generated from satellite images of 1975 and 2020 using Erdas Imagine 2014 Software. The classified LULC change trend indicated that the study watershed experienced substantial changes, which affects the cover and management (C) factor. The values of C factor in the watershed ranges from 0.003 to 0.6 () on terrestrial body, the lowest value being assigned to forest and the highest to bare land. The high value of C factor is associated with the area void of vegetation and prone to more soil erosion. Although agricultural land has the greatest coverage in the 1975 and 2020 classified images (), vegetation cover and density in 1975 were better, compared to the coverage in 2020, which slowed down erosion process and consequently reduced soil loss rate in 1975. Compared to other LULC classes, bare land followed by agricultural land has higher C factor values and are more vulnerable to erosion risk. The C factor map ( and ) indicated that the western and most central part of the watershed are areas with high C factor values as these regions were occupied by agricultural and bare lands. These two LULC classes account for about 49% (635.09 km2) and 57% (739.94 km2) of the total study area in 1975 and 2020, respectively.
3.3.5. Support practice (P) factor
Discerned LULC classes and slope in percent were used to generate agricultural and non-agricultural/other lands in ArcGIS 10.1 software package. Since there were no available data on erosion control structures in the study area, P factor values suggested by Wischmeier and Smith (Citation1978) and Gelagay and Minale (Citation2016) were used in each classified agricultural lands and non-agricultural lands. LULC classes such as water, swamp, built-up, bare land, forest, scrub, woody vegetation, and grassland were considered as other lands. Other lands in vector format were assigned P factor value of 1 irrespective of their slope category, while agricultural land was classified into six slope classes and assigned their corresponding P factor values ranging from 0.1 to 0.33 (). Finally, maps in vector formats were converted into raster to produce P factor maps ( and ). The result indicated that agricultural land and other lands coverage in 1975 was 44.75 and 55.25%, respectively, while in 2020 agricultural land covered 54.23%, and other lands covered 45.77% of the entire study area. Most part of agricultural land falls under slope class of 0–5% covering an area of 437.71 km2. As illustrated by the P factor maps from 1975 and 2020, north eastern, central, and eastern part of the study watershed emerged as areas where support practices have not been in place. Such areas were mainly characterized by forest, woody vegetation; scrubland, grassland, and built-up area cover classes. Except waterbody and swamp areas, most of the areas with high P factor values are also with the highest slope class significantly contributing to soil erosion.
3.4. Soil erosion rate estimation and risk mapping
All USLE factors (R, K, LS, C, and P) were derived as raster layers with spatial resolution of 30x30m after processing the thematic layers of the factors (Balabathina et al. Citation2020). These raster layers were then overlaid and multiplied using Raster Calculator toolset in ArcGIS 10.1. The USLE model estimates the long-term average soil loss per hectare per year to determine the degree of erosion risk in the lake Hawassa Watershed. The mean soil loss of the watershed was calculated using Zonal Statistics as Table toolset found in Spatial Analyst Tool of ArcGIS 10.1.
The result revealed that the annual soil erosion rate due to rill and sheet erosion in 1975 ranged from 0 in areas with flat terrain to 158.77 t ha−1yr−1 ( and ) in steep slope areas with a mean annual soil loss rate of 25.16 t ha−1yr−1. The total estimated annual soil loss from the study area for the year 1975 was 23,580.59 t yr−1, which is a direct reflection of the wide spread clearance of vegetation cover. Similarly, the annual average soil loss estimated for the year 2020 ranged from zero in flat areas to 262.48 t ha−1yr−1 in areas with steeper slopes and hillsides with the mean annual soil loss rate of 28.20 t ha−1yr−1. A total of 27,783.35 tons of soil have been lost per annum for the year 2020 due to rill and sheet erosion (). However, the soil erosion rates in the study area could be much higher where wide and deep gullies are formed. The soil loss rates from this study are comparable to a mean soil loss rate of 29.9 t ha−1 yr−1 recently reported on soil loss due to rill and sheet erosion at national level based on 25 observation sites in different parts of the country (Haregeweyn et al. Citation2017; Molla and Sisheber Citation2017; Kidane et al. Citation2019). The estimated soil loss rates of the current study also corroborates with the findings of other similar studies, conducted in the highlands of Ethiopia, by Ayalew and Selassie (Citation2015); Kidane et al. (Citation2019) as well as Masha et al. (Citation2021), who estimated mean annual soil loss rates of 25.8 and 28.7, 24.95, and 29.62 t ha−1 yr−1, respectively. However, the mean annual soil loss of our study exceeded the maximum soil loss tolerance (18 t ha−1 yr−1) that permits economically sustainable crop productivity as stated for Ethiopian agricultural lands (Hurni Citation1985; Tamene et al. Citation2006; Degife et al. Citation2021; Tamene et al. Citation2022). In a similar pattern the soil loss rate estimated for our study watershed is higher than the soil loss tolerance (5–11 t ha−1 yr−1) reported for the Ethiopian highlands (Shiferaw Citation2011; Ayalew Citation2015; Bekele Citation2021). Soil erosion is a severe environmental and economic problem not only in developing countries, but also in several developed countries. Consequently, the most alarming scenario as reported by Kouli et al. (Citation2009) and Samela et al. (Citation2022) is that in areas with a slow rate of soil formation, any soil loss of above 1 t ha−1 yr−1 can be considered as irreversible with in a time span of 50–100 years in European condition. However, we are not able to locate studies of irreversible limit of soil loss rate for Ethiopian condition. Soil formation rates for Ethiopia ranges from 2 to 22 t ha−1 yr−1, while the soil formation rate established particularly for the Central Rift Valley Zone where our study area is located vary from 6–10 t ha−1 yr−1 (Hurni Citation1983).
Figure 5. Soil erosion risk map of the study watershed.
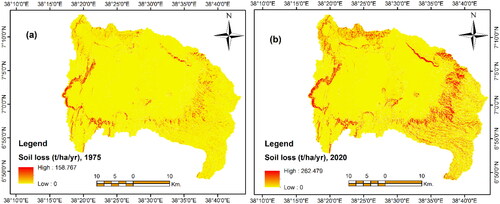
Table 8. Erosion severity class, area coverage, and proportion of soil loss.
The estimated results indicated that 23.48% and 31.04% of the soil loss rates exceeded the presumed tolerable limit of soil loss rate of 10 t ha−1yr−1 contributing total soil loss of 5536.33 tons/year in 1975 and 8624.69 tons/year in 2020. Areas about 3.02 km2 in 1975 and 3.64 km2 in 2020 absorbed soil loss rates above the tolerable limit. The result also showed that 8.95 and 18.38% of the soil loss rates were greater than the maximum soil formation rate estimated for the country (22 tha−1yr−1) in 1975 and 2020, respectively.
On the other hand, multiple studies demonstrated that the estimated annual soil loss rates of the current study were lower than the rates of local scale studies that estimated soil loss rate of 279 t ha−1yr−1 in Omo-Gibe river basin, southern Ethiopia with a mean annual soil loss rate of 69 t ha−1yr−1 (Girma and Gebre Citation2020). Soil loss rate of 716 t ha−1yr−1 in the Koga watershed in the highlands of Ethiopia and 935 t ha−1yr−1 in Beshillo catchment of the Blue Nile basin, Ethiopia were also much higher than our findings (Molla and Sisheber Citation2017; Yesuph and Dagnew Citation2019). The mean annual soil loss of Koga watershed and Beshillo catchment was 42 and 51 t ha−1yr−1, respectively (ibid.). Evidently, soil loss profile in the country depicts a strong variation spatially and temporally and generally, there seems disparity between the estimated soil erosion rates in the current study and the figures reported in literature across the country. Such variation is expected and may be accounted for several reasons including the use of models and data inputs, variations in biophysical environment, area extent, and management practices. Despite all the variations, the estimated soil loss rates and their spatial distribution across the field are comparable to what was observed in the watershed. The main contributing factors of soil loss are still inappropriate agricultural practices, deforestation, overgrazing, construction activities, population expansion, and climate change (Montanarella Citation2004; Wassie Citation2020). Therefore, mitigation strategies have to be developed to those areas with high, very high, and severe soil loss rates to halt soil erosion and allow soil regeneration.
3.5. Classification and prioritization of critical erosion prone areas for possible conservation planning
Based on the estimated annual soil loss rates, the study watershed was classified into five erosion severity and priority classes (). The erosion risk level classification was performed following the soil loss rate class proposed by Kadam et al. (Citation2018) with minor modification to suit the features of Lake Hawassa Watershed. The severity classes were assigned mean soil loss values from zero to 83.6 t ha−1 yr−1 and verbal labels of ‘slight’ to ‘severe’ erosion classes. Under each year, areas covered by soil loss per severity class were given in ha, whereas the proportions were written in brackets. In areas with scarce data, such prioritization of erosion prone areas is indispensable for practitioners and policy makers to develop and implement interventions to mitigate erosion hazards (Haregeweyn et al. Citation2013; Gashaw et al. Citation2017).
The result revealed that in 1975, 21.11% and in 2020, 21.74% of the watershed have been experiencing from moderate to severe soil erosion. Combined high, very high, and sever soil loss (50.53% in 1973 and 55.40% in 2020) have been recorded on areas less than 2%. Highland areas are more affected by soil erosion and surface runoff causing the transportation of sediment to the swamp area, which is located at the lowest altitude serving as a natural trap in a closed watershed. This was manifested by siltation of Lake Cheleleka and surface area expansion of Lake Hawassa due to runoff (Gebreegziabher Citation2004). Such incidences call for an intervention and conservation measures to be implemented focussing on arresting erosion at higher and steep slope areas. By doing so, we will contribute to Goal Number 15 of the United Nations Sustainable Development Goals (SDGs) established by all member countries by the agenda 2030. Particularly, the SDG target 15.3 aimed at restoring degraded land and soil including land affected by desertification, drought, and floods and strive to achieve a land degradation neutral world by 2030 (UN-SDG Citation2015).
3.6. Limitations
Both modelling and erosion measurements are prone to uncertainty and may require validation using measured data. However, the study area lacks data for model validation and hence, it was not possible to quantitatively validate the model results. Therefore, the USLE model results were based on comparison with the outputs of previously reported studies using similar methods in the highlands of Ethiopia as used by several previous authors (Gelagay and Minale Citation2016; Gashaw et al. Citation2017; Yesuph and Dagnew Citation2019; Negese et al. Citation2021). We compared the soil loss estimates of Lake Hawassa Watershed to those from previous studies (FAO-UN Citation1986; Hurni Citation1988; Sonneveld et al. Citation1999; Haregeweyn et al. Citation2017) conducted in Ethiopian highlands. Besides, this study attempted to provide LULC data using coarse resolution images and soil types were derived from small-scale maps. However, the LULC data would have been more accurate if high-resolution images were used and better soil distribution map was obtained if soil units were extracted from reasonably large-scale maps. Though USLE model is a useful tool to estimate soil loss, it was not developed to estimate gully erosion, which involves complex hydrological and soil erosion processes to have a full picture of soil loss in the study watershed. All the limitations mentioned suggest further research to generate comprehensive results of soil loss for better planning and implementation of soil conservation measures.
3.7. Conservation measures
In data scarce areas such as the Ethiopian highlands, USLE model is helpful in identifying erosion hotspot areas to recommend appropriate conservation measures (Gashaw et al. Citation2020). The soil erosion risk map under and portrayed that the watershed with soil loss severity class of moderate and above covering areas of 27,497.52 ha in 1975 and 28,330.56 ha in 2020 require implementation of soil conservation measures at different levels. Particularly, areas with soil loss rate of greater than 10 t ha−1 yr−1 (Hurni Citation1983) need immediate intervention as this rate of soil loss is beyond the tolerable rate for the Ethiopian highlands and for the Rift Valley zone where our study area is situated to ensure sustainability of the watershed. Although safeguarding the natural resources of an area is the responsibility of every citizen, the first step to protect the soil from degradation is creating awareness among the society living in and around the watershed about the wise use of available resources and then identifying the actors that must develop, mobilize, and implement the planned conservation measures.
In mountainous areas, hillsides, and in areas with soil loss above moderate severity classes, the actors should exert concerted effort to cover these areas with vegetation to reduce soil erosion. There was a program in Ethiopia named ‘Food for Work’ aimed to control erosion and afforestation of degraded lands to stimulate production and increase income (Gedamu Citation2006). Similar program was also reported in China named ‘Grain for Green’, which attempted to increase land cover and it significantly reduced sediment yield and soil erosion (Wolka et al. Citation2015). Strengthening such practices coupled with the already on-going ‘Green Legacy’ in the country could help to reduce soil erosion and rehabilitate the affected regions.
Improving traditional farming practices, which invite excessive soil erosion by water and controlling population migration to the forested areas, could play a major role in reducing soil loss due to erosion. Restricting overgrazing and trampling of vegetation by freely roaming livestock that leads to the removal of vegetation cover and allowing concentrated flow of water, which enhances the development of rill and gully erosion, could also help to minimize soil erosion.
The current Ethiopian land policy permits ownership of the land to the state while people are entitled to inheritable use right only leaving uncertainties of land tenure. This kind of possession discourages people not to invest on the land they use and such practices require amendment for better management of land resources, as connection exist between land tenure certainty and sustainability.
To identify mechanical, biological, or agroforestry conservation practices as soil conservation measures, erosion prone areas have to be categorized into farmland management, hillside management, and gully rehabilitation as suggested by Gadisa and Midega (Citation2021) and apply the selected conservation measures for better management. The conservation measure should address not only on-site, but also off-site effects of soil degradation as they seriously threaten human health and have substantial economic implications (Montanarella Citation2004). If the selected conservation measures are applied at the right location and at the right time, it will contribute to the United Nations-Sustainable Development Goal, agenda 2030 pertinent to soil erosion.
4. Conclusion
Natural resources such as land, soil, water, forest, wildlife, and rangeland are considered as resource base for the Ethiopian population (Wassie Citation2020). Degradation of one or more of these resources will obviously affect the livelihood of people, who depend on them. Soil erosion is particularly a major problem worldwide leading to loss of nutrient rich top soil, increased runoff, and decreased water availability to plants (Ganasri and Ramesh Citation2016). USLE model was used to estimate soil loss rates at watershed level to estimate soil loss. This estimation was performed with a goal to identify erosion hot spot areas and apply conservation measures. Advancement in remote sensing and GIS technologies in the last few decades coupled with the increased processing capability of large data have augmented the use of more dynamic models. This study estimated annual soil loss rate, total soil loss, and generated spatial distribution of erosion risk areas, and mapped erosion severity class for two temporal instants, 1975 and 2020. The model result indicated that the estimated total soil losses in the Lake Hawassa Watershed were 23,580.59 and 27,783.35 tons per annum for the year 1975 and 2020, respectively. It is also evident that the majority of soil loss was contributed by a small area that means 97.45% of the soil loss was contributed by 21.10% of the area in 1975, while 87.91% of the soil loss in 2020 was contributed by 21.75% of the study area. Following the decline in vegetation cover and expansion of agricultural land, the magnitude and spatial distribution of soil loss have increased over the period (1975–2020) under investigation. The soil loss map also indicated that some of the areas discerned as erosion risk classes in 1975, persistently continued with the same or more erosion risk class in the year 2020. Such areas were affected by soil erosion for a long time and probably have developed into gullies. This shows that soil erosion risk is worsening in some areas in the study watershed. Indubitably, the erosion severity classes identified could help land managers and conservation experts to plan and implement conservation measures to combat erosion hazards. Many researchers focus on commonly used least cost single conservation methods, such as soil bund, stone bund, etc. alone. However, experiences indicated that single and least cost conservation measures have not produced the required results in protecting soil from erosion and we should learn to invest on combined, better, and efficient conservation measures taking into account dry, moist or wet agro-ecological zones to drain excess runoff sideways to the next waterway or river in each applied measure. This is particularly applicable in areas with high rainfall in moist and wet zones. The USLE model provided useful maps and quantitative data about soil loss of the Lake Hawassa Watershed and researchers and practitioners can apply the same method in different watersheds as long as they are aware of the underlying model concepts and parameters and the possible limitations. The increase in the use of USLE model to estimate soil loss by water erosion from watershed level to continental level and its use in all continents make the outputs of the model usable by authors in different parts of the world. We believe that, the result of the current research output will be one of the publication footprints in the area.
Author contributions
The author performed all the conceptualization, methodology design, software application, resource acquisition, data analysis, and manuscript writing tasks.
Acknowledgements
I acknowledge that this research was supported by Hawassa University. I am also indebted to the National Meteorological Agency for providing long-term rainfall data and the anonymous reviewers for their time to review this manuscript.
Data availability statement
The data presented in this research are available upon request.
Disclosure statement
The author reports there are no competing interests to declare.
References
- Adimassu Z, Mekonnen K, Yirga C, Kessler A. 2014. Effect of soil bunds on runoff, soil and nutrient losses, and crop yield in the Central Highlands of Ethiopia. Land Degrad Develop. 25(6):554–564.
- Alewell C, Borrelli P, Meusburger K, Panagos P. 2019. Using the USLE: chances, challenges and limitations of soil erosion modelling. Int Soil Water Conserv Res. 7(3):203–225.
- Ali H, Descheemaeker K, Steenhuis TS, Pandey S. 2011. Comparison of landuse and landcover changes, drivers and impacts for a moisture-sufficient and drought-prone region in the Ethiopian Highlands. Ex Agric. 47(S1):71–83.
- Amsalu T, Mengaw A. 2014. GIS based soil loss estimation using RUSLE model: the case of Jabi Tehinan Woreda, ANRS, Ethiopia. NR. 05(11):616–626.
- Aneseyee AB, Soromessa T, Elias E. 2019. The effect of land use/land cover changes on ecosystem services valuation of Winike Watershed, Omo Gibe basin, Ethiopia. Hum Ecol Risk Assess. 26(10):2608–2627.
- Aplin P. 2004. Remote sensing: land cover. Prog Phys Geogr. 28(2):283–293.
- Assefa TT, Jha MK, Tilahun S, Yetbarek E, Adem AA, Wale A. 2015. Identification of erosion hotspot area using GIS and MCE technique for Koga Watershed in the Upper Blue Nile Basin, Ethiopia. Am J Environ Sci. 11(4):245–255.
- Ayalew G. 2015. A geographic information system based soil loss and sediment estimation in Zingin watershed for conservation planning, highlands of Ethiopia. IJSTS. 3(1):28–35.
- Ayalew G, Selassie YG. 2015. Soil loss estimation for soil conservation planning using Geographic Information System in Guang Watershed, Blue Nile basin. J Environ Earth Sci. 5(1):126–134.
- Ayenew T. 2004. Environmental implications of changes in the levels of lakes in the Ethiopian Rift since 1970. Reg Environ Change. 4(4):192–204.
- Bagegnehu B, Alemayehu M, Nigatu W. 2019. Geographic Information System (GIS) based soil loss estimation using Universal Soil Loss Equation Model (USLE) for soil conservation planning in Karesa Watershed, Dawuro zone, South West Ethiopia. Int J Water Res Environ Eng. 11(8):143–158.
- Balabathina VN, Raju RP, Mulualem W, Tadele G. 2020. Estimation of soil loss using remote sensing and GIS-based universal soil loss equation in Northern catchment of Lake Tana Sub-basin, Upper Blue Nile Basin, Northwest Ethiopia. Environ Syst Res. 9(1):1–32.
- Basri EM, Adam OM, Teh SY, Maznah WOW. 2019. Identification of critical erosion prone areas in Temengor reservoir basin using Universal Soil Loss Equation (USLE) and Geographic Information System (GIS). Earth Environ Sci. 380:012011.
- Bekele B, Gemi Y. 2021. Soil erosion risk and sediment yield assessment with Universal Soil Loss Equation and GIS: in Dijo Watershed, Rift Valley Basin of Ethiopia. Model Earth Syst Environ. 7(1):273–291.
- Bekele M. 2021. Geographic Information System (GIS) based soil loss estimation using RUSLE model for soil and water conservation planning in Anka_Shashara Watershed Southern, Ethiopia. IJH. 5(1):9–27.
- Belay HT, Malede DA, Geleta FB. 2020. Erosion risk potential assessment using GIS and RS for soil and water resource conservation plan: the case of Yisir Watershed, Northwestern Ethiopia. Agric for Fish. 9(1):1–13.
- Belete MD, Diekkrüger B, Herget Herget J. 2013. The impact of sedimentation and climate variability on the hydrological status of Lake Hawassa, South Ethiopia [dissertation]. Universität Bonn.
- Berhanu B, Melesse AM, Seleshi Y. 2013. GIS-based hydrological zones and soil geo-database of Ethiopia. Catena. 104:21–31.
- Beskow S, Mello CR, Norton LD, Curi N, Viola MR, Avanzi JC. 2009. Soil erosion prediction in the Grande River Basin, Brazil using distributed modeling. Catena. 79(1):49–59.
- Bewket W. 2007. Soil and water conservation intervention with conventional technologies in Northwestern Highlands of Ethiopia: acceptance and adoption by farmers. Land Use Policy. 24(2):404–416.
- Bewket W, Teferi E. 2009. Assessment of soil erosion hazard and prioritization for treatment at the watershed level: case study in the Chemoga Watershed, Blue Nile Basin, Ethiopia. Land Degrad Dev. 20(6):609–622.
- Bhandari S. 2010. Urban change monitoring using GIS and remote sensing tools in Kathmandu Valley (Nepal) [master’s thesis]. Erasmus Mundus Consortium.
- Borrelli P, Robinson DA, Fleischer LR, Lugato E, Ballabio C, Alewell C, Meusburger K, Modugno S, Schütt B, Ferro V, et al. 2017. An assessment of the global impact of 21st century land use change on soil erosion. Nat Commun. 8(1):1–13.
- Brink AB, Eva HD. 2009. Monitoring 25 years of land cover change dynamics in Africa: a sample based remote sensing approach. Appl Geogr. 29(4):501–512.
- Chadli K. 2016. Estimation of soil loss using RUSLE model for Sebou Watershed (Morocco). Model Earth Syst Environ. 2(2):1–10.
- Chuenchum P, Xu M, Tang W. 2019. Estimation of soil erosion and sediment yield in the Lancang–Mekong River using the modified Revised Universal Soil Loss Equation and GIS techniques. Water. 12:135.
- Congalton RG. 1991. A review of assessing the accuracy of classifications of remotely sensed data. Remote Sens Environ. 37(1):35–46.
- Congalton RG. 2001. Accuracy assessment and validation of remotely sensed and other spatial information. Int J Wildland Fire. 10(4):321–328.
- Congalton RG, Green K. 1993. A practical look at the sources of confusion in error matrix generation. Photogramm Eng Remote Sens. 59(5):641–644.
- Congalton RG, Green K. 2009. Assessing the accuracy of remotely sensed data: principles and practices. Boca Raton (FL): Taylor & Francis.
- Dadi M. 2020. Foundation for source-to-sea management: characterization of sediment flows in Lake Hawassa Sub-Basin, Ethiopia. Project carried out by SIWI from September 2019 to May 2020, Stockholm, Sweden.
- Degife A, Worku H, Gizaw S. 2021. Environmental implications of soil erosion and sediment yield in Lake Hawassa Watershed, South-Central Ethiopia. Environ Syst Res. 10(1):1–24.
- Desmet PJJ, Govers G. 1996. A GIS procedure for automatically calculating the USLE LS factor on topographically complex landscape units. J Soil Water Conserv. 51(5):427–433.
- Desta L, Carucci V, Wendemagenehu A, Abebe Y. 2005. Community based participatory watershed development: a guideline. Addis Ababa (AA). Ministry of Agriculture and Rural Development.
- Earth Explorer. [Accessed 2022 Jan 3]. https://earthexplorer.usgs.gov/.
- Efe R, Ekinci D, Cürebal İ. 2008. Erosion analysis of Şahin Creek Watershed (NW of Turkey) using GIS based on RUSLE (3D) method. J Appl Sci. 8(1):49–58.
- Eisenberg J, Muvundja FA. 2020. Quantification of erosion in selected catchment areas of the Ruzizi River (DRC) using the (R) USLE model. Land. 9(4):125.
- Eshete T. 2009. Spatial analysis of erosion and land degradatin leading to environmental stress: the case of Lake Hawassa Catchment [master’s thesis]. Addis Ababa (AA): Addis Ababa University.
- FAO-UN. 1986. Ethiopian highlands reclamation study. Vol. 1. Rome: Food and Agriculture Organization of the United Nations.
- FAO-UN. 2006. Guidelines for soil description. Rome: Food and Agriculture Organization of the United Nations.
- FAO-UNESCO. 1974. Soil map of the world. United Nations Educational, Scientific and Cultural Organization. Rome, Italy: Oromia Bereau of Agriculture.
- Fistikoglu O, Harmancioglu NB. 2002. Integration of GIS with USLE in assessment of soil erosion. Water Resour Manag. 16(6):447–467.
- Foody GM. 2002. Status of land cover classification accuracy assessment. Remote Sens Environ. 80(1):185–201.
- Gadisa N, Midega T. 2021. Soil and water conservation measures in Ethiopia: importance and adoption challenges. World J Agri Soil Sci. 6(3):1–7.
- Ganasri BP, Ramesh H. 2016. Assessment of soil erosion by RUSLE model using Remote Sensing and GIS - a case study of Nethravathi Basin. Geosci Front. 7(6):953–961.
- Gashaw T, Tulu T, Argaw M. 2017. Erosion risk assessment for prioritization of conservation measures in Geleda Watershed, Blue Nile basin, Ethiopia. Enviro Syst Res. 6(1):1–14.
- Gashaw T, Worqlul AW, Dile YT, Addisu S, Bantider A, Zeleke G. 2020. Evaluating potential impacts of land management practices on soil erosion in the Gilgel Abay Watershed, Upper Blue Nile basin. Heliyon. 6(8):e04777.
- Gebreegziabher Y. 2004. Assessment of the water balance of Lake Awassa Catchment, Ethiopia [master’s thesis]. Enschede: International Institute for Geo-Information Science and Earth Observation.
- Gedamu A. 2006. Food for work program and its implications on food security: a critical review with a practical example from the Amhara Region, Ethiopia. J Agric Rural Dev Trop Subtrop. 107(2):177–188.
- Gelagay HS, Minale AS. 2016. Soil loss estimation using GIS and Remote Sensing Techniques: a case of Koga Watershed, Northwestern Ethiopia. Int Soil Water Conserv Res. 4(2):126–136.
- Gezahegn WW, Arus EH. 2020. Effect of land use and land cover change on soil erosion in Erer sub-basin, Northeast Wabi Shebelle Basin, Ethiopia. Land. 9:111.
- Girma R, Gebre E. 2020. Spatial modeling of erosion hotspots using GIS-RUSLE interface in Omo-Gibe river basin, Southern Ethiopia: implication for soil and water conservation planning. Environ Syst Resh. 9(19):1–14.
- Girmay G, Moges A, Muluneh A. 2020. Estimation of soil loss rate using the USLE model for Agewmariayam Watershed, Northern Ethiopia. Agric Food Secur. 9(9):1–12.
- Hagos Y. 2020. Estimating landscape vulnerability to soil erosion by RUSLE model using GIS and Remote Sensing: a case of Zariema Watershed, Northern Ethiopia. Res Sq. 1–15. DOI: 10.21203/rs.3.rs-136586/v1
- Haregeweyn N, Poesen J, Verstraeten G, Govers G, de Vente J, Nyssen J, Deckers J, Moeyersons J. 2013. Assessing the performance of a spatially distributed soil erosion and sediment delivery model (WATEM/SEDEM) in Northern Ethiopia. Land Degrad Develop. 24(2):188–204.
- Haregeweyn N, Tsunekawa A, Poesen J, Tsubo M, Meshesha DT, Fenta AA, Nyssen J, Adgo E. 2017. Comprehensive assessment of soil erosion risk for better land use planning in river basins: case study of the Upper Blue Nile River. Sci Total Environ. 574:95–108.
- Hurni H. 1983. Ethiopian highlands reclamation study. Soil formation rates in Ethiopia (with scale 1: 1, 000, 000). Working paper 2. University of Bern, Switzerland.
- Hurni H. 1985. Erosion - productivity - conservation systems in Ethiopia. Soil Conservation Research (SCRP). Paper presented at: IV International Conference on Soil Conservation, November 3–9, Maracay, Venezuela.
- Hurni H. 1988. Degradation and conservation of the resources in the Ethiopian Highlands. Mt Res Dev. 8(2/3):123–130.
- Hurni H. 1993. Land degradation, famine, and land resource scenarios in Ethiopia. World Soil Eros Conserv. :27–61.
- Jain MK, Kothyari UC. 2000. Estimation of soil erosion and sediment yield using GIS. Hydrol Sci J. 45(5):771–786.
- Jensen JR. 2005. Introductory digital image processing: a remote sensing perspective. New Jersy (NJ): Upper Saddle River, Pearson Prentice Hall.
- Kadam AK, Umrikar BN, Sankhua RN. 2018. Assessment of soil loss using Revised Universal Soil Loss Equation (RUSLE): a remote sensing and GIS approach. Remote Sens Land. 2(1):65–75.
- Kidane M, Bezie A, Kesete N, Tolessa T. 2019. The impact of land use and land cover (LULC) dynamics on soil erosion and sediment yield in Ethiopia. Heliyon. 5(12):e02981.
- Kouli M, Soupios P, Vallianatos F. 2009. Soil erosion prediction using the Revised Universal Soil Loss Equation (RUSLE) in a GIS framework, Chania, Northwestern Crete, Greece. Environ Geol. 57(3):483–497.
- Marondedze AK, Schütt B. 2020. Assessment of soil erosion using the RUSLE model for the Epworth District of the Harare Metropolitan Province, Zimbabwe. Sustainability. 12(20):8531.
- Masha M, Yirgu T, Debele M. 2021. Impacts of land cover and greenness change on soil loss and erosion risk in Damota area districts, Southern Ethiopia. Appl Environ Soil Sci. 2021:1–14.
- Molla T, Sisheber B. 2017. Estimating soil erosion risk and evaluating erosion control measures for soil conservation planning at Koga Watershed in the Highlands of Ethiopia. Solid Earth Discuss. 8:13–25.
- Montanarella L. 2004. The EU thematic strategy on soil protection. Paper presented at: In Contributions International Workshop on Land Degradation.
- Morgan RPC. 2005. Soil erosion and conservation. Malde (MA): Oxford, Blackwell.
- Negese A. 2021. Impacts of land use and land cover change on soil erosion and hydrological responses in Ethiopia. Appl Environ Soil Sci. 2021:1–10.
- Negese A, Fekadu E, Getnet H. 2021. Potential soil loss estimation and erosion-prone area prioritization using RUSLE, GIS, and Remote Sensing in Chereti Watershed, Northeastern Ethiopia. Air Soil Water Res. 14:117862212098581.
- Okeke F, Karnieli A. 2006. Methods for fuzzy classification and accuracy assessment of historical aerial photographs for vegetation change analyses. Part I: algorithm development. Int J Remote Sens. 27(1):153–176.
- Oliveira JDA, Dominguez JML, Nearing MA, Oliveira PT. 2015. A GIS-based procedure for automatically calculating soil loss from the Universal Soil Loss Equation: GISus-M. Am Soc Agric Biol Eng. 31(6):907–917.
- Panagos P, Borrelli P, Meusburger K. 2015. A new European slope length and steepness factor (LS-Factor) for modeling soil erosion by water. Geosciences. 5(2):117–126.
- Qiang F, Wenwu Z, Jun W, Zhang X, Mingyue Z, Zhong L, Liu Y, Xuening F. 2016. Effects of different land-use types on soil erosion under natural rainfall in the Loess Plateau, China. Pedosphere. 26(2):243–256.
- Renard KG, Foster GR, Weesies GA, McCool DK, Yoder DC. 1997. Predicting soil erosion by water: a guide to conservation planning with the Revised Universal Soil Loss Equation (RUSLE). Washington (DC): US Government Printing Press.
- Ritchie JC, Nearing MA, Nichols MH, Ritchie CA. 2005. Patterns of soil erosion and redeposition on Lucky Hills Watershed, Walnut Gulch Experimental Watershed, Arizona. Catena. 61(2–3):122–130.
- Samela C, Imbrenda V, Coluzzi R, Pace L, Simoniello T, Lanfredi M. 2022. Multi-decadal assessment of soil loss in a Mediterranean region characterized by contrasting local climates. Land. 11(7):1010.
- Shiferaw A. 2011. Estimating soil loss rates for soil conservation planning in the Borena Woreda of South Wollo Highlands, Ethiopia. J Sustain Dev Afr. 13(3):87–106.
- Smits PC, Dellepiane SG, Schowengerdt RA. 1999. Quality assessment of image classification algorithms for land-cover mapping: a review and a proposal for a cost-based approach. Int J Remote Sens. 20(8):1461–1486.
- Sonneveld B, Keyzer MA, Albersen PJ. 1999. A non-parametric analysis of qualitative and quantitative data for erosion modeling: a case study for Ethiopia. Paper presented at: the 10th International soil Conservation Organization, May 24–29, Purdue, USA.
- Star JL, Estes JE, McGwire KC. 1997. Integration of geographic information systems and remote sensing. New York (NY): Cambridge University Press.
- Tamene L, Abera W, Demissie B, Desta G, Woldearegay K, Mekonnen K. 2022. Soil erosion assessment in Ethiopia: a review. J Soil Water Conserv. 77(2):144–157.
- Tamene L, Park SJ, Dikau R, Vlek PLG. 2006. Analysis of factors determining sediment yield variability in the highlands of northern Ethiopia. Geomorphology. 76(1–2):76–91.
- Teh SH. 2011. Soil erosion modeling using RUSLE and GIS on Cameron Highlands, Malaysia for hydropower development [master’s thesis]. Iceland: Akureyri.
- Tesfaye G, Assefa A, Kidane D. 2017. Runoff, sediment load and land use/cover change relationship: the case of Maybar Sub-Watershed, South Wollo, Ethiopia. Int J River Basin Manag. 15(1):89–101.
- Teshome A, Halefom A, Teshome M, Ahmad I, Taddele Y, Dananto M, Demisse S, Szucs P. 2021. Soil erosion modelling using GIS and Revised Universal Soil Loss Equation approach: a case study of Guna-Tana Landscape, Northern Ethiopia. Model Earth Syst Environ. 7(1):125–134.
- Tessema YM, Jasińska J, Yadeta LT, Świtoniak M, Puchałka R, Gebregeorgis EG. 2020. Soil loss estimation for conservation planning in the Welmel Watershed of the Genale Dawa Basin, Ethiopia. Agronomy. 10(6):777.
- UN-SDG. 2015. Transforming our world: the 2030 agenda for sustainable development. New York (NY): United Nations.
- Wassie SB. 2020. Natural resource degradation tendencies in Ethiopia: a review. Environ Syst Res. 9(1):1–29.
- Wischmeier WH, Smith DD. 1978. Predicting rainfall erosion losses: a guide to conservation planning. Washington (DC): US Government Printing Office.
- Woldemariam GW, Iguala AD, Tekalign S, Reddy RU. 2018. Spatial modeling of soil erosion risk and its implication for conservation planning: the case of the Gobele Watershed, East Hararghe Zone, Ethiopia. Land. 7(1):25.
- Wolka K, Tadesse H, Garedew E, Yimer F. 2015. Soil erosion risk assessment in the Chaleleka Wetland Watershed, Central Rift Valley of Ethiopia. Enviro Syst Res. 4(5):1–12.
- Wondrade N, Dick Ø, Tveite H. 2014. GIS based mapping of land cover changes utilizing multi-temporal remotely sensed image data in Lake Hawassa Watershed, Ethiopia. Environ Monit Assess. 186(3):1765–1780.
- Wondrade N, Dick Ø, Tveite H. 2016. Analyse av endringer i arealbruk og arealdekke sett i lys av de underliggende drivkrefter i Lake Hawassa Watershed, Ethiopia. Kart Og Plan. 76:7–27.
- Yesuph AY, Dagnew AB. 2019. Soil erosion mapping and severity analysis based on RUSLE model and local perception in the Beshillo Catchment of the Blue Nile Basin, Ethiopia. Environ Syst Res. 8(1):1–21.
- Zhang H, Yang Q, Li R, Liu Q, Moore D, He P, Ritsema CJ, Geissen V. 2013. Extension of a GIS procedure for calculating the RUSLE equation LS factor. Comput Geosci. 52:177–188.
- Zhang X, Kang T, Wang H, Sun Y. 2010. Analysis on spatial structure of landuse change based on remote sensing and geographical information system. Int J Appl Earth Obs Geoinf. 12:S145–S150.