
 ?Mathematical formulae have been encoded as MathML and are displayed in this HTML version using MathJax in order to improve their display. Uncheck the box to turn MathJax off. This feature requires Javascript. Click on a formula to zoom.
Abstract
Landslide susceptibility prediction (LSP) is an important step for landslide hazard and risk assessment. Automated machine learning (AutoML) has the advantages of automatically features, models, and parameters selection. In this study, we proposed an AutoML-based global LSP framework at two spatial resolutions of 90 m and 1000 m, and achieved an area under the receiver operating characteristic above 0.96. The global prediction results were then validated using additional regional landslide inventories, including three countries, three provinces, and two prefecture-level datasets. Moreover, the global prediction results of 90 m are used to improve the performance of regional LSP. Specifically, the low-and very low-prone areas in the global prediction results were used as non-landslide samples for susceptibility modeling. Results demonstrated that the model achieved a better performance than original global prediction results. We believe that this study will be able to reliably promote the application of intelligent learning methods in global LSP.
1. Introduction
Landslides are common and destructive natural disasters worldwide (Zêzere et al. Citation2017). Landslide susceptibility prediction (LSP) is an effective method to prevent landslide loss. In recent years, with the development of machine learning, a large number of models have been introduced into LSP, including information value (Akbar and Ha Citation2011; Tsangaratos and Ilia Citation2016; Achour et al. Citation2017), multivariate statistical analysis (Kavzoglu et al. Citation2014; Erener et al. Citation2016), weight of evidence (Wang et al. Citation2016), Naive Bayes (NB) (Tsangaratos and Ilia Citation2016), Random Forest (RF) (Taalab et al. Citation2018; Pham et al. Citation2021), logistic regression (Aditian et al. Citation2018), support vector machine (Peng et al. Citation2014; Colkesen and Kavzoglu Citation2016), decision tree (Tsangaratos and Ilia Citation2016; Dou et al. Citation2019), artificial neural networks (Chen et al. Citation2017; Shahri et al. Citation2019), and other statistical and machine learning models. However, the selection of models in machine learning is labour-intensive, and the adjustment of parameters in the models when selected for application further increases the time and computational cost, and these steps also require professional data researchers, further raising the technical threshold. Automatic machine learning (AutoML) is a recently developed advanced machine learning method. Its framework contains a large number of models in its framework to choose from. It can not only automatically select models and parameters, but also automatically filter the features involved in training before building the model. The most important advantage of AutoML is that it can be used for model building without specialized data knowledge, greatly reducing time and technical costs. Therefore, it is widely used in medical image recognition (Faes et al. Citation2019; He et al. Citation2020), object detection (Ghiasi et al. Citation2019; Xu et al. Citation2019), semantic segmentation (Weng et al. Citation2019; Liu et al. Citation2019), text classification (Chen et al. Citation2018), and loss function search (Li et al. Citation2019; Ru et al. Citation2020).
With the continuous deepening of LSP studies, the method suitable for studying landslide susceptibility in specific small-scale areas lacks universality and cannot be applied to other areas. Moreover, applying the same prediction method to different areas can make the work redundant and meaningless. Therefore, there is an urgent need for a generalized LSP method at large scale. Recently, researchers have begun to conduct studies on global LSP. For example, Stanley and Kirschbaum (Citation2017) used a heuristic fuzzy method to predict global susceptibility with a spatial resolution of 1000 m. Hong et al. (Citation2007) used satellite remote sensing data to predict the global susceptibility with some influencing factors with a spatial resolution from 30 m to 0.25 degrees (about 28 km), and resampled them to 1000 m spatial resolution. This paper also cites Fabbri’s finding that only three data layers (elevation, slope, and aspect) derived from a DEM provide better results than six data layers (including other geology, surface materials, and land use), further arguing that the factors of global landslide susceptibility mainly come from DEM data (Fabbri et al. Citation2003). Khan et al. (Citation2022) combined the precipitation forecast module and applied it to the LHASA-F framework to continuously predict the global LSP with a spatial resolution of 1000 m. Stanley et al. (Citation2021) subsequently updated LHASA version 2 to allow faster updates to the rainfall forecast module, providing near real-time global LSP maps based on rainfall variability. Felsberg et al. (Citation2021) combined the landslide community method with common practice in meteorological modeling to create a set of global susceptibility maps with a spatial resolution of 36 km. Felsberg et al. (Citation2023) proposes a global landslide probabilistic hydrological estimation model (PHLS). By combining LSP and hydrological variables, the model estimates the landslide hazard caused by hydrology with a rough spatial resolution of 36 km. Lin et al. (Citation2017) chose to use the logistic regression method for a global LSP study, and the results showed that the logistic regression model generated the global susceptibility map with a spatial resolution of 0.5 degrees (about 55 km). However, above LSP on a global scale has following limitations. First, almost none of the existing models are universal, and simply choosing different models for global-scale landslide susceptibility studies may lead to bias of research. Therefore, we can use AutoML to solve this pain point and greatly reduce time and labour costs. Secondly, current global scale landslide susceptibility studies can only obtain the approximate distribution of global susceptibility with a spatial resolution of 1000 m or less, generally tens of kilometres to a few radians. This coarse resolution cannot meet the requirements of the application of regional landslide management.
To solve the above issues, we propose an AutoML-based global LSP framework. The problem of model selection can be effectively solved since AutoML can automatically select models and parameters at a macro level. The advantages of combining AutoML for global LSP research lies in the following facts. First, it can reduce the time cost of model selection and parameter adjustment. Second, it can better explore various possible algorithms and hyperparameter combination for best prediction performance compared with traditional machine learning methods. Finally, AutoML modeling process is fully automated, widely applicable to any region and dataset in the world, and research is reproducible. On this basis, the feasibility of the AutoML model (Auto-PyTorch) for 1000 m and 90 m global LSP is explored. In addition, according to the 90 m global LSP results, non-landslide samples are selected for regional LSP to improve its reliability, which is expected to provide a scientific basis for global landslide disaster risk management.
2 Study area and available data
2.1. Global-scale study area and influencing factors
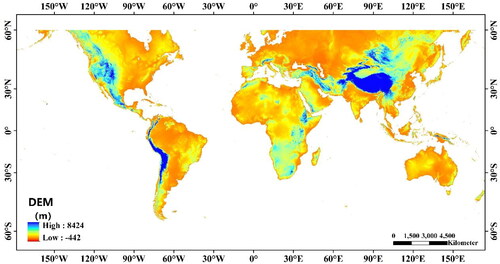
In this study, the study area for LSP is the global total longitude and the latitude range of 60°N − 60°S. The v4 version of the 90-meter SRTM DEM data was selected to complete this study (Jarvis et al. Citation2008), as shown in .
Figure 1. The study area and its DEM.
Based on the 90 m SRTM DEM data, the elevation is selected as the influence factor, and the slope, slope direction, plane curvature, and profile curvature extracted from the elevation are also used as the influence factors of the LSP study.
Lithology is indispensable in the prediction of landslide susceptibility, which determines the upper limit of the stress that the slope can bear. This study selected the Global Lithological Map, which is a combination of several regional lithology data maps with the highest resolution available in the world, and merged the data according to standards such as fineness, data volume and data consistency. There are 16 lithological classes as shown in , and users can refer to the article Hartmann and Moosdorf (Citation2012) and for details.
Figure 2. Thematic map of the lithological factor.
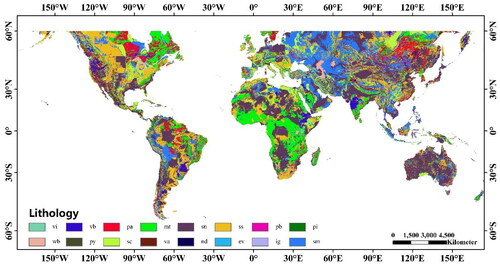
Table 1. Lithology abbreviation in .
Land cover is also important for susceptibility prediction, and land cover changes more frequently than lithology. This study collected landslide inventory data around 2010, so the global land cover data Globalcover (Arino Citation2010) with a spatial resolution of 300 m released by the European Space Agency in 2009 was used. The MERIS (Medium Resolution Imaging Spectrometer) sensor in the Envisat satellite was used for acquisition, and different feature classes of the land cover data are detailed in the literature (Arino Citation2010).
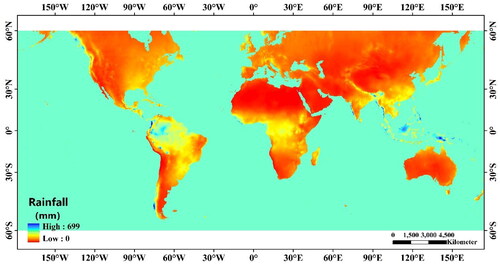
Rainfall can change soil moisture and rock stresses and is the trigger for most landslides. Global rainfall was selected from the WorldClim 2.1 dataset from the Climate Research Unit of the University of East Anglia (Harris et al. Citation2014; Fick and Hijmans Citation2017). The average monthly rainfall in the world from 2000 to 2018 with a spatial resolution of 21 km was selected as the rainfall factor based on the time span of landslide inventory data collection, as shown in .
Figure 3. Thematic map of the precipitation factor.
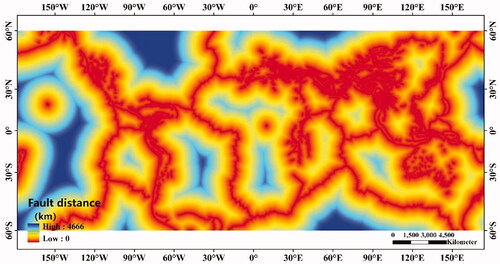
Earthquakes are another major cause of landslides, with the Pacific Rim volcanic, Eurasian, and oceanic ridge seismic zones being the major seismic zones on the Earth. The GEM Global Active Fault Database published by the Global Earthquake Model Foundation (Styron and Pagani Citation2020) was used for this study. The Euclidean distance from the fault data was calculated as a landslide influencing factor, as shown in . In this study, all the influencing factors were resampled to two spatial resolutions of 90 m and 1000 m, respectively, which were stored in the WGS84 CRS (EPSG: 4326) coordinate system for mapping, and the reclassification of each factor was realized by the natural breakpoint method.
Figure 4. Thematic map of the faults distance factor.
2.2. Datasets for global LSP
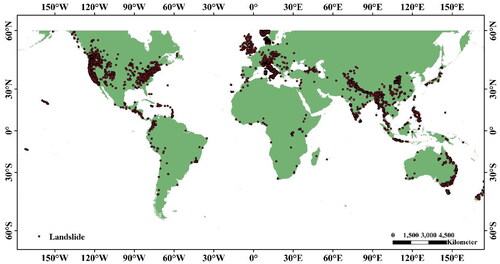
Landslide inventory data as training samples for susceptibility prediction is fundamental. In this study, the dataset is divided into two parts: datasets for global LSP and datasets for regional LSP. The global landslide inventory map is shown in . In this study, datasets for global LSP were used to construct and test the global landslide susceptibility model. The segmentation ratio of the training set and the test set of this data set was 70%:30%. Finally, the global LSP map is obtained based on this model. According to the research needs, this test set prepares Datasets for global LSP with 1000 m spatial resolution and 90 m spatial resolution respectively. The data of 1000-meter spatial resolution and 90-meter spatial resolution were also used to construct and test the global landslide susceptibility model. The difference between them is that the susceptibility model trained by 1000-meter spatial resolution data can finally obtain a complete global LSP map, while the susceptibility model trained by 90-meter spatial resolution data set is limited by the amount of data, and can only be drawn for the specified local area.
Figure 5. Global landslide inventory map.
Datasets for global LSP includes two global-scale, three national-scale and two province-scale landslide inventory datasets with 90 m spatial resolution and 1000 m spatial resolution, as shown in . The reason for supplementing national and regional landslide datasets is mainly because global-scale datasets are extremely limited and insufficient to support global-scale susceptibility prediction studies. Therefore, they are supplemented into the training datasets after screening the data for accuracy and reliability.
Table 2. Datasets for global LSP.
2.3 Datasets for regional LSP
Datasets for regional LSP is another important dataset in this study. This study will use this data set to verify the results of the global LSP model constructed by datasets for global LSP in different regions, so as to verify the reliability of the results of the global LSP model without the participation of regional measured data. After proving the reliability, the accuracy of the regional landslide susceptibility process and results can be further improved according to the global LSP model, and more reference value can be provided. The specific step is to use the low-prone areas obtained by the global LSP model as non-landslide samples, and combine the measured landslide data of datasets for regional LSP to generate training test data to further predict the susceptibility of the designated area. Datasets for regional LSP includes three national-scale, three province-scale and two prefectural-scale datasets, as shown in .
Table 3. Datasets for regional LSP.
All validation sets and influencing factors were prepared using 90 m spatial resolution after stacking analysis. The prefectural datasets of Yongxin County, Jiangxi Province, China and Hokkaido, Japan were prepared with a spatial resolution of 1000 m, and the landslide susceptibility maps were compared with the 90 m susceptibility maps to see the effect of the maps.
3. Methodology
shows the flowchart of the proposed framework. The purpose of the study is to obtain a global LSP result, and use it to guide the prediction of regional landslide susceptibility. The regional LSP and guidance can be divided into two steps according to the actual situation. The first objective is to use AutoML to predict landslide susceptibility on a global scale with a spatial resolution of 1000 m, and the second is divided into two steps. First, a LSP model with a spatial resolution of 90 m is constructed using the global LSP dataset, and the accuracy and reliability of the model are verified using the regional LSP dataset. After that, the low susceptibility areas obtained by the global LSP model can be used as non-landslide samples, combined with the regional LSP dataset as training and testing data to further predict the susceptibility of designated areas and improve reliability.
Figure 6. Schematic diagram of the proposed framework.
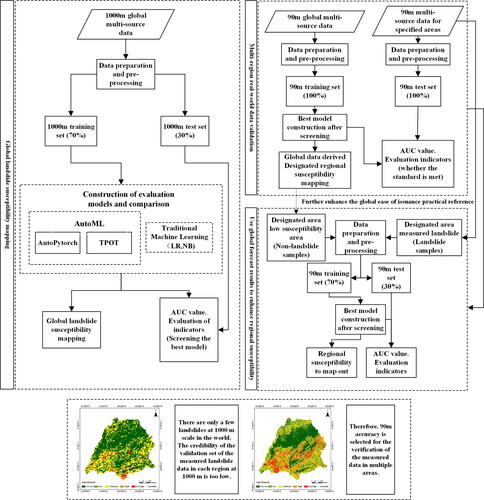
Also, shows a landslide susceptibility map for a certain county with a spatial resolution of 1000 m and a spatial resolution of 90 m. It can be seen that the practicability of the 1000-meter landslide susceptibility map for prefectural areas is much lower than that of the 90-meter landslide susceptibility map, and its guiding role in landslide disaster prevention is negligible. Therefore, it is in line with the future research trends to choose the higher spatial resolution possible under conditions. This is also the main reason for increasing the spatial resolution to 90 m in the second step in the study.
3.1. AutoML
Model selection in machine learning is a labour-intensive task. Adjusting model parameters will further increase time and technical costs, and these steps also require professional data researchers, further raising the technical level threshold. In addition to the above requirements, in many cases, the parameters tuned by researchers using similar exhaustive methods are not interpretable and do not represent optimal parameters. As a new branch of machine learning, AutoML not only automatically selects models and parameters, but also automatically screens the features involved in training before building the model. It means that it does not require specialized data knowledge to use AutoML for model building, which greatly reduces time and technical costs. The origin of AutoML can be traced back to 2012, beginning with the concept proposed by Thornton et al. (Citation2013). This research aims to automate machine learning by writing autonomous decision-making algorithm design. The goal of AutoML is to independently design the entire process of machine learning pipeline (including feature extraction, data preprocessing, hyperparameter optimization, model selection, and fusion) to find the best model relative to the target metric on a given dataset. Feurer and Hutter (Citation2019) summarized the development and application of AutoML in a review article.
Auto-PyTorch and TPOT are excellent and typical models in open source AutoML platforms. Therefore, this study chooses these two models to participate in research training. Auto-PyTorch was proposed by Zimmer’s team. The early Auto-PyTorch platform focused more on the automatic selection and optimization of traditional machine learning models, and the subsequent deep learning framework relies on PyTorch framework (Zimmer et al. Citation2021). The framework uses multi-fidelity optimization to optimize the neural network architectures and hyperparameters. Auto-PyTorch implements and automatically tunes complete deep learning pipelines, including data preprocessing, neural architectures, network training techniques, and regularization methods. In addition, it performs optimization by sampling configurations from the portfolio and automatically integrating the selections. Meanwhile, AutoML models also include traditional machine learning models such as lightweight gradient boosting machines and support vector machines for solving regression or classification tasks. Bayesian optimization is introduced when using traditional machine learning models for filtering, and output models use an integrated model. The exploration results from previous model selection and hyperparameter selection are fully utilized. The use of the integrated model makes the previous results not wasted, further improving the generalization ability of the model. The TPOT framework proposed by Olson and Moore (Citation2016) is similar to the early Auto-PyTorch platform that pays more attention to the automatic selection and optimization of traditional machine learning models, but the main difference is that it does not currently support automatic deep learning.
3.2. Proposed framework
As can be seen from , the proposed framework is mainly divided into three stages, which are described in detail below:
In the first stage, we obtain global landslide inventory data and influencing factors, and data pre-processing is carried out. This study considered the internal factor of insufficient fine spatial resolution of global-scale landslide samples (COOLR, GFLD) and the external factor of low time efficiency of global-scale mapping (data volume). The influencing factor was resampled to a spatial resolution of 1000 m that is widely used in global landslide susceptibility studies. Global historical landslide data and landslide influencing factors are superimposed and analyzed, and divide into training data and test data. Next, evaluation models construct and compared with the open-source AutoML platform of Auto-PyTorch (Zimmer et al. Citation2021), TPOT (Olson and Moore Citation2016), the classical ensemble learning model of RF, and the traditional machine learning model of NB. Based on the comparison, we select the optimal model for global landslide susceptibility.
In the second phase, we validate the global LSP using multi-regional measured landslide inventory data and carry out regional LSP mapping for the above test areas. Note that the regional measured landslide inventory data are only involved in the validation, not in training and prediction mapping. There are only a few landslides with a spatial resolution of 1000 m globally, and the confidence level of regional measured landslide data is low. The choice of 1000 m spatial resolution for global LSP mapping is limited by data volume and other factors, and the spatial resolution cannot be increased to 90 m or even higher. In contrast, the prediction model using global landslide data with a spatial resolution of 90 m is only used to validate measured landslide data in small areas, which is clearly more suitable for subsequent studies than using data with a spatial resolution of 1000 m. Specifically, we first obtain the global landslide inventory data and influencing factors at a spatial resolution of 90 m. Then, after the same data preparation and pre-processing as the previous stage, the optimal model is selected for model building, and the training data and test data are divided. Next, the measured landslide data in the selected area are collected, and all the data sets are used as test data to test the LSP model trained on the global landslide data. The same trends between predicted plots and measured landslide data are considered as a criterion with a pre-defined threshold of AUC values.
In the third stage, we improve the application value of global LSP to regional LSP on the basis of the previous two stages. The regional LSP map of the second stage does not use the measured landslide data in this area. If the pre-selected study area lacks measured landslide data temporarily, the research on predicting landslide susceptibility in this area by using the global LSP will stay in the second stage. But if there are actual landslide data in the area, the regional low-susceptible area obtained from the global LSP can be used as a non-landslide sample to form training and test samples with the actual landslide data to improve the reliability of the results. The specific steps are summarized as follows. First, we select the measured landslide data as the landslide sample in the study area, and we use the low-susceptible area predicted by global landslide susceptibility as the non-landslide sample. Second, we use the selected optimal model to train and construct the model using the training data. Finally, we compare the prediction results in terms of visual inspection and objective evaluation metrics.
3.3. Evaluation indicators
In order to objectively evaluate the performance of the susceptibility prediction model, several statistical evaluation metrics are used in this study, including the receiver operating characteristic (ROC) curve, area under curve (AUC), accuracy (ACC), root mean square error (RMSE), and mean absolute error (MAE). The value range of AUC and ACC is 0 to 1. The value is closer to 1, the better the performance of the model. And the value range of RMSE and MAE is also between 0 and 1, but a lower value indicates a better performance of the model.
(1)
(1)
where TP and TN are the number of positive samples and negative samples that are correctly identified respectively, FP is the number of negative samples that are falsely reported, and FN is the number of positive samples that are missed. RMSE and MAE are calculated as follows:
(2)
(2)
(3)
(3)
where n is the number of measurements,
and
are real data and predicted data, respectively.
4. Results
4.1. Experimental settings
In this section, we describe the specific setup for each experiment. In this study, the experimental environment includes: 16-core CPU, 2 GPUs (NVIDIA GeForce RTX 3090, 24 GB memory) and 128 GB memory. The software environment is based on Python programming tools. The experimental models include two open source AutoML libraries of Auto-PyTorch and TPOT, and two machine learning models of RF and NB based on the Scikit-learn library.
Case 1: Global landslide susceptibility. We selected 70% of the data for training and the remaining 30% for testing. the spatial resolution of the data is 1000 meters. Detailed parameter settings for different methods can be found in . In this experiment, the parameters of the RF and NB methods are the default values in the Scikit-learn library.
Table 4. Parameter settings for different methods of global landslide susceptibility.
Case 2: Regional landslide validation. First, the global prediction model was constructed using the global LSP dataset as the training set, and the regional LSP dataset was used as the test set to verify effectiveness of the proposed framework modelled by Auto-PyTorch. The spatial resolution of the data is 90 meters. Second, the low-prone areas predicted by the global LSP model in the previous step were used as non-landslide samples, and the regional LSP dataset was used as landslide samples. The two were combined to form positive and negative sample data, and then divided into training (70%) and testing data (30%), and the spatial resolution of the data is 90 meters. The Auto-PyTorch was used for modelling with detailed parameter settings listed in .
Table 5. Parameter settings for Auto-PyTorch of regional landslide validation.
Case 3: Performance comparison at different training times. The training and test data are datasets for global LSP, which were divided according to the ratio of 70%:30%, and the spatial resolution of the data is 1000 meters. Detailed parameter settings for different methods can be found in .
Table 6. Parameter settings for different methods of performance comparison at different training times.
4.2 Global landslide susceptibility
In the first phase of this study, the LSP at the global scale used four methods for comparison, including two AutoML models of Auto-PyTorch and TPOT, as well as the RF ensemble learning model and the traditional NB model. The training time of Auto-PyTorch and TPOT was set to be 10 min. Noted that training time is particularly important for AutoML, and a comparative experiment to extend the training time will be carried out later. lists the objective evaluation of the four methods using evaluation metrics. It can be observed that the AUC values of all the methods are greater than 0.8, and all have achieved excellent results. Specifically, Auto-PyTorch has the best performance with the highest ACC and AUC and lowest RMSE and MAE values. The performance of the RF model is worse than that of Auto-PyTorch. Specifically, its ACC and AUC metrics are slightly lower than Auto-PyTorch by 0.0047, and its RMSE and MAE metrics are higher than Auto-PyTorch. Compared with Auto-PyTorch, the ACC and AUC metrics of TPOT decreased by 0.0103 and 0.0068, and the RMSE and MAE metrics of TPOT increased by 0.0159 and 0.0103, respectively. Although the performance of TPOT is comparable to RF, the training time of only 10 min is very limited for AutoML. The performance of NB is significantly inferior to the other methods. The ACC and AUC metrics of NB decreased by 0.1549 and 0.1239, and the RMSE and MAE metrics of NB increased by 0.1895 and 0.1549, respectively, compared to Auto-PyTorch. In addition, in terms of single training time cost, the cost of an AutoML model may be higher than that of traditional machine learning models such as random forest. However, the training time cost of random forest only includes a single model, which does not mean that the model trained under this time cost is the optimal model. More machine learning models must be selected for training comparison. The framework of an AutoML model includes many machine learning models, which solves this problem. Therefore, it is not possible to simply compare the training time cost of the model. This is a comparison between single model training and many model choices. In particular, the Auto-PyTorch model is good at improving accuracy while saving time and labour costs. The ROC curves of the four models are shown in . It can be seen that the Auto-PyTorch model significantly outperforms the traditional machine learning models due to the highest AUC value of 0.9632. The above experimental results verify the advantages of AutoML and show the application value of AutoML in global-scale LSP.
Figure 7. ROC curves of different prediction methods.
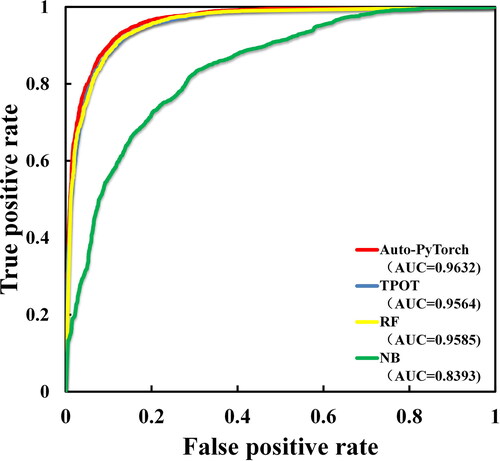
Table 7. Evaluation indications of different prediction methods.
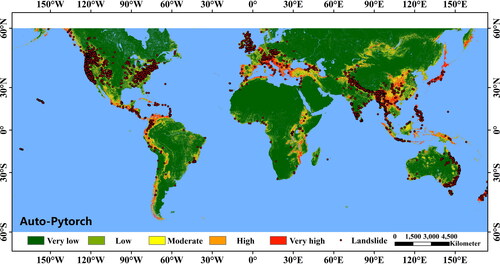
Based on the above observations, Auto-PyTorch was selected as the optimal model for global LSP mapping. The study area was divided into five levels by using the natural breakpoint method as very low, low, medium, high, and very high susceptibility zones (Pradhan and Lee, Citation2010). shows the global-scale LSP map overlaid with landslide inventory data. It can be seen that not only the evaluation indicators are superior, but also the derived susceptibility prediction result is close to the actual landslide situation.
Figure 8. Global landslide susceptibility map by Auto-PyTorch.
4.3. Regional landslide validation
The purpose of the second phase of this study is to validate the global LSP using the multiregional measured landslide inventory data and to map the regional LSP for the test areas mentioned above. In this phase, the regional measured landslide inventory data are only involved in the validation, not in the training and susceptibility mapping. The validation process is carried out with 90 m spatial resolution. The criteria for passing the evaluation index of all the validation areas are set as the AUC value of 0.55 or more and the vulnerability prediction map with the same trend as the measured landslide data.
After the repeated data preparation, the optimal model of Auto-PyTorch was selected for global LSP at the spatial resolution of 90 m, and the training time was set to 30 min. The ACC, AUC, RMSE and MAE were 0.9105, 0.9740, 0.2991 and 0.0895, respectively. To set the comparison group, the spatial resolution of 1000 m was selected. For 30 min training modeling, ACC, AUC, RMSE and MAE are 0.9028, 0.9624, 0.3116 and 0.0971, respectively. Compared to 1000 m model, the ACC, AUC of the 90 m model improve by 0.0077 and 0.0116, and the RMSE and MAE decrease by 0.0125 and 0.076, respectively. It shows that the improvement of spatial resolution can improve of the accuracy of the model to a certain extent without being limited by the time cost of mapping. lists the evaluation metrics of Auto-PyTorch at different spatial resolutions and shows the ROC curves of Auto-PyTorch at 90 m and 1000 m spatial resolutions, as the training time is 30 min.
Figure 9. ROC curves of Auto-PyTorch.
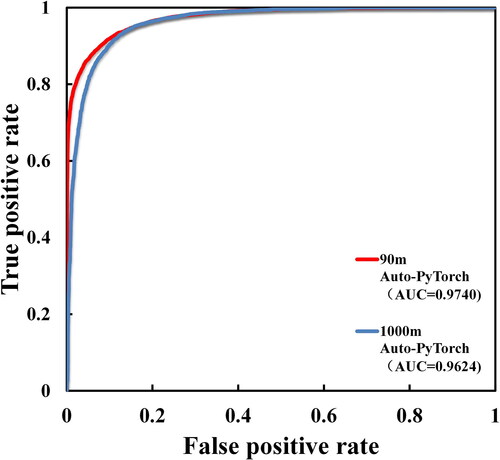
Table 8. Performance of Auto-PyTorch at different spatial resolution with a training time of 30 min.
4.3.1. National level
After the model construction, the validation of regional landslide data is divided into three levels of national, provincial, and prefectural. National landslide datasets include Ireland, Denmark, and Norway. lists the validated AUC values of the three country-level data. The AUC value of the Denmark dataset is 0.9383, which is an excellent result when the dataset does not involve in training. The AUC value of the Norway dataset has an AUC value of 0.7416, which is much higher than the preset value of 0.55, while the AUC value of the Ireland dataset is slightly lower than the threshold.
Table 9. AUC values of different national datasets.
The very low and low susceptibility areas of the three regions in the previous step were randomly selected as non-landslide samples and combined with the measured landslide data as training test samples. The landslide susceptibility models were constructed and predicted out of the three regions separately using the Auto-Pytorch model, and the evaluation index AUC values are shown in the , and the landslide susceptibility classes were classified into five classes according to the natural breakpoint method: very low, low, medium, high, and very high susceptibility areas. The predicted landslide hazard susceptibility results for Ireland, Denmark, and Norway are shown in , respectively. The three susceptibility maps yield excellent susceptibility predictions, with AUC values above 0.95, 0.9746 for Ireland, 0.9975 for Denmark, and 0.9564 for Norway, which are more consistent with the actual landslide situation after adding local measurements. The study fully illustrates the high reference significance and reliability of applying the results of global LSP to national LSP. It is also clear that selecting non-landslide samples from very low and low susceptible areas in the global landslide susceptibility map can significantly improve if the AUC values of the three datasets.
Figure 10. National landslide susceptibility maps by Auto-PyTorch. (a) and (d) Ireland, (b) and (e) Denmark, (c) and (f) Norway (part). the first line shows the results of Auto-PyTorch when the specified area is selected in the global LSP map., and the second line shows the results of Auto-PyTorch when non-landslide samples are selected from the low susceptible areas of the obtained global landslide susceptibility maps.
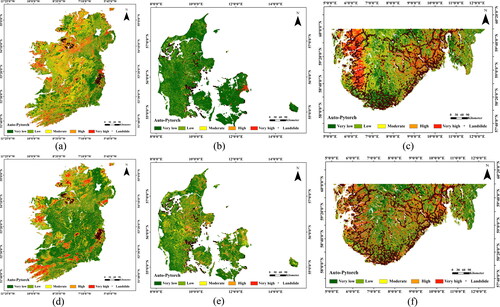
The landslide hazard susceptibility prediction results of the Ireland, Denmark and Norway datasets are shown in . It can be observed that all six maps yielded susceptibility predictions suitable for actual landslide conditions. Specifically, there are few landslide data in Ireland, and the landslide susceptibility is more complicated, but the actual landslide data are basically located in very high susceptible areas, and there is no measured landslide data distributed in very low susceptible areas. The landslides measured in Denmark are mainly distributed on the edge of rivers and oceans, which are in good agreement with the prediction result, and they are all located in very high susceptible areas. Due to the limitation of the latitude range of 60°N − 60°S in Norway, only part of the data in the study area was taken, but the amount of landslide data in the validation set was large, and the area was selected for validation to achieve the purpose of this study. The measured landslides in Norway are similar to those in Denmark. For example, they are mainly located on the edges of rivers and oceans, and are all located in very high susceptible areas. The observations demonstrate that applying the global LSP results to some selected countries has high superiority and reliability.
4.3.2 Provincial level
The constructed Auto-PyTorch model was used to predict landslide susceptibility of the three provinces. shows the predicted landslide susceptibility maps for Italy’s Veneto and Puglia Provinces and China’s Shaanxi Province. We can see that the landslide susceptibility results are in line with the actual landslide situation of landslides. Specifically, the LSP map in Veneto, Italy fits very well with the measured landslide data, and the measured landslide data are located in high and very high susceptible areas. The measured landslides in Apulia, Italy are mainly distributed on the edges of rivers and oceans, which are in good agreement with the prediction results, and they are all located in very high susceptible areas. In Shaanxi Province, China, most of the middle and lower parts of the susceptibility prediction map are in good agreement with the measured landslide, while a small part of the upper part is located in the middle susceptibility area. After the experiment, it is inferred that such experimental results have a great relationship with the fault distance influence factor in the landslide influence factor. Because the middle and lower parts of Shaanxi Province are too close to the fault, the susceptibility level below is much higher than that above. Since the lower part of Shaanxi Province, China, is relatively close to the fault, the susceptibility is generally high, which is also in line with the actual situation. In general, the global LSP results are highly informative and reliable for provincial applications.
Figure 11. Provincial landslide susceptibility maps by Auto-PyTorch. (a) and (d) Veneto Province, Italy, (b) and (e) Apulia Province, Italy, (c) and (f) Shaanxi Province, China. The first line shows the results of Auto-PyTorch when the specified area is selected in the global LSP map, and the second line shows the results of Auto-PyTorch when non-landslide samples are selected from the low susceptible areas of the obtained global landslide susceptibility maps.
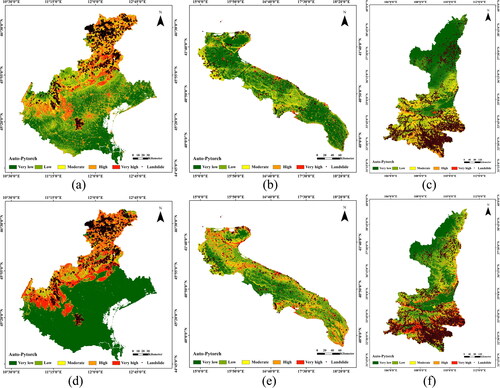
The validated AUC values from the data of the three provinces are shown in the . It can be seen that the AUC values of the global LSP maps are above 0.7 in all three regions when regional data are not involved in the training scenario. The AUC values of the three areas can be higher than 0.88, when non-landslide samples were selected from the low susceptible areas of the obtained global landslide susceptibility maps in . It suggests that reliable non-landslide samples obtained from global LSP results can effectively improve provincial landslide prediction performance.
Table 10. AUC values of different provincial datasets.
4.3.3 Prefectural level
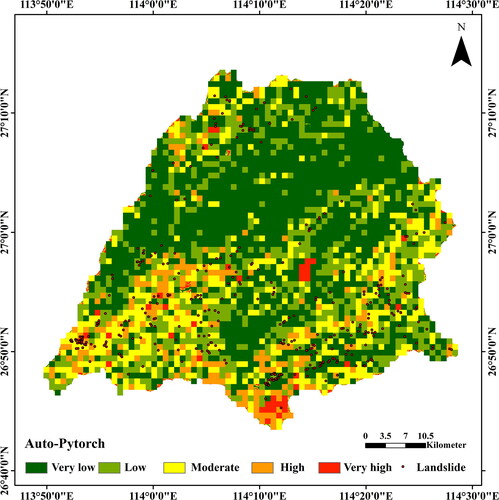
In this study, Yongxin County, China and the earthquake zones of Hokkaido, Japan were selected to validate the effectiveness of the global landslide susceptibility result. lists the validated AUC values of the three country-level data. The AUC values of the two test datasets are 0.6674 and 0.5842, meeting the preset criteria for validation. show landslide susceptibility maps for the two test datasets using Auto-PyTorch. It can be observed that the measured landslide data are in good agreement with the predicted landslide susceptibility. This also demonstrates that the of global LSP results are also very valuable and reliable for prefectural areas.
Figure 12. Prefectural landslide susceptibility maps by Auto-PyTorch. (a) and (c) Yongxin County, China, (b) and (d) the earthquake zones of Hokkaido, Japan. The first line shows the results of Auto-PyTorch when the specified area is selected in the global LSP map, and the second line shows the results of Auto-PyTorch when non-landslide samples are selected from the low susceptible areas of the obtained global landslide susceptibility maps.
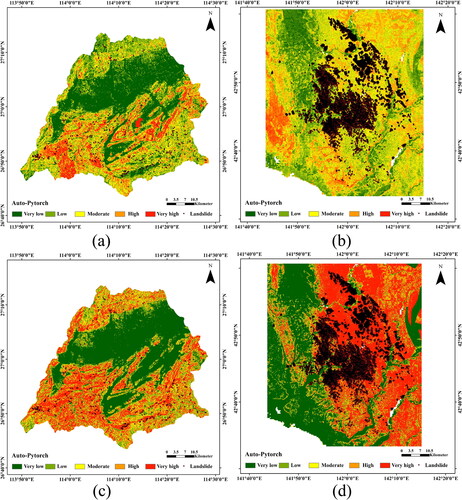
Table 11. AUC values of different prefectural datasets.
We randomly selected the extremely low and low susceptibility areas of the earthquake zone in Yongxin County, China and Hokkaido, Japan in the previous step as non-landslide samples, and combined with the measured landslide data as training test samples. The construction of landslide susceptibility model and the prediction of the map for Yongxin County and the earthquake zones of Hokkaido using the Auto-PyTorch model reached an AUC value of 0.9603, and the landslide susceptibility classes were classified into five classes according to the natural breakpoint method: very low, low, medium, high and very high susceptibility areas. The landslide hazard susceptibility prediction results are shown in , respectively. As in the previous study, the actual landslide situation is more closely matched after adding local measured data. In summary, the study fully illustrates that applying the results of global LSP to all levels and sizes of regional LSP has a very high reference significance and greatly improves the reliability of regional LSP.
To compare the applicability of 90-meter and 1000-meter spatial resolution mapping in prefectural areas, we used the Auto-PyTorch model to predict the 1000-meter landslide susceptibility of Yongxin County, China, as shown in . It can be seen that the prefectural -level landslide hazard map with a spatial resolution of 1000 m can only obtain rough prediction results. Because the result resolution is too low, it cannot be applied to the actual landslide prediction work. It is meaningful to use the results of global LSP for further research and learn from regional LSP with higher spatial resolution, without being limited by the time cost of mapping.
Figure 13. 1000m spatial landslide susceptibility map (Yongxin County, China).
4.4. Performance comparison at different training times
This section is to analyze the impact of training time on the performance of Auto-PyTorch and TPOT. To better compare the performance of AutoML, we compared it with the best performing RF model. In this section, the inventory data with a spatial resolution of 1000 meters was selected as the training test data, and three different training times of 10, 20 and 30 min were preset as comparisons to explore the potential of AutoML. It should be noted that the selection of AutoML’s parameters is mainly modulated according to the obtained ACC values. The evaluation metrics of the two AutoML models under different training time are listed in . It can be seen that the performance of the AutoML models will continue to improve as the training time increases. Among them, the AUC value of the Auto-PyTorch model trained for 30 min is slightly lower than that of the model trained for 10 min by 0.0008, but the other three metrics have improved. For example, ACC was increased 0.0014, REMS and MAE were decreased by 0.0023 and 0.0014, respectively. Also, all evaluation metrics of TPOT increase over time. The previous experiments have shown that the metrics of TPOT trained for 10 min are slightly lower than those of the RF model, but the metrics of TPOT trained for 30 min exceed RF. Specifically, ACC and AUC were increased by 0.0014 and 0.0027, RMSE and MAE were decreased by 0.0019 and 0.0013, respectively. However, the metrics of TPOT trained for 30 min are also lower than those of Auto-PyTorch trained for 10 min, again showing that Auto-PyTorch is indeed the optimal model in the current study. In conclusion, both the two AutoML models outperformed the RF and NB models, demonstrating the potential and excellence of AutoML. Moreover, also shows the ACC values over time for the two AutoML models and the RF model. A longer training time does not help much in this study, and blindly increasing the training time may lead to the complexity of the model and a sharp increase in the prediction time. In general, no more than 30 min of training is provided. Readers can further increase the training time to explore the potential of the AutoML models if desired.
Figure 14. Evaluation indicators values over time over time for the two AutoML models and the RF model. (a) ACC, (b) AUC, (c) MAE and (d) RMSE.
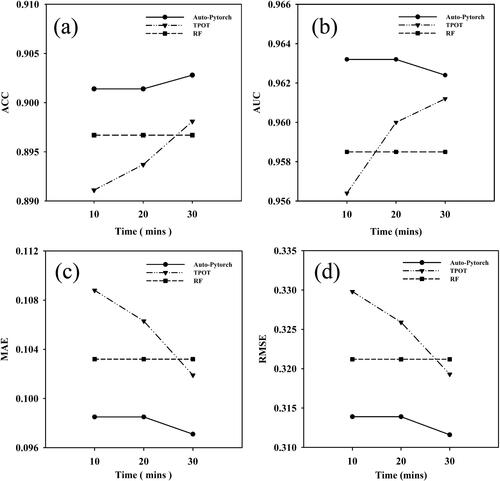
Table 12. Performance of two AutoML models under different training time.
5. Discussions
In summary, this study is mainly divided into two parts, one is to use the AutoML model to predict landslide susceptibility at a global scale, and the second is to use the global susceptibility prediction results to better predict regional landslide susceptibility. Single prediction model selection and extremely low spatial resolution of inventory data are the two shackles of previous global landslide susceptibility studies. In this end, this study solves this difficulty by opting for AutoML to address the model selection problem and inclusion to regional LSP with a spatial resolution of 90 m. Specifically, most of the existing studies on landslide susceptibility use various prediction models to simulate global landslide susceptibility to improve accuracy. This study introduces the AutoML framework containing a suite of machine learning models to solve the model selection problem, reducing the manpower spent on model selection and parameter adjustment, as well as human interference in the modeling process. Compared with other regional landslide susceptibility studies (Swetha and Gopinath Citation2020; Achu et al. Citation2021; Pham et al. Citation2021; Achu et al. Citation2022), our AutoML achieves superior performance and more reliable prediction results. Moreover, we admit that the size of landslide samples is important in machine learning modelling (Achu et al. Citation2023), but the global landslide inventory contains enough landslide samples for AutoML training.
In addition, this study systematically explores the positive impact of global susceptibility results on regional LSP. We used extensive and rich inventory data from around the world to refine and remap predictions for the region. In terms of spatial resolution, the current global-scale research pays more attention to the trend of the global overall susceptibility, and its spatial resolution is generally below 1000 meters, mostly tens of kilometres to several radians. In the stage of global LSP, similar to previous studies, the spatial resolution of LSP in this study was set at 1000 m to meet the mapping time and cost requirements. In addition, the spatial resolution of LSP is increased to 90 meters without time and cost constraints, and the visual effects of the two spatial resolution mappings are locally compared. The experiments demonstrate that using the global landslide inventory data with a spatial resolution of 90 m or higher to train the susceptibility prediction model can directly verify the regional prediction results without the need for regional inventory data to participate in the training, and the obtained prediction results are very reliable at all scales. It suggests that applying the benefits of global susceptibility predictions to regions is highly applicable, and it is expected that our framework can help improve landslide susceptibility outcomes in any local region.
The construction of training samples is the most critical for landslide susceptibility research. In existing studies, when constructing training and testing sets of non-landslide samples, random samples outside the buffer zones where landslides were actually measured were selected. This strategy is likely to cause insufficient reliability of non-landslide samples and significantly reduce the accuracy of susceptibility prediction results. In order to further improve the performance of the AutoML model, this study uses the low susceptible area obtained from the global LSP as the source of non-landslide samples, and the training and test samples together with the measured landslides constitute the data. The results prove that using the low susceptibility areas in the global landslide susceptibility map to obtain non-landslide samples can effectively improve the prediction accuracy of landslide susceptibility.
6. Conclusions
In this study, we used an AutoML model to predict global landslide susceptibility at a spatial resolution of 1000 m and 90 m. The application of AutoML can avoid the model selection and parameter optimization problems by using a more macroscopic selection method. Moreover, we validated the global prediction result by using the landslide inventories in different regions and scales. Avoiding the selection of only different models, thereby reducing duplication of susceptibility studies. Results demonstrated that the AutoML model achieved an excellent prediction performance with AUC values above 0.96, and the performance is better than common machine learning models of TPOT, RF, and NB. In addition, we find that taking the global landslide low susceptibility area as the regional landslide non-landslide sample selection area is more reliable than the conventional non-landslide sample selection method. Finally, the results of sensitivity of AutoML training time demonstrate that a longer training time does not help much in this study, and may lead to the complexity of the model. However, we admit that the AutoML is uninterpretable that cannot provide instructive information such as the importance of the influencing factors. In the future, we expect the can be effectively improved by using explainable artificial intelligence techniques.
Data availability statement
The data and codes are available upon request to the authors.
Disclosure statement
No potential conflict of interest was reported by the authors.
Additional information
Funding
References
- Achour Y, Boumezbeur A, Hadji R, Chouabbi A, Cavaleiro V, Bendaoud EA. 2017. Landslide susceptibility mapping using analytic hierarchy process and information value methods along a highway road section in Constantine, Algeria. Arab J Geosci. 10(8):1–16. doi: 10.1007/s12517-017-2980-6.
- Achu AL, Aju CD, Pham QB, Reghunath R, Anh DT. 2022. Landslide susceptibility modelling using hybrid bivariate statistical-based machine-learning method in a highland segment of Southern Western Ghats, India. Environ Earth Sci. 81(13):360. doi: 10.1007/s12665-022-10464-z.
- Achu AL, Joseph S, Aju CD, Mathai J. 2021. Preliminary analysis of a catastrophic landslide event on 6 August 2020 at Pettimudi, Kerala State, India. Landslides. 18(4):1459–1463. doi: 10.1007/s10346-020-01598-x.
- Achu AL, Thomas J, Aju CD, Remani PK, Gopinath G. 2023. Performance evaluation of machine learning and statistical techniques for modelling landslide susceptibility with limited field data. Earth Sci Inform. 16(1):1025–1039. doi: 10.1007/s12145-022-00910-8.
- Aditian A, Kubota T, Shinohara Y. 2018. Comparison of GIS-based landslide susceptibility models using frequency ratio, logistic regression, and artificial neural network in a tertiary region of Ambon, Indonesia. Geomorphology. 318:101–111. doi: 10.1016/j.geomorph.2018.06.006.
- Akbar TA, Ha SR. 2011. Landslide hazard zoning along Himalayan Kaghan Valley of Pakistan—by integration of GPS, GIS, and remote sensing technology. Landslides. 8(4):527–540. doi: 10.1007/s10346-011-0260-1.
- Arino O. 2010. GlobCover 2009.
- Calvello M, Pecoraro G. 2018. FraneItalia: a catalog of recent Italian landslides. Geoenviron Disasters. 5(1):1–16. doi: 10.1186/s40677-018-0105-5.
- Chen J, Chen K, Chen X, Qiu X, Huang X. 2018. Exploring shared structures and hierarchies for multiple NLP tasks. arXiv preprint arXiv:1808.07658.
- Chen W, Shirzadi A, Shahabi H, Ahmad BB, Zhang S, Hong H, Zhang N. 2017. A novel hybrid artificial intelligence approach based on the rotation forest ensemble and naïve Bayes tree classifiers for a landslide susceptibility assessment in Langao County, China. Geomatic Nat Hazard Risk. 8(2):1955–1977. doi: 10.1080/19475705.2017.1401560.
- Colkesen I, Kavzoglu T. 2016. Performance evaluation of rotation forest for SVM-based recursive feature elimination using hyperspectral imagery. 2016 8th Workshop on Hyperspectral Image and Signal Processing: Evolution in Remote Sensing (WHISPERS), IEEE. p. 1–5. doi: 10.1109/WHISPERS.2016.8071792.
- Dou J, Yunus AP, Bui DT, Merghadi A, Sahana M, Zhu Z, Chen C-W, Khosravi K, Yang Y, Pham BT. 2019. Assessment of advanced random forest and decision tree algorithms for modeling rainfall-induced landslide susceptibility in the Izu-Oshima Volcanic Island, Japan. Sci Total Environ. 662:332–346. doi: 10.1016/j.scitotenv.2019.01.221.
- Elliott A, Harty K. 2010. Landslide maps of Utah, Ogden 30 ‘X 60’ quadrangle: Utah Geological Survey Map 246DM, 14. p. 46 plates, scale 1: 100,000.
- Erener A, Mutlu A, Düzgün HS. 2016. A comparative study for Landslide susceptibility mapping using GIS-based multi-criteria decision analysis (MCDA), logistic regression (LR) and association rule mining (ARM). Eng Geol. 203:45–55. doi: 10.1016/j.enggeo.2015.09.007.
- Fabbri AG, Chung C-JF, Cendrero A, Remondo J. 2003. Is prediction of future landslides possible with a GIS? Natural Hazards. 30(3):487–503. doi: 10.1023/B:NHAZ.0000007282.62071.75.
- Faes L, Wagner SK, Fu DJ, Liu X, Korot E, Ledsam JR, Back T, Chopra R, Pontikos N, Kern C, et al. 2019. Automated deep learning design for medical image classification by health-care professionals with no coding experience: a feasibility study. Lancet Digit Health. 1(5):e232–e242. doi: 10.1016/S2589-7500(19)30108-6.
- Felsberg A, Heyvaert Z, Poesen J, Stanley T, De Lannoy GJ. 2023. Probabilistic Hydrological Estimation of LandSlides (PHELS): global ensemble landslide hazard modelling. EGUsphere. p. 1–27.
- Felsberg A, Poesen J, Bechtold M, Vanmaercke M, De Lannoy GJ. 2021. Estimating global landslide susceptibility and its uncertainty through ensemble modelling. Nat Hazards Earth Syst Sci Discuss. 22(9):1–30.
- Feurer M,Hutter F. 2019. Automated Machine Learning. Cham, Switzerland: Springer. p. 3–33. Hyperparameter Optimization.
- Fick SE, Hijmans RJ. 2017. WorldClim 2: new 1-km spatial resolution climate surfaces for global land areas. Int J Climatol. 37(12):4302–4315. doi: 10.1002/joc.5086.
- Froude MJ, Petley DN. 2018. Global fatal landslide occurrence from 2004 to 2016. Nat Hazards Earth Syst Sci. 18(8):2161–2181. doi: 10.5194/nhess-18-2161-2018.
- Ghiasi G, Lin T-Y, Le QV. 2019. NAS-FPN: Learning Scalable Feature Pyramid Architecture for Object Detection. Proceedings of the IEEE/CVF Conference on Computer Vision and Pattern Recognition. p. 7036–7045.
- Harris I, Jones PD, Osborn TJ, Lister DH. 2014. Updated high-resolution grids of monthly climatic observations – the CRU TS3.10 Dataset. Int J Climatol. 34(3):623–642. doi: 10.1002/joc.3711.
- Hartmann J, Moosdorf N. 2012. The new global lithological map database GLiM: a representation of rock properties at the Earth surface. Geochem Geophys Geosyst. 13(12):1–37. doi: 10.1029/2012GC004370.
- He X, Wang S, Shi S, Chu X, Tang J, Liu X, Yan C, Zhang J, Ding G. 2020. Benchmarking deep learning models and automated model design for COVID-19 detection with chest CT scans. MedRxiv.
- Hong Y, Adler R, Huffman G. 2007. Use of satellite remote sensing data in the mapping of global landslide susceptibility. Nat Hazards. 43(2):245–256. doi: 10.1007/s11069-006-9104-z.
- Jarvis J, Reuter H, Nelson A, Guevara E. 2008. Hole-filled SRTM for the Globe, CGIAR-CSI SRTM 90m Database, Version 4. CGIAR Consort for Spatial Inf.
- Juang CS, Stanley TA, Kirschbaum DB. 2019. Using citizen science to expand the global map of landslides: introducing the Cooperative Open Online Landslide Repository (COOLR). PLoS One. 14(7):e0218657. doi: 10.1371/journal.pone.0218657.
- Kavzoglu T, Sahin EK, Colkesen I. 2014. Landslide susceptibility mapping using GIS-based multi-criteria decision analysis, support vector machines, and logistic regression. Landslides. 11(3):425–439. doi: 10.1007/s10346-013-0391-7.
- Khan S, Kirschbaum DB, Stanley TA, Amatya PM, Emberson RA. 2022. Global landslide forecasting system for hazard assessment and situational awareness. Front Earth Sci. 10:878996. doi: 10.3389/feart.2022.878996.
- Li C, Yuan X, Lin C, Guo M, Wu W, Yan J, Ouyang W. 2019. AM-LFS: automl for loss function search. Proceedings of the IEEE/CVF International Conference on Computer Vision. p. 8410–8419.
- Lin L, Lin Q, Wang Y. 2017. Landslide susceptibility mapping on a global scale using the method of logistic regression. Nat Hazards Earth Syst Sci. 17(8):1411–1424. doi: 10.5194/nhess-17-1411-2017.
- Liu C, Chen L-C, Schroff F, Adam H, Hua W, Yuille AL, Fei-Fei L. 2019. Auto-deeplab: hierarchical neural architecture search for semantic image segmentation. Proceedings of the IEEE/CVF Conference on Computer Vision and Pattern Recognition. p. 82–92.
- Luetzenburg G, Svennevig K, Bjørk AA, Keiding M, Kroon A. 2022. A national landslide inventory for Denmark. Earth Syst Sci Data. 14(7):3157–3165. doi: 10.5194/essd-14-3157-2022.
- Mckeon C. 2016. National landslide susceptibility mapping project summary. Final Report. Geological Survey Ireland.
- Olson RS, Moore JH. 2016. TPOT: a tree-based pipeline optimization tool for automating machine learning. Workshop on Automatic Machine Learning. PMLR. p. 66–74.
- Osuchowski M, Atkinson R. 2008. Connecting diverse landslide inventories for improved information in Australia. Proceedings of the First World Landslide Forum, Tokyo, Japan. p. 67–70.
- Peng YH, Peng K, Zhou J, Liu ZX. 2014. Prediction of classification of rock burst risk based on genetic algorithms with SVM. AMM. 628:383–389. doi: 10.4028/www.scientific.net/AMM.628.383.
- Pham QB, Achour Y, Ali SA, Parvin F, Vojtek M, Vojteková J, Al-Ansari N, Achu AL, Costache R, Khedher KM, et al. 2021. A comparison among fuzzy multi-criteria decision making, bivariate, multivariate and machine learning models in landslide susceptibility mapping. Geomatics Nat Hazards Risk. 12(1):1741–1777. doi: 10.1080/19475705.2021.1944330.
- Pradhan B,Lee S. 2010. Landslide susceptibility assessment and factor effect analysis: backpropagation artificial neural networks and their comparison with frequency ratio and bivariate logistic regression modelling. Environmental Modelling & Software. 25(6):747–759. doi:10.1016/j.envsoft.2009.10.016.
- Rosser B, Dellow S, Haubrock S, Glassey P. 2017. New Zealand’s national landslide database. Landslides. 14(6):1949–1959. doi: 10.1007/s10346-017-0843-6.
- Ru B, Lyle C, Schut L, Van Der Wilk M, Gal Y. 2020. Revisiting the train loss: an efficient performance estimator for neural architecture search.
- Shahri AA, Spross J, Johansson F, Larsson S. 2019. Landslide susceptibility hazard map in southwest Sweden using artificial neural network. Catena. 183:104225. doi: 10.1016/j.catena.2019.104225.
- Slaughter S, Burns W, Mickelson K, Jacobacci K, Biel A, Contreras T. 2017. Protocol for landslide inventory mapping from lidar data in Washington State. Washington Geological Survey, USGS. p. 1–26.
- Snoek J, Larochelle H, Adams RP. 2012. Practical bayesian optimization of machine learning algorithms. Adv Neural Inform Process Syst. 25:2951–2959.
- Stanley T, Kirschbaum DB. 2017. A heuristic approach to global landslide susceptibility mapping. Nat Hazards (Dordr). 87(1):145–164. doi: 10.1007/s11069-017-2757-y.
- Stanley TA, Kirschbaum DB, Benz G, Emberson RA, Amatya PM, Medwedeff W, Clark MK. 2021. Data-driven landslide nowcasting at the global scale. Front Earth Sci. 9:640043. doi: 10.3389/feart.2021.640043.
- Styron R, Pagani M. 2020. The GEM global active faults database. Earthquake Spectra. 36(1_suppl):160–180. doi: 10.1177/8755293020944182.
- Swetha TV, Gopinath G. 2020. Landslides susceptibility assessment by analytical network process: a case study for Kuttiyadi river basin (Western Ghats, southern India). SN Appl Sci. 2(11):1776. doi: 10.1007/s42452-020-03574-5.
- Taalab K, Cheng T, Zhang Y. 2018. Mapping landslide susceptibility and types using Random Forest. Big Earth Data. 2(2):159–178. doi: 10.1080/20964471.2018.1472392.
- Thornton C, Hutter F, Hoos HH, Leyton-Brown, K. 2013. Auto-WEKA: Combined selection and hyperparameter optimization of classification algorithms, Proceedings of the 19th ACM SIGKDD International Conference on Knowledge Discovery and Data Mining, United States, 2013, August
- Tsangaratos P, Ilia I. 2016. Comparison of a logistic regression and Naïve Bayes classifier in landslide susceptibility assessments: the influence of models complexity and training dataset size. Catena. 145:164–179. doi: 10.1016/j.catena.2016.06.004.
- Vennari C, Salvati P, Bianchi C, Casarano D, Parise M, Basso A, Marchesini I. 2022. AReGeoDatHa: Apulian regional GeoDatabase for geo-hydrological hazards. J Environ Manage. 322:116051. doi: 10.1016/j.jenvman.2022.116051.
- Wang Q, Li W, Xing M, Wu Y, Pei Y, Yang D, Bai H. 2016. Landslide susceptibility mapping at Gongliu county, China using artificial neural network and weight of evidence models. Geosci J. 20(5):705–718. doi: 10.1007/s12303-016-0003-3.
- Weng Y, Zhou T, Li Y, Qiu X. 2019. Nas-unet: Neural architecture search for medical image segmentation. IEEE Access. 7:44247–44257. doi: 10.1109/ACCESS.2019.2908991.
- Xu H, Yao L, Zhang W, Liang X, Li Z. 2019. Auto-fpn. Automatic Network Architecture Adaptation for Object Detection beyond Classification. Proceedings of the IEEE/CVF International Conference on Computer Vision. p. 6649–6658.
- Zêzere J, Pereira S, Melo R, Oliveira S, Garcia RA. 2017. Mapping landslide susceptibility using data-driven methods. Sci Total Environ. 589:250–267. doi: 10.1016/j.scitotenv.2017.02.188.
- Zimmer L, Lindauer M, Hutter F. 2021. Auto-PyTorch: multi-fidelity metalearning for efficient and robust AutoDL. IEEE Trans Pattern Anal Mach Intell. 43(9):3079–3090. doi: 10.1109/TPAMI.2021.3067763.