
 ?Mathematical formulae have been encoded as MathML and are displayed in this HTML version using MathJax in order to improve their display. Uncheck the box to turn MathJax off. This feature requires Javascript. Click on a formula to zoom.
Abstract
The world’s water demand is increasing twice as quickly as the world’s population. Contrarily, the greatest problem facing humanity in the twenty-first century is the supply of food. During dry seasons, when water collecting is a crucial survival strategy, the communities in the study area experience water deficit for agricultural production. In this study, socioeconomic and biophysical parameters were considered to evaluate the water harvesting zone for irrigation practices. With the aid of this technology, water harvesting sites can be found in acceptable sites, and water resource management can be improved to address water shortages during the dry season when crops are at key stages of growth and filling. The integrated geographical information system/Remote Sensing (GIS/RS), Soil Water Assessment Tool (SWAT), fuzzy logic, and analytic hierarchy process (AHP) model were used to carry this out. Rainfall, drainage density, surface runoff, percentage of clay content, land use land cover, slope, lithology, lineament, and Euclidian distance to settlement and road were the criteria utilized to choose the Rainwater Harvesting (RWH) sites. The run-off was estimated using the SWAT model, weights for each influential component were determined using AHP, the input factor was standardized using fuzzy membership, and factors were combined using gamma fuzzy (ℽ= 0.9) overlay weighting. The model’s statistical performance was demonstrated by R2 values of 0.79 and NSE values of 0.77 for monthly calibration periods and R2 values of 0.81 and NSE values of 0.75 for monthly validation periods. The study area’s Rainwater Harvesting potential suitability classes covered very highly suitable (16.91%), extremely suitable (27.6%), moderately suitable (20.23%), low suitable (13.1%), and not suitable (6.43%), and restrictions (15.73%). The study’s findings could help decision-makers identify more lucrative and long-lasting irrigation investment options in the Keleta watershed and make better decisions regarding the development of irrigation projects there.
1. Introduction
The tremendous expansion of the human population over the past few decades has resulted in a significantly increased demand for water (Wu et al. Citation2018). The world’s population is expanding, but the demand for water is doubling at that rate. Due to the world’s expanding population, rapid urbanization, industrial management, and irrigated agriculture, which results in water scarcity, the world’s existing water resources are under strain (Wu et al. Citation2018). The 2014 report from the UN claims water stress is anticipated to affect two-thirds of the population by 2025, while water scarcity would affect around 1.8 billion people. The majority of water-stressed people live in sub-Saharan African countries, according to FAO (Citation2015) estimates.
Contrarily, the greatest difficulty facing humanity in the twenty-first century is the supply of food. The majority of the world’s poor people are dependent on rainfed agriculture for food and income, which ensures their security of livelihood, as stated in FAO (Citation2015). Water is the primary barrier to increasing agricultural output in rainfed agriculture because of the significant rainfall unpredictability, lengthy dry seasons, and dry spells that can occur within a single season. However, due to global warming, uneven rainfall distribution, and the loss of freshwater supplies, rainfed agriculture today suffers a severe water scarcity for crop production during the dry season, making water collecting an essential survival skill (Al-Khuzaie et al. Citation2020). Rainwater Harvesting is being encouraged to overcome water scarcity as a supplementary source for agricultural uses in semiarid regions (Rusa and Bertu Citation2018).
The Ethiopian economy’s mainstay is crop production, which is primarily carried out in rainfed environments. Climate variability, however, has an impact on this industry (Worqlul et al. Citation2019). Water availability for agriculture and changes to hydrologic cycles are projected to be two of the main effects of climate variability. The combination of increasing temperature and decreasing precipitation, according to Mehari, should result in more acute and frequent drought periods as well as a net decrease in the availability of freshwater. Communities, particularly those in semi-arid and sub-humid regions like the Keleta river watershed (Tibebe and Bewket Citation2011). The research area has suffered unpredictable rainfall that is geographically and temporally unequally distributed, hurting crops and range vegetation at their crucial growth and filling stages, which results in a sizable decline in the overall production. In addition, the water needs of crops cannot be met seasonally; in particular, the water deficit is greatest in April and May, the most critical time for raising onion seeds. The maize plant also goes through the initial and developmental stages. These stages have the greatest impact on yield. However, the average yield increases by 40% when very little water just two or three times per cropping period is used (Chengxiang et al. Citation2015).
During the rainy season, runoff volumes increased over the surface, resulting in environmental disasters such flooding and soil erosion (Tibebe and Bewket Citation2011). According to Negash et al. (Citation2020) 10% to 40% of the rainfall was converted to surface runoff. But diverse water-use sectors, particularly agriculture, can manage and benefit from excessive runoff. Rainwater Harvesting also offers a superior remedy for drainage issues, water scarcity, and flood inundation. Although there is enormous potential for RWH in the research area, there is a significant information gap regarding the selection of the best locations for harvesting. Maximizing the amount of water available and the productivity of the land in the study areas requires the identification of viable RWH sites. Also, the better site selection must consider the socio-economic and physical characteristics of a study area (Harka et al. Citation2020).
It has been challenging to identify and delineate RWH prospective zones for surface irrigation methods using photogrammetry and aerial images. GIS tools and a variety of themed maps have been used. These conventional methods are time-consuming and prone to mistakes brought on by physical labor (Munyao Citation2010). In a while, suitability mapping with GIS provides a flexible, rapid, and affordable solution to evaluate a large area’s suitability for RWH and support decision-making (Ouerchefani et al. Citation2013).
Hence, a reliable technique is needed to help water resource management identify and map potential sources of water harvesting. AHP technique, fuzzy logic, the hydrological model, and GIS/RS technologies have not been used in research to identify suitable RWH locations in the studied area. This is important since the Keleta watershed practices irrigation.
The main goal of this research was to estimate run-off and assessing water harvesting zone for irrigation practices in the Keleta river watershed using GIS/RS with SWAT model integrated fuzzy logic and analytic hierarchy process model. In general, the importance of this research was for the community, who were extremely vulnerable to the scarcity of water in the study area, as well as supplies of water close to cultivated land, to change the farmer’s standard of living and to spend on collecting water and the requirements of water for feeding the livestock can be met; for researchers, who will be doing concerning RWH by providing perceptions on the key factors that affect rainwater harvesting; it was used to determine the importance of RWH.
2. Materials and methods
2.1. Description of study area
Southwest Ethiopia’s Arsi zone is home to the Keleta river basin, which makes up the upper reaches of the Awash river drainage system. It is situated 200 kilometers east of Addis Ababa, the capital city of Ethiopia, between latitudes 7°53′49′′ and 8°26′01′′N and longitudes 39°14′34′′ and 39°32′40′′E. It is one of the primary sources of the Awash River. The watershed has an 811.39 km2 drainage area. Two towns, Huruta and Arb Gebeya, are located in the watershed, as depicted in .
Figure 1. Location map of the study area.
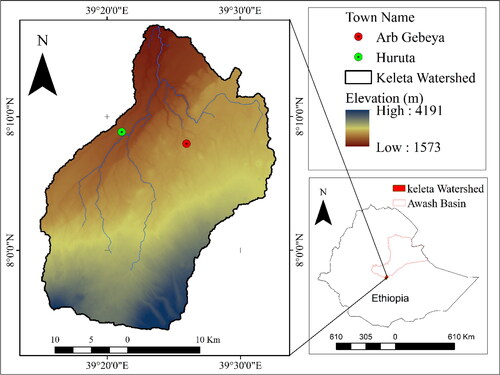
Keleta Watershed’s topography is extremely varied. The watershed’s elevation ranges from 1573 to 4191 meters above sea level. Chelalo Mountain, one of the tallest mountains in Ethiopia, forms the top boundary of the watershed and stretches to the lower boundary, which is the primary channel of the Awash river.
The climate of the watershed varies from warm semi-arid in the lower section to cool sub humid in the top part based on the agricultural ecological zones of Ethiopia. The mean maximum and lowest temperatures in the watershed are 27 °C and 13 °C, respectively, with an average annual rainfall of 901.3 mm. The temporal distribution of rainfall in the study area was the rainy season, which begins in July and ends in September, accounting for 60-70% of the average annual rainfall. The dry season, which extends from December to March, is locally referred to as ‘Bega’. The third season, locally referred to as 'Belg’, is a 'small rainy season that accounts for 12-20% of the annual rainfall and lasts from March to May. In generally, October to February is considered a rainfall deficit season for crop production. The highest rainfall was recorded in August with a monthly average of 192.588 mm, while the lowest rainfall was recorded in December with a monthly average of 8.874 mm. 66.04% of the total mean annual runoff falls during the months of July to September. Therefore, the dry season known as the most water-scarce season for crop production in the region. The soil types in the watershed are varied. The Eutric Regosols, Lithic leptosols, Humic Nitosol, Eutric Vertisol, Chromic Luvisol, Haplic Luvisols, Vertic Cambisols and Eutric Cambisol are occur in the study area.
2.2. Research methodology
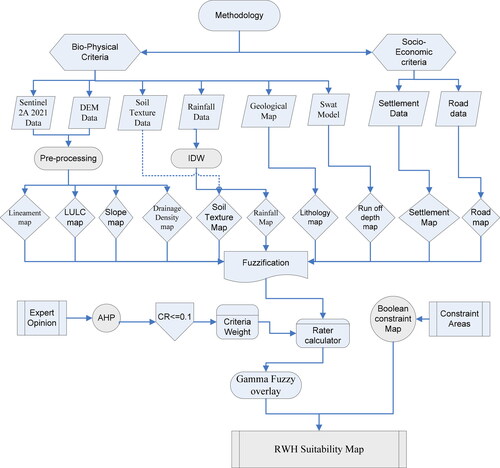
The overall methodology that used to select the best site for RWH zones in the Keleta river watershed for irrigation Practices as shown . The water harvesting site was selected using the integration of GIS/RS, AHP, fuzzy logic, and SWAT model. Analytic hierarchy process is used to estimate a relative weight of influence for each criterion based on expert opinion, rather than assuming or using the same weight for all criteria (Al-Abadi et al. Citation2017). To standardize the components and overlay weight on the thematic map, a fuzzy logic-based method was employed (Mosase et al. Citation2017). For a better comprehension of the water regime, SWAT was also utilized to simulate runoff in the entire study watershed. Additionally, GIS/RS creates a number of thematic maps using the GIS/inherent RS's features (Victor Citation2016). Together with the insights of regional experts and academics, these investigations served as the basis for the definition of the water harvesting site selection criteria. Based on, eight physical criteria were used in this research, which include the rainfall (mm), the runoff (mm), the drainage density (Km/km2), the slope (%), the lineament density (Km/Km2), the lithology (%) and the soil clay contents (%) (Khudhair et al. Citation2020). In addition, two socio-economic factors are including the proximity distances to the urban areas and the proximity distances to roads (Harka et al. Citation2020).
Figure 2. Methodological flow chart.
To adjust the Weather data for further analyses, the missed data was filled by the linear regression (). After the missed data are filled and the short records are extended, the point rainfall of five station is then converted to spatial rainfall by using Thiessen’s polygon method. The consistency and homogeneity of rainfall were checked by the double mass curve technique (Subramanya Citation2016) and by the non-dimensional homogeneity test (Kang and Fadhilah Citation2012) respectively.
Table 1. Summary of the rainfall stations.
2.2.1. Data collection
To realize the above-specified objectives, data was collected and organized from both primary and secondary data sources. The primary data includes questioner data for computing weights of each parameter, GPS data used to indicate the location of proposed site, and for verification of LULC and existing water harvesting structure was gathered from the study area.
The secondary data used for this study were those published and unpublished documents from various organizations and institutions. The ministry of water and energy (MWE) and the national meteorological agency of Ethiopia (NMA) were the main source of hydrological data and metrological data respectively. The sentinel 2 A images were used to produce LULC maps and extraction of the lineament density of the study area without the presence of a cloud (cloud-free image) having a resolution of 10 × 10 m. In addition to this satellite, DEM data with a spatial resolution of 12.5 × 12.5 m was used for watershed delineation, drainage density, and slope generation. Geological map downloaded from https://www.Orr and associates. SWAT model requires spatial data like DEM, LULC map, soil map, and temporary data i.e. weather data for computing runoff at the HRU level (). The SWAT model software package was downloaded from http://www.brc.tamus.edu/swat/. Finally, the soil’s physical characteristic was extracted from HWSD Viewer.
Table 2. Data sources.
2.2.2. Data analysis and standardization
In the data analysis phases, the techniques for identification of appropriate input criteria, data organization, data processing, and editing, data analysis attribute table design and editing, data cleaning, field verification, digitization, data integration, data validation, data transforming, modeling and algorithms to discover useful information, suggesting conclusions, and supporting decision-making were carried out. While data standardization criteria such as constraints dataset and thematic layers were converted into a raster data format and the converted layers were reclassified based on an elaborate literature search endogenous and expert knowledge have been conducted. The appropriate criteria used for this research were LU/LC, slope, soil, rainfall, runoff depth, drainage density, lithology, and lineament density. In addition to these eight physical criteria; two socio-economic factor layers were used in the research to select the optimum sites for RWH in the study area. These socio-economic factors were; urban areas (settlement) and major road.
2.2.3. SWAT model setup
The model set-up concerned six steps: data preparation, watershed delineation, HRU definition, weather data analysis, (sensitivity analysis, calibration, and validation), and re-run swat model. In this study, the Arc SWAT 2012 interface was used to set up the model. With a threshold drainage area of 811.39 km2, the watershed has 31 sub-basins.
Arnold et al., suggest that a 20% land use threshold, 10% soil threshold, and 20% slope threshold are adequate for most modeling applications. However, Asmamaw (Citation2013), suggested that HRU definition with multiple options that account for 10% land use, 20% soil, and 10% slope threshold combination gives a better estimation of runoff. Hence, for this study, HRU definition with multiple options that accounts for 10% land use, 20% soil, and 10% slope threshold combination was used. These threshold values indicate that land uses that form at least 10% of the sub watershed area and soils which form at least 20% of the area within each of the selected land uses was considered in HRU. Therefore, the sub-basins were further subdivided into 458 HRUs. After computing HRU, the next tax required the inputs of weather data and finally, run the model in a monthly time step for a total simulation period of 30 years from 1988 to 2017 out of these three years from 1988 to 1990 were handled as the warm-up period to fill up the initial conditions and reach stable values.
The Keleta river gauged flow data for the period 1988–2016 was collected from MWE and used for SWAT model calibration and Validation. The SUFI-2 (Abbaspour et al. Citation2004), Parasol (Van et al. Citation2006), and GLUE (Beven and Binley Citation2014) algorithms are used to analyze calibration and validation. For this study, SUFI-2 algorithms using Latin hypercube sampling simulations in SWAT CUP were used. To realize the performance of the SWAT model in the watershed, 19 parameters were selected for the flow sensitivity analysis. Nash–Sutcliffe efficiency (NSE) and coefficient of determination (R2) were selected as objective function and evaluate the quality of the model respectively (Sutcliffe and Nash Citation1970; Almeida et al. Citation2018).
2.2.4. Assigning AHP weights and modeling fuzzy logic
2.2.4.1 Analytic hierarchy process (AHP)
Analytic hierarchy process was developed by Thomas Saaty in the 1970s, which is a multi-criteria decision-making method, providing a structured technique for organizing and analyzing complex decisions based on mathematics and expert knowledge. It offers an adaptable, low-cost, and understandable output for complex decision making (Al-Abadi et al. Citation2017). According to Al-Shabeeb et al. (Citation2016), the assessment of the consistency through pairwise comparisons to assign the Consistency Ratio (CR). This stage involves the following operations:
Step 1: Establishing decision hierarchy
Establishing decision hierarchy was a critical step in solving complex problems. Once a hierarchy is developed, a prioritization technique was used to determine the relative importance of elements, all compared as pairs concerning their importance in making the decision, at every level of the hierarchy. Decomposed analytical hierarchy structure of RWH sites. The importance of decomposition a structure hierarchically is that structuring the problem in this way is better to understand the decision to be achieved, the criteria to be used and the alternative to be evaluated ().
Figure 3. Established decision hierarchy for RWH site selection.

Step 2: Selection of the local experts
After preparing the thematic map of each parameter for selecting sites for RWH, interview was undertaken with local experts. The interviews were carried out in February 2022. The experts were used to identify the relative importance of all the selected criteria. This questionnaire was based on a scale of 1 - 9 for the experts to evaluate the relative importance of each criterion.
The interview was conducted with thirteen (13) experts from Arsi university department of soil and watershed management, Lude Hetosa woreda water and energy biro, micro constructer that has experience in water work construction found in the study watershed, Lude Hetosa Woreda agricultural bureau, and Haramaya University School of Water Resource and Environmental Engineering that are relevant to the issues of the water harvesting. The background of experts covered the fields of irrigation engineering specialist (4 experts), small-scale irrigation development (3 experts), hydrology (2 experts), remote sensing and geo-informatics (1 expert), geology (1 expert), and agronomy (2 experts).
The experts were selected based on their knowledge of the study area and the water issue in Ethiopia in general and the study area in particular. Some of the selected experts had previously published their research on the related topic. Interviews were conducted face to face. Based on the literature review, the criteria were selected and subjected to a review by the local experts to decide the relative importance of each criterion.
Step 3: Computing the consistency index (CI);
(1)
Step 4: Calculating CR.
Table 3. Random index for consistency/inconsistency check (RI).
Step 5: Determining relative weight
The AHP approach is used to assess the consistency of the expert opinions by using the CR, which should be less than or equal to 10% (Al-Shabeeb et al. Citation2016). Of 13 experts only 10 of them are a CR of less than 10%. Hence, only the ten expert opinions were used as aggregation for computing weights of each parameter ().
Table 4. Aggregate (ten experts) the comparison matrices using geometric means and weight.
2.2.4.2 Modeling fuzzy logic
Fuzzy logic was used to standardize and aggregate the parameters that used for identifying a suitable site for RWH. All the criteria in different units so to perform weighted overlay they need to be in the same units and hence needed to be standardized (Hassan et al. Citation2020).
Fuzzy membership values range between 0 and 1. The fuzzy membership values must indicates the relative importance of each map, besides the relative importance of each class of individual map (Sadeghi et al. Citation2019).
The fuzzy logic tool allows the reclassification of a variable using fuzzy membership rather than discrete rankings. In the study area, the ‘small’ and ‘large’ fuzzification algorithm was used; the small fuzzy algorithm was used to indicate that small values of the input raster have high membership in the fuzzy set, while the large fuzzy algorithm was used to indicate that large values of the input raster have high membership in the fuzzy set. The large fuzzification algorithm is written mathematically (Yazdi et al. Citation2015).
(3)
(3)
Whereas, the small fuzzification algorithm is written as
(4)
(4)
where
is large and small fuzzification algorithms; f1 is the spread of the transition from a membership value of 0 to 1 and
is the midpoint.
2.2.5. Generation of RWH potential map
The Fuzzy Overlay weighted method was used for fuzzy aggregation, for MCA. This fuzzy overlay was employed to calculate the sum of the weighted criteria. Sadeghi et al. (Citation2019) concluded that, the best operator was gamma fuzzy overlay techniques, with a power of 0.9. The suitability map for RWH was generated by integrating the result of fuzzified raster maps of the layers, each thematic map weighted using the AHP model and calculated by map algebra raster calculator were combined through gamma fuzzy overlay techniques to yield the RWH suitability map. Weighting was given by multiplying the weight of the criteria layers by its standardized membership value as shown in EquationEquations 5(5)
(5) .
(5)
(5)
Where is the suitable site,
is a parameter between 0 and 1 (Zimmermann and Zysno Citation1980). When
is 1, the combination is the same as the fuzzy algebraic Sum and when
is 0, the combination equals the fuzzy algebraic Product. This operator was applied with 0.9 powers.
2.2.6. Constraints
To ensure constraint, the suitability rating for each assessment criteria was falling within one of the following; either very high, high, moderate, low or very low. A poor rating represents a development constraint that prevents a site from being suitable for RWH. However, in the study major roads, settlements, and lineaments were considered as some constraints. The major roads and settlements places are desirable for socio-economic benefits and lineament have very low water hold capacity rather than to RWH sites. After the constraints were considered in the suitability analysis; the final potential RWH suitability map was generated using the equation
(6)
(6)
where
is the criteria score of the constraint i,
is the product.
2.3. Criteria for proposing sites for Rainwater harvesting structure
In this research, a micro dam, and a Farm pond were chosen. Possible potential RWH Structure site locations and structure types were chosen based on reviewed literature criteria ().
Table 5. The most common techniques and criteria that have been used for the RWH site.
3. Results and discussion
3.1. Calibration and validation of SWAT model
The Keleta river watershed streamflow gauged near Sire town was used to calibrate the SWAT model for a period of 28 years (January 1, 1988, to December 31, 2016) using SWAT-CUP. Sensitivity analysis is the initial process to build calibrate the model (Almeida et al. Citation2018). The level of significance between the parameters is determined based on the t-test and P-value, which shows the significance of surface runoff for the watershed (Adeogun et al. Citation2014). As shown in , the most sensitive parameters in the calibration step are presented at the top of the rankings. Lower absolute values of the t-test are less sensitive than larger values, while the P-values less than 0.05 are less important than values closer to one (Adriel et al. Citation2021).
Table 6. Ranking of the calibrated parameters, according to their sensitivity and significance rank.
The objective of calibration and validation was to optimize the model efficiencies and finally use the parameter values obtained through those calibration techniques (Mamo et al. Citation2013). Model calibration was undertaken manually by adjusting sensitive parameters using 10 years of observed data from 1996 to 2005, and validation was done with 7 years of observed data from 2006 to 2012. The five most sensitive parameters related to runoff are ranked chronologically. The most sensitive parameter in the Keleta watershed is CNII and SOL-AWC which was confirmed by (Tibebe and Bewket Citation2011). On the other hand, the three parameters affect the base flow generation and, are used in SWAT to calibrate base flow which was supported by (Abbaspour et al. Citation2004).
According to the results of the monthly calibration, the NSE was 0.77 and the R2 was 0.7913. For monthly validation, the R2 was 0.81 and the NSE was 0.75. They showed that the model’s performance in exhibits good agreement between measured and predicted outcomes, and that it performs best within the acceptable range both during calibration and validation. Additionally, it is demonstrated that during the simulation period, the distribution of observed and simulated runoff was constant.
Figure 4. Figure Scatter plot of monthly observed versus simulated flow for calibration (a), validation (b).
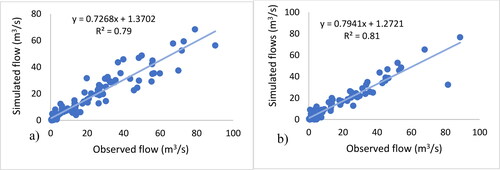
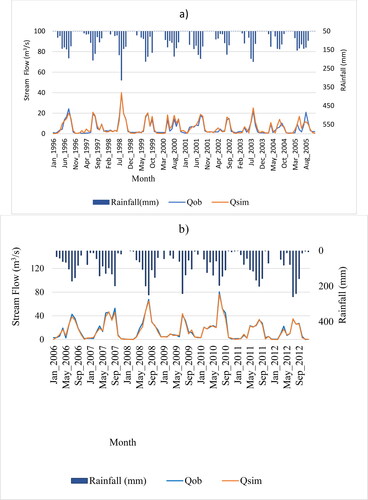
Thee monthly surface runoff was observed and simulated as shown in . The difference between the mean values of observed and simulated runoff was statistically non-significant at a 99% level of confidence; the calculated t-value of 1.651 is less than the critical t-value of 1.98. Overall, the model over-predicted runoff by 5.384% by the percent deviation value.
Figure 5. Observed and simulated monthly stream flow for Keleta river for calibration (a), validation (b).
3.2. Fuzzy membership result
The result of a standardized and fuzzified suitability map of each criteria layer of the slope, percentage of clay content, LU/LC, rainfall, runoff depth, drainage density, lithology, lineament proximity, settlement proximity, and major road proximity was presented according to the standardized attribute values based on potential RWH suitability sites selection ().
Table 7. Fuzzy standardized attribute values based on suitability for the RWH.
3.2.1. Percentage of clay content reclassify
The soil map of the study area was obtained from the MOA and Kulumsa Agricultural research center. The hydrological soil group (HSG) is highly useful in estimating the runoff in a watershed. The soils of group A indicate low runoff potential, and high infiltration but group D pointed to slow infiltration and high runoff potential (Harka et al. Citation2020).The standardized percentage of soil clay content was fuzzified using a large fuzzification algorithm method. The RWH sites are suitable for areas with moderate to milder slopes joint with soil textures that have a high water-holding, i.e. clay soil ().
Figure 6. Fuzzified percentage of clay content suitability map.
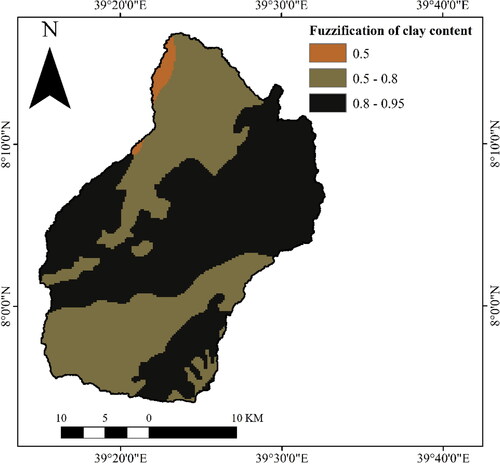
The soil texture which has greater than 40% of clay content (449.02 km2) was very high suitable for RWH sites because, it has good water hold capacity and low permeability. Additionally, loam, clay loam, and sandy clay loam soil textures have an area coverage of 351.34 km2 (43.3%) from the entire study area which is highly suitable for RWH.
The remaining 11.03 km2 (1.36%) was moderately suitable for RWH. Therefore, the RWH sites are suitable for areas with milder to moderate slopes joint with soil textures that have a high water-holding, i.e. clay soil. As Harka et al. (Citation2020) indicate, soil texture influences overland flow by affecting the rate of infiltration. The soil clay content result revealed that the central and west parts of the study area are under a highly suitable class for RWH, except in the mountainous area (upper part of the watershed), and northern part of the study area.
3.2.2. Slope reclassify
The slope was derived from 12.5 m resolution DEM. The ground slope is a key factor in water harvesting. Since, the time of concentration and its speed of flow, Sedimentation, and recharge is influenced by the slope (Adham et al. Citation2016). The slope of the study area has been classified based on the FAO manual (Critchley et al. Citation1991) into two classes, the nearly flat and milder slope (0–5%) which is very suitable for the RWH selection site, and steep slope (>5%). The small fuzzification algorithm is used on the reclassified slope ().
Figure 7. Fuzzified slope suitability map.
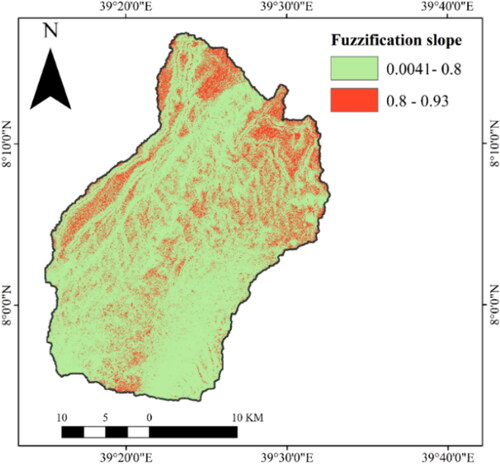
Generally, considered not suitable for RWH which is 668.83 km2 (82.43%) because it needs large earthwork prerequisites and these areas are liable to extraordinary erosion amounts as a result of uneven rainfall distribution.
Most parts of the study area are under not suitable class for RWH, i.e. central part of the study areas and southern (upper part of the study) are covered by Chelalo Mountain with higher altitude mountains that generate high steeply land surface. Some Eastern parts and the lower part of the study area (Northern part) are suitable for RWH having an area of 142.56 km2 (17.57%).
3.2.3. LULC reclassify
The sentinel 2 A imagery was used to prepare a land cover map. Data acquisition and image processing used for this study were acquired on December 6, 2021, and were downloaded using the platform earth explorer (http://earthexplorer.usgs.gov/).
The image pre-processing was made using ArcGIS 10.4 and ERDAS imagine 2015 software. three bands (B3, B4, and B8) of the image were combined to create a mosaic raster of the study area.
Ground control points were collected by a global positioning system (GPS) then import to Google Earth, a paper review such as, ESRI 2020 land cover map having 10 by 10-meter resolution were used for classification of LULC. The Supervised maximum likelihood classification was used to produce the land cover map of the study area based on the pixel-based. These classifications were waterbody, shrubland, settlement, grassland, forest, mixed forest, degraded, and agriculture. The LULC of a watershed influence runoff and is a key parameter for the selection of appropriate water harvesting sites (Negash et al. Citation2020). The standardized LULC was fuzzified using a large fuzzification algorithm method ().
Figure 8. Fuzzified LULC suitability map.
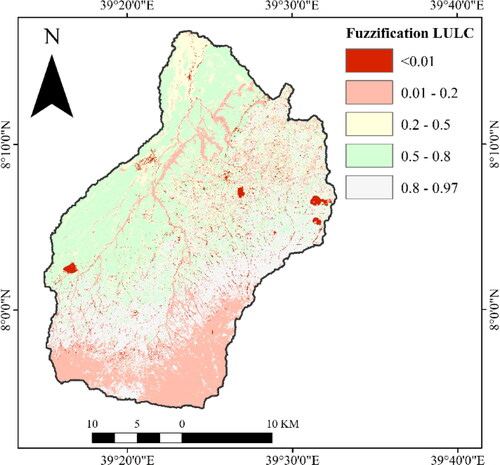
The grassland is very highly suitable for the RWH selection site having an area of 234.41 km2 (28.89%), followed by cultivated land of 234.41 km2 (31.91%), shrub land of 128.2 km2 (15.8%) which were highly and moderately suitable respectively.
The degraded land and mixed forest of 72.02 km2 (21.2%) were classified as low class. While, water bodies, forests, and settlements covering an area of 7.82 km2 (2.2%) were classified as very low suitable for RWH.
The fuzzification results of the LULC map tell that most central parts, Western, Eastern, and Northern parts of the study area were covered by very high and highly suitable for RWH. However, some parts of the Southern direction covered by non-suitable for RWH.
The LULC of a watershed influences runoff, and the selection of appropriate RWH sites. For instance, surfaces with denser land cover are associated with higher rates of interception and infiltration and thus have a lower runoff.
3.2.4. Rainfall reclassify
Precipitation is the source of all renewable fresh water on earth. It is the major component in any RWH system, with the magnitude of rainfall playing a significant role in assessing the RWH suitability for a given area (Haile and Suryabhagavan Citation2019).
Rainfall in the study area varies greatly in temporary and spatially. RWH systems are valid if there is excess rainfall in the catchment to be stored as surplus water. The IDW was applied to interpolate the data from these stations. The closer a point is to the center of the cell that is being estimated, the more weight it is given. The Standardized pixel value of the rainfall map was fuzzified using the large fuzzification algorithm method ().
Figure 9. Fuzzified rainfall suitability map.
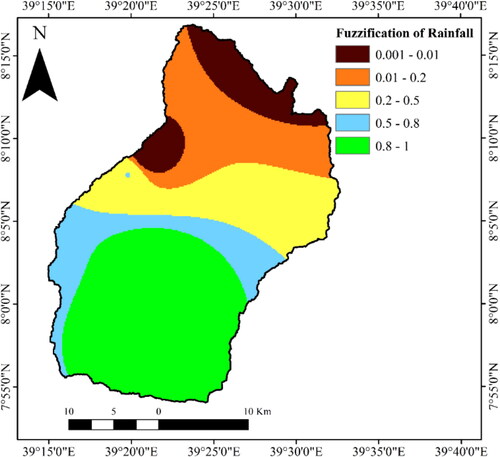
About of 111.31 km2 the study area has moderate suitable, and 112.45 km2 is highly suitable rainfall potential. But, low (171.19 km2), and very low (120.97 km2) rainfall potential zones. The fuzzification results of reclassified rainfall were very high (295.43 km2) in the Southern parts of the study area. However, the rainfall distribution gradually decreases in the Northern part, which indicates that as the elevation increases, the rainfall amount also increases in the southern part of the study area.
3.2.5. Runoff reclassify
Surface runoff is the fundamental parameter for identifying RWH sites. The standardized runoff was fuzzified using a large fuzzification algorithm method.
The amount of runoff generated was highly correlated with the distribution of rainfall in a given area. The surface with dense land cover has high rates of interception and infiltration. On the other hand, degraded land and compacted land have a high rate of surface runoff ().
Figure 10. Fuzzified runoff suitability map.
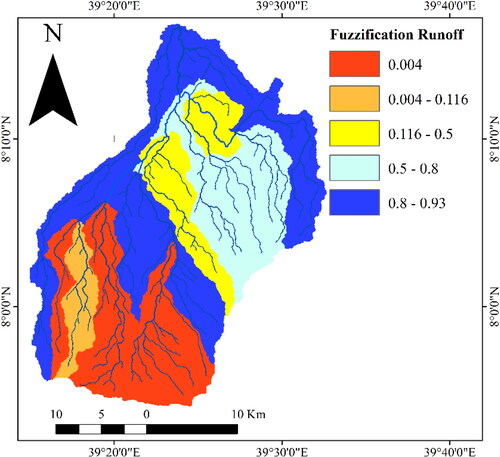
About 27.8% of the study area has moderate, and 21.3% is highly suitable runoff potential, low (19.3%), very high (18.7%), and very low (12.9%) runoff potential zones. A large portion of the study area falls underclass of moderate and high runoff potential zone about 49.1% coverage of all study areas. Especially, the Central, and Southern sides of the study area have less runoff distribution. On other hand, as shown in a very high run-off potential is found in the lower (northern and northeast), western, and eastern parts of the study area.
Figure 11. Fuzzified lineament density suitability map.
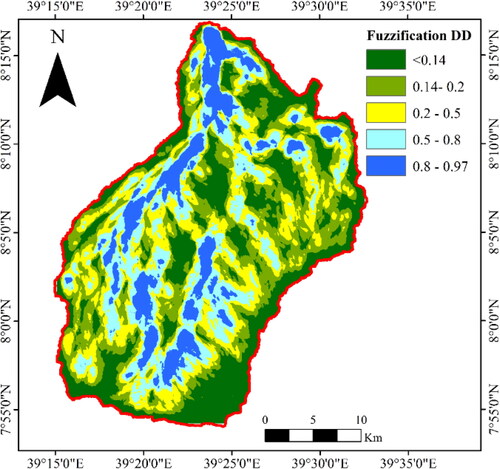
3.2.6. Drainage density reclassify
Drainage is an area, network, or path upon which waterfalls on the surface travel to an outlet, it is one of the important factors for RWH site selection. It was defined by (Horton Citation1945) as the ratio of the total length of streams in a watershed over its contributing area. Drainage configuration reflects the surface features and subsurface hydrological formation. It is showing the nature of surface material and the closeness of channel spacing (Tumbo et al. Citation2014). DEM was used to extract a drainage density map of the study area. The standardized pixel value of the drainage density map was fuzzified using the large fuzzification algorithm method ().
Figure 12. Fuzzified drainage density suitability map.
The drainage density varies between 0.0 − 4.5 km/km2, and the drainage densities of moderate and low categories are dominant in the study area encompassing an area of 31.55% and 25.4%, respectively. The drainage density suitability coverage area was very high (8.76%), high (22.64%), and very low (11.65%). The RWH located far from the river has a high water loss due to evaporation and seepage which supported by (Tumbo et al. Citation2014). The higher drainage density indicates a well-developed channel, where surface runoff moves rapidly from overland flow to the channel because it has a low infiltration rate. RWH sites far from the river have a high chance of water loss due to evaporation and seepage. Therefore, higher drainage density means higher runoff and vice versa.
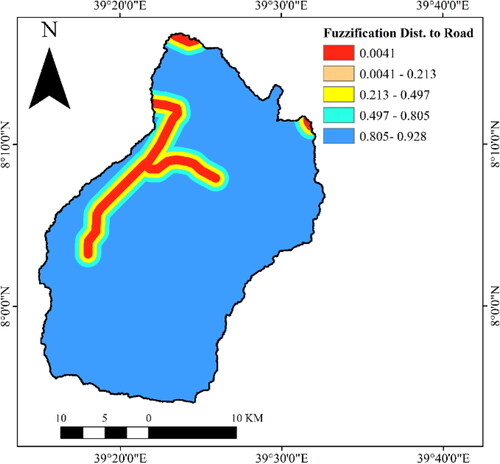
3.2.7. Road proximity reclassify
Besides biophysical factors, socio-economy are other key parameters used to identify RWH sites. The objective of RWH projects is to assist resource-poor farmers to improve their production systems, it is important that the farmer’s priorities are being fulfilled, at least in part. Otherwise, success is unlikely (Critchley et al. Citation1991). These can be influenced by the parameters like distance to settlement and distance to the road.
The success of an intervention depends not only on physical aspects but also on how well it fits within the stakeholder’s social context and the economic benefit it provides him/her (Adham et al. Citation2016). The road is the transportation network and the distance to the road is the socio-economic criteria influencing how suitable the intervention is for the main stakeholders. For cost consideration, the site is not very far remote from existing roads. In the study area, the population settled near the road. The standardized road proximity was fuzzified using a large fuzzification algorithm method ().
Figure 13. Fuzzified distance to road proximity suitability map.
The result of the fuzzified major road proximity map reveals that a huge portion of the study area is very suitable (82.3%), scoring a fuzzification value of greater than 0.805. Therefore, selecting an RWH site away far from the road is more suitable than nearest to the road. Because it is suitable for economic activity rather than water harvesting. As a result, the integration of biophysical with socio-economy criteria is the most significant for enhancing the optimality of RWH schemes and developing future water storage sites for irrigation practice.
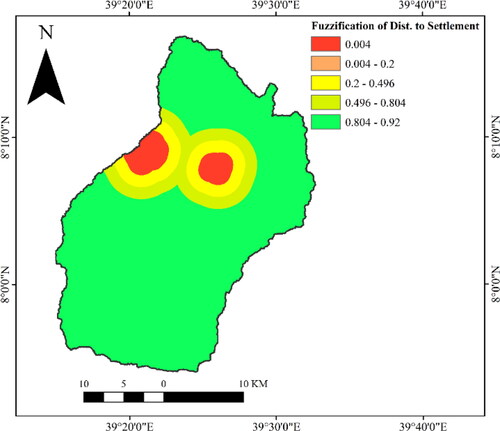
3.2.8. Settlement proximity reclassify
The urban area is a human settlement with high population density and infrastructure of a built-up environment and urban are the main creators of economic wealth in the study area. Hence, within a 1.5 km radius, the area is not suitable for RWH. The far from the urban, the better suitable for RWH. The Standardized pixel value of the settlement proximity map was fuzzified using the large fuzzification algorithm method.
The result of settlement proximity tells that, due to considerable economic and health risk problems with related to RWH implementation most of the locations which are far from urban were considered very suitable while the near place and around the urban were considered as low suitable for RWH ().
Figure 14. Fuzzified distance to settlement proximity suitability map.
A large portion of the study area falls underclass of suitable (Very high, high, and moderate suitable) for RWH about 727.78 km2 (89.72%) coverage in the study areas (). However, some central and western parts of the study area have less suitable 63.59 km2 (10.1%). Therefore, selecting a site away from the urban area is preferable to overcome the economic crisis of the urban during the implementation of RWH Structure which is supported by Demisachew et al.
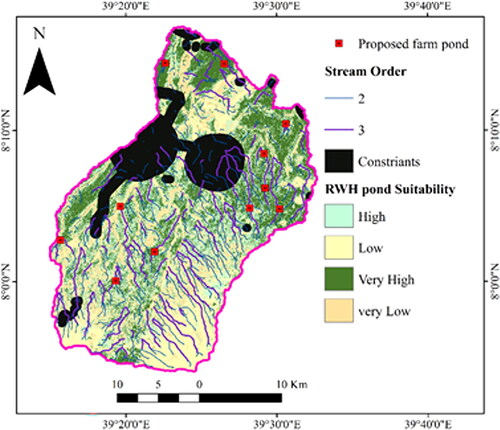
Figure 15. Proposed sites for farm pond suitability map.
3.2.9. Lithological reclassify
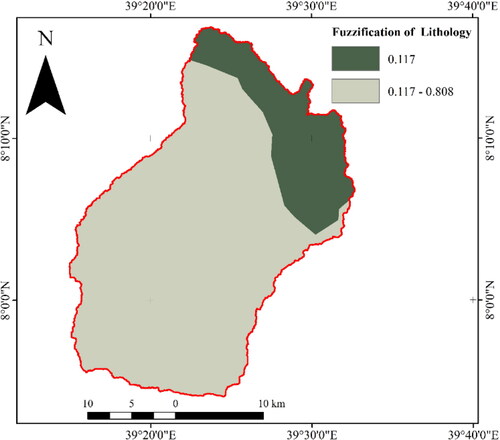
The dominant lithology found in the study area is tertiary extrusive and intrusive rocks (Ti) and quaternary extrusive and intrusive rocks (Qv). Therefore, the above-mentioned lithological units in the study area were reclassified based on their permeability, fracture, and nature of lithological structure. Lithology is the main influence of infiltration.
Therefore, impermeable bedrock characteristics are more suitable for RWH sites (Haile and Suryabhagavan Citation2019). A large fuzzification algorithm process was applied to reclassified lithology of the study area which is covered by quaternary extrusive and intrusive rocks. Quaternary extrusive was very suitable 667.55 km2 (82.3%) whereas tertiary extrusive parts of Northern and Northeastern parts were highly suitable 38.82 km2 (4.78%) for RWH ().
Figure 16. Fuzzified Lithological suitability map.
3.2.10. Lineament density reclassify
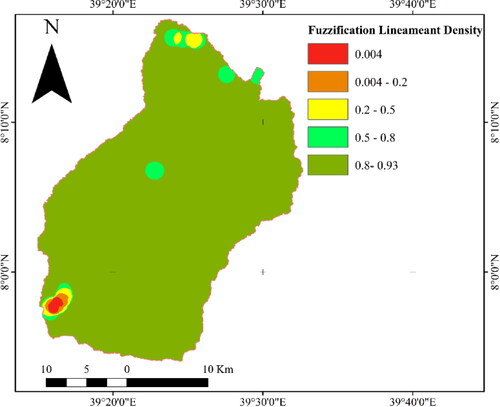
Lineaments were extracted from Sentinel 2 A, a combination of Band B2 (blue), B11 (SWIR-1), and B12 (SWIR-2) images, and analyzed using Geomatica 2015 software. Afterthought, lineaments were manually digitized. The extracted lineament was buffered since it represents the spatial influence that would lead to leakage or seepage for the surface water storage (Maina and Raude Citation2016). A small fuzzification algorithm was used on reclassified lineament density. The higher lineament density was more suitable for groundwater recharge, rather than surface water harvesting. Because it would encourage leakage or infiltration. For surface runoff harvesting a land unit located in no lineaments or less lineament density area is very suitable but, a higher land unit present in higher lineament density is rated lower.
The Northern parts of the study area have dens lineaments that are not advisable for water harvesting. However, most parts of the area other than dens lineaments location are very suitable for RWH structure.
3.3. Computed layers weights
All criteria layers identified for the analysis were not equally influential and important to select potential RWH sites of the study area. Final weights and consistency ratio were given for each criterion (). By assigning quantitative weights it is possible to make important criteria have a greater impact on the outcome than other criteria (Wu et al. Citation2018). The goal of the AHP is to distinguish the relative importance of multiple paired criteria to accomplish an expressed objective (Al-Abadi et al. Citation2017). In this research, the opinions of interviewed experts were used to determine the weights of each site selection criterion for water harvesting, and the AHP approach was used to assess the consistency of the expert opinions by using CR, which should be less than or equal to 0.1.
Table 8. Final weights of main criteria, criteria, and sub-criteria with consistency ratio.
The final calculated criteria layers weight shows that; rainfall is the dominant factor which incorporates 21% followed by the slope (14%), runoff, clay content, LULC has equal influences (12%), drainage density (10%), distance to settlement (9%), distance to the road (4%), lineament proximity (3%) and lithology (3%), respectively.
3.4. Generation of constraint layer maps and RWH suitability map
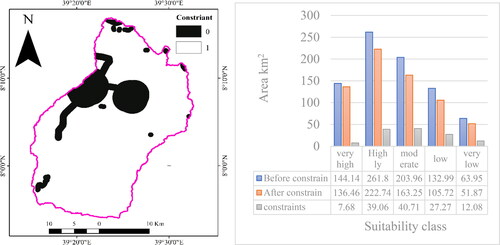
A major road, lineament, and urban area found in the watershed were considered as constraints () and converted into binary maps. The value one was assigned as a suitable area while a value of zero was assigned as a restricted (Unsuitable) area for RWH potential zones ( left). Mosase et al. (Citation2017), revealed that the restricted area means never used for RWH structures since those areas are more worthful for economic and other activities than harvesting water. However, from those criteria lineaments cannot be used for economic activities but rather disuse for WH structures, because since a lineament is a fracture area, can facilitate the infiltration rate of harvested water and rather used for groundwater recharge, since, this study aimed to catch surface water for irrigation practice in Keleta watershed; lineament is considered as a constraint.
Figure 17. Constrain map (left) and RWH suitability class of the study area (right).
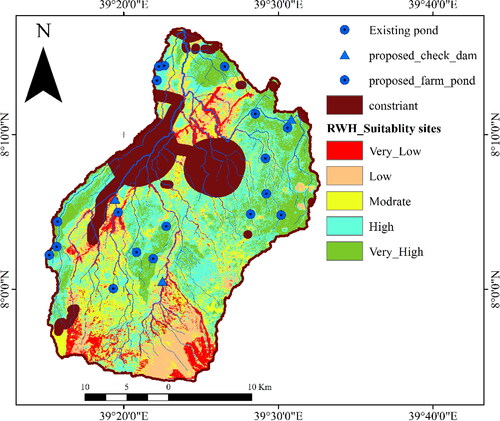
Table 9. Constraint and restricted area factors.
The constraint and RWH suitability were aggregated ( right). The result of this study reveals that from the total study area of 811.39 km2 only 126.95 km2 (15.73%) was kept as a constraint. Out of this major roads, lineament and settlements cover 45 km2 (5.55%), 15.07 km2 (1.86%) and 66.91 km2 (8.3%), respectively.
Five comparable classes are used as indicators for suitable areas for water harvesting suitability: very high suitable, high suitable, moderately suitable, low suitable, and very low suitable as shown in . The final stage is to overlay each criteria layer by applying the gamma fuzzy overlay techniques. Out of the entire study area (811.39 km2), about 404.07 km2 (50.3%) of the study area was potentially suitable for RWH. Due to the presence of less than 5% slope, far from road and settlement, clay, clay loam, loam, and sandy clay loam soil texture, currently cultivated and grass, higher drainage density, higher rainfall and runoff, lower lineament and good lithology present in the study area.
Figure 18. Final RWH suitability map.
Before constraint, the potential suitable for RWH, 144.14 km2 (17.9%) was very high suitable, and 261.8 km2 (32.4%) was highly suitable. On the other hand, 203.96 km2 (25.3%) of the watershed was accounted as moderate suitability, 132.99 km2 (16.5%) is concerned as low and 63.95 km2 (7.92%) of the study area was roofed by a not suitable area for RWH.
Therefore, after constrain are computed the RWH suitability class is as follows 136.46 km2 (16.91%) was very high suitable, 222.74 km2 (27.6%) was highly suitable, on the other hand, 163.25 km2 (20.23%) of the watershed is accounted for moderate suitability, 105.72 km2 (13.1%) is concerned as low and 51.87 km2 (6.43%) of the study area not suitable area for RWH. Haile and Suryabhagavan (Citation2019) supports the kebele such as lude Hetosa found in the study area have potential rainwater harvesting sites were classified under very high and high suitability classes. Very high suitable zones are located in the Northeastern part of the area, as well as a Western part, whereas the unsuitable and low suitable zones for RWH were found in the elevated region in the Southern and central part of the study area.
3.5. Suitability sites for RWH structure techniques
3.5.1. Suitability sites for farm ponds
In the watershed most of the area has stable and suitable soil types for pond construction, 55.34% of the study area was covered by clay soils, and 17.57% of the area was covered with a slope less than 5% and have a drainage 2nd and 3rd order above the ponds are large enough to fill the ponds in 4 or 5 spells of good rainfall, with >200mm annual rainfalls are proposed for harvesting water in the catchment.
Based on the criteria mentioned in and ground truth 11 farm pond sites were proposed. Out of the total (811.39 km2) study area 246.84 km2 (33.91%) of land is very high suitable for farm ponds which are mainly distributed in the Eastern parts of the watershed, where most of the area is dominance by grass and cultivated lands. Out of the total proposed farm pond structure site, seven (63%) were found in very high suitability classes. But, three (28%) proposed farm pond structure was found in a high suitable class and the rest (9%) proposed farm pond structure was found in the low suitable class as shown in . Therefore, around 92% of the proposed farm pond sites are found in very high and high suitable class. These results are consistent with those of Demisachew et al., who showed that farm ponds are suitable for areas with less than 8% slope and clay soils that have a high water retention capacity. The proposed farm ponds have significant to irrigation practices.
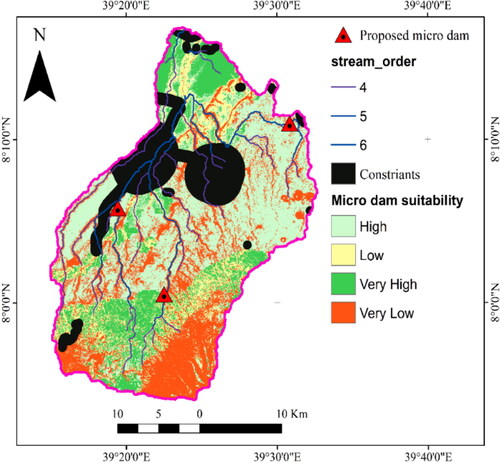
3.5.2. Suitable sites for micro dams
A suitability site selection for micro earthen dam construction has the soil type of the area were covered by sandy clay loam, stream 4th, 5th and 6th order having a gentle slope <15%, the availability of rainfall in the area has been approximately less than 1000 mm, and the land cover of the area was grassland, cultivated land, and shrubland.
As per experience, ground truth, and the criteria mentioned in table 20, three suitable sites were proposed to construct micro dams, these proposed micro dams can be very useful as supplementing irrigation during the dry season.
After constraints, 133.62 km2 (18.43%) area of land is very highly suitable for the construction of a micro dam. The remaining 292.22 km2 (40.32%), 91.54 km2 (12.63%), and 207.37 km2 (28.62%) were highly suitable, low suitable, and very low suitable classes for micro dam structures respectively as shown in . Therefore, most of the proposed site in the study area were found (two third) under very high suitability. However, one third was found in high suitable class for a micro dam.
Figure 19. Proposed sites for micro dam suitability map.
3.6. Validation of potential RWH
To check the applicability of the choice methodology in the study area for constructing different types of RWH need to be validated with existing RWH technologies for their suitability for RWH sites. The ground truth relating to the location of existing RWH structures (latitudes and longitudes) was collected during the survey and seven sites were taken from different kebele in the watershed and exported to ArcGIS 10.4 for further validation.
The result in indicates that 57.14% of existing RWH sites were found in very high suitability and 28.6% located in highly suitable whereas only 14.3% were in moderately suitable areas. Therefore, accuracy assessment taken into consideration by overlaying the locations of existing RWH ponds and the potential RWH zones which were developed by the model were agreed with the experiences and local knowledge of the farmers. The capacity of existing ponds that fall under moderately suitability has low water holding capacity in a given area and due to this most of the ponds were vulnerable to runoff damage, sediment deposition and high Evaporation. As shown in , the existed ponds fall under very high suitable and high suitable lands, which confirms the present RWH suitability is accurate (Mosase et al. Citation2017).
Figure 20. Proposed sites for existing farm ponds.
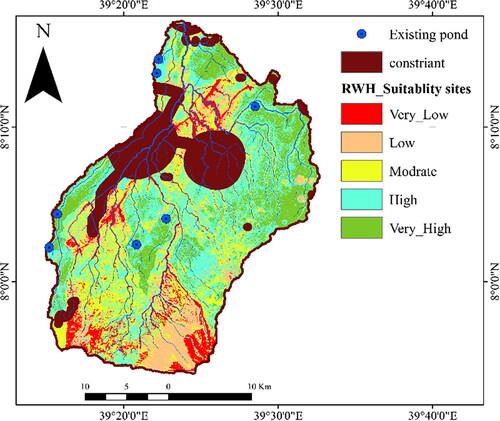
A comparison of the proposed RWH suitability map with the location of the existing pond shows that the pond is located in the area delineated by the study, indicating that the method used is highly suitable for identifying sites suitable for RWH.
4. Conclusions
The critical step of RWH is to identify the location of the optimum amount of water harvested. Runoff depth was computed using the SWAT model and the SUFI-2 method was used for calibration of the SWAT model in the Keleta inflow river. Based on monthly calibration, the NSE was 0.77, and the R2 was 0.79. In the monthly validation, the R2 was 0.81 and NSE was 0.75. Therefore, based on the value of model performance the SWAT model can use to determine runoff in the Keleta watershed.
Assigning the weights is based on professional judgments rather than random intervals for MCE. To compute the influential weight of datasets using a pair-wise comparison matrix (AHP), to avoid confusion, and individual biases and to produce better results. Fuzzy membership was used to standardize and fuzzy gamma is used to combine (weighted overlay) the criteria layers for identifying a suitable site for RWH.
The result of this study reveals that from the total study area of 811.39 km2, only 15.73% was kept as a constraint. After constrain computed the RWH suitability reclass as follow 16.91% was very high suitable, 27.6% was highly suitable, on the other hand, 20.23% of the watershed is accounted for moderate suitability, 13.1% is concerned as low and 6.43% of the study area is roofed by a not suitable area for RWH. The RWH techniques of this study reveal that 18.43% of the study area is very highly suitable for micro dam while 33.91% is very highly suitable for farm ponds respectively.
Existing RWH sites were used to validate the GIS/RS with SWAT model integrated fuzzy modeling and AHP approach for potential RWH structure sites in the study area. Based on the finding, the very high suitability 57.1% and 28.6% were located in highly suitable whereas only 14.3% were located in the moderate suitable area. Therefore, the methodology adopted has a very good capability to identify locations suitable for RWH.
Ethical approval
The research ethics committee at Haramaya University gave its approval to the research. As a result, every procedure carried out over the course of the research that involved human participants complied with the ethical guidelines established by the Haramaya University research system. Since the research is retroactive, formal consent is not required.
Competing interests
The authors declare that they have no conflict of interest
Acknowledgments
Haramaya University and Woldia University are sincerely acknowledged the staff time granted for this research work. Most of the materials and information used were collected from the Ministry of Water and Energy, and National Meteorological Agency. The Ministry and Agency are thanked for allowing the data to be accessed.
Data availability statement
Data can be available from corresponding upon request.
Disclosure statement
No potential conflict of interest was reported by the authors.
References
- Abbaspour KC, Johnson CA, van Genuchten MT. 2004. Estimating uncertain flow and transport parameters using a sequential uncertainty fitting procedure. Soil Sci Soc Am J. 3(4):1340–1352. doi: 10.2136/vzj2004.1340.
- Adeogun AG, Bolaji F, Sule A, Salami W, Michealo D. 2014. Validation of SWAT model for prediction of water yield and water balance : case study of upstream catchment of Jebba Dam in Nigeria. Int J Phys Nucl Sci Eng. 8(2):1–7.
- Adham A, Michel R, Mohamed O, Coen JR. 2016. A methodology to assess and evaluate rainwater. J Water Land Dev. 8(5):198–219. doi: 10.3390/w8050198.
- Adriel J, Carlos M, Anaharat T, Chavez A. 2021. Calibration and uncertainty analysis for modelling runoff in the Tambo River Basin, Peru, using Sequential Uncertainty Fitting Ver-2 (SUFI-2) algorithm. Air Soil Water Res. 14:1345–1352. doi: 10.1177/1178622120988707.
- Al-Abadi AM, Shahid S, Ghalib HB, Handhal AM. 2017. A GIS-based integrated fuzzy logic and analytic hierarchy process model for a GIS-based integrated fuzzy logic and analytic hierarchy process model for assessing water-harvesting zones in Northeastern Maysan Governorate, Iraq. Arab J Sci Eng. 42(6):2487–2499. doi: 10.1007/s13369-017-2487-1.
- Al-Khuzaie MM, Hussein J, Nadhir A. 2020. Assessment model of water harvesting and storage location using GIS and assessment model of water harvesting and storage location using GIS and remote sensing in Al-Qadisiyah, Iraq. Arab J Geosci. 13(21):1154–1164. doi: 10.1007/s12517-020-06154-4.
- Almeida RA, Silvio BP, Daniel BF. 2018. Calibration and validation of the SWAT hydrological model for the Mucuri River Basin. Eng Agríc. 38(1):55–63. doi: 10.1590/1809-4430-eng.agric.v38n1p55-63/2018.
- Al-Shabeeb AR, Al-Adamat R, Mashagbah A. 2016. AHP with GIS for a preliminary site selection of wind turbines in the North West of Jordan. Int J Geosci. 07(10):1208–1221. doi: 10.4236/ijg.2016.710090.
- Asmamaw G. 2013. Assessing the impacts of land use and land cover change on hydrology of watershed : a case study on Gilgel – Abbay Watershed, Lake Tana Basin, Ethiopia [Msc thesis]. Castellón de la Plana: Jaume University.
- Beven K, Binley A. 2014. GLUE : 20 years on. Hydrol Process. 28(24):5897–5918. doi: 10.1002/hyp.10082.
- Chengxiang QZ, John G, Yuanhong L, Chengxiang M. 2015. Rainwater harvesting for agriculture and water supply. Edited by Yuanhong L, Qiang Z. Beijing: Springer International Publishing.
- Critchley W, Siegert K, Chapman C. 1991. A manual for the design and construction of water harvesting schemes for plant production food and agriculture organization of the United Nations. Rome. http://www.fao.org/ docrep/U3160E/u3160e00.htm.
- FAO. 2015. Towards a regional collaborative strategy on sustainable agricultural water management and food security in the Near East and North Africa Region main report. Roma (Italy).
- Haile G, Suryabhagavan KV. 2019. GIS-based approach for identification of potential rainwater harvesting sites in Arsi Zone, Central Ethiopia. Model Earth Syst Environ. 5(1):353–367. doi: 10.1007/s40808-018-0537-7.
- Harka AE, Roba NT, Kassa A. 2020. Modelling rainfall runoff for identification of suitable water harvesting sites in Dawe River Watershed, Wabe Shebelle River Basin, Ethiopia. J Water Land Dev. 47:186–195. doi: 10.24425/jwld.2020.135313.
- Hassan I, Muhammad A, Javed L, Muhammad B, Rashid S, Ahmad A, Akhtar, S, Hussain. 2020. Weighted overlay based land suitability analysis of agriculture land in Azad Jammu and Kashmir Using Gis and AHP. Pak J Agric Sci. 57(6):1509–1519. doi: 10.21162/pakjas/20.9507.
- Horton RE. 1945. Erosional development of streams and their drainage basins; hydrophysical approach to quantitative morphology. Geol Soc Am Bull. 56(3):275–370. doi: 10.1130/0016-7606(1945)56. [275: EDOSAT.2.0.CO;2]
- Kang HM, Fadhilah Y. 2012. Homogeneity tests on daily rainfall series in Peninsular Malaysia. Int J Contemp Math Sci. 7(1):9–22.
- Khudhair MA, Sayl KN, Darama Y. 2020. Locating site selection for rainwater harvesting structure using remote sensing and GIS. IOP Conf Ser: Mater Sci Eng. 881(1):012170. doi: 10.1088/1757-899X/881/1/012170.
- Maina CW, Raude JM. 2016. Assessing land suitability for rainwater harvesting using geospatial techniques: a case study of Njoro Catchment, Kenya. Appl Environ Soil Sci. 2016:1–9. doi: 10.1155/2016/4676435.
- Mamo M, Habte K, Jain K. 2013. Runoff and sediment modeling using SWAT in Gumera catchment, Ethiopia. Open J Mod Hydrol. 03(04):196–205. doi: 10.4236/ojmh.2013.34024.
- Mosase E, Kayombo B, Tsheko R, Tapela M. 2017. Assessment of the suitability of rain water harvesting areas using multi-criteria analysis and fuzzy logic. Adv Res. 10(4):1–22. doi: 10.9734/AIR/2017/33983.
- Munyao JN. 2010. Use of satellite products to assess water harvesting potential in remote areas of Africa: a case study of Unguja Island Zanzibar [Master's thesis]. The Netherlands: University of Twente.
- Negash T, Asfaw K, Dame Y. 2020. Modeling land use dynamics in the Kesem Sub-Basin, Awash River Basin, Ethiopia. Cogent Environ Sci. 6(1):868–873. doi: 10.1080/23311843.2020.1782006.
- Ouerchefani D, Hanen D, Eric D, Yann C, Saadi A. 2013. Geographic information system (GIS) and remote sensing for multi-temporal analysis of sand encroachment at Oglet Merteba (South Tunisia). Afr J Environ Sci Technol. 7(October):938–943. doi: 10.5897/AJEST2012.1414.
- Rusa M, Bertu A. 2018. Assessment of rainwater harvesting potential using GIS. In: IOP Conference Series: Materials Science and Engineering. Vol. 330. doi: 10.1088/1757-899X/330/1/012119.
- Saaty TL, Vargas LG. 2012. Models, methods, concepts & applications of the analytic hierarchy process. Edited by FS Hillier. International Series in Operations Research & Management Science. 2nd ed. Vol. 175. New York (NY): Springer New York Heidelberg.
- Sadeghi S, Eildoromi A, Faramarzi M. 2019. New application of fuzzy logic algorithm in GIS for land classification. In: Forum Geografic. Vol. XVIII; p. 161–169. doi: 10.5775/fg.2019.068.d.
- Subramanya K. 2016. Engineering hydrology. The McGraw-Hilll. 3rd ed. New Delhi: Tata Mc Graw-Hill Publishing Company Limited. doi: 10.4337/9781783474141.00005.
- Sutcliffe JE, Nash JV. 1970. River flow forecasting third edition conceptual models Part I - A discussion of principles. J Hydrol. 10(3):282–290.
- Tibebe D, Bewket W. 2011. Surface runoff and soil erosion estimation using the SWAT model in the Keleta Watershed, Ethiopia. Land Degrad Dev. 22(6):551–564. doi: 10.1002/ldr.1034.
- Tumbo SD, Mahoo HF, Mkilamwinyi FO, Mbilinyi BP. 2014. Identification of suitable indices for identification of potential sites for rainwater harvesting. Tanzania J Agric Sci. 12(2):35–46.
- UN (United Nation). 2014. Water and energy. Vol. 1. Paris, France.
- Van A, Griensven A, Meixner T, Grunwald S, Diluzio TM, Srinivasan R. 2006. A global sensitivity analysis tool for the parameters of multi-variable catchment models. J Hydrol. 324(1–4):10–23. doi: 10.1016/j.jhydrol.2005.09.008.
- Victor M. 2016. GIS based multi criteria analysis in mapping potential for irrigated agriculture. Case study: Machakos County [doctoral dissertation]. University of Nairobi, Kenya.
- Worqlul AW, Dile YT, Jeong J, Adimassu Z, Lefore N, Gerik T, Srinivasan R, Clarke N. 2019. Effect of climate change on land suitability for surface irrigation and irrigation potential of the shallow groundwater in Ghana. Comput Electron Agric. 157:110–125. doi: 10.1016/j.compag.2018.12.040.
- Wu R, Gabriela L, Letona M. 2018. Optimal sites identification for rainwater harvesting in northeastern Guatemala by analytical hierarchy process. Water Resour Manage. 32(12):4139–4153. doi: 10.1007/s11269-018-2050-1%0A.
- Yazdi Z, Ali R, Jafari R. 2015. Analysis and modeling of geospatial datasets for porphyry copper prospectivity mapping in Chahargonbad Area, Central Iran. Arab J Geosci. 8(10):8237–8248. doi: 10.1007/s12517-014-1740-0.
- Zimmermann H, Zysno P. 1980. Latent connectives in human decision making. Fuzzy Sets Syst. 4(1):37–51. doi: 10.1016/0165-0114(80)90062-7.x.