
 ?Mathematical formulae have been encoded as MathML and are displayed in this HTML version using MathJax in order to improve their display. Uncheck the box to turn MathJax off. This feature requires Javascript. Click on a formula to zoom.
Abstract
This study aims to map flood susceptibility in the Qaa’Jahran watersheds located in Dhamar, Yemen, using geoprocessing and computational techniques. Historical flood data and SAR imagery were used to monitor and create a flood inventory map. The artificial neutral network (ANN) was trained using a novel algorithm called GWO_LM, which is a hybridization between the Levenberg-Marquardt algorithm (LM) and Grey Wolf Optimizer (GWO) meta-heuristic algorithm and compared the results with state of art machine learning algorithms. The GWO_LM_ANN model exhibited excellent performance in the evaluation, achieving a precision of 97.92%, sensitivity of 100%, specificity of 100%, F1 score of 98.95%, accuracy of 98.75% and AUC of 98.48. This indicates that using GWO_LM for training ANN enhanced the searching process for the optimal weights, resulting in outperforming other state-of-the-art models. The findings hold significant implications for disaster preparedness and response in the Qaa’Jahran watersheds, enabling targeted and efficient non-structural solutions to mitigate the detrimental effects of flash floods in particularly sensitive locations. The use of the previously unexplored GWO_LM model represents a notable advancement in flood susceptibility assessment, surpassing traditional methods and offering novel insights to the existing literature.
1. Introduction
Natural disasters caused by excess water resources occur yearly in many parts of the world (Arabameri et al. Citation2019; Perucca and Angilieri Citation2011). Secondary disasters caused by this phenomenon such as erosion, landslides and sinkholes (Cao et al. Citation2016). The frequency of these disasters has increased in recent decades due to global climate change (Alfieri et al. Citation2018), and experts predict that flood damage will rise significantly in the coming years (Arabameri et al. Citation2019). Despite the urgent need to mitigate the risk and reduce the damage associated with floods, predicting their occurrence remains difficult due to the complex interplay of multiple physical factors (Al-Areeq et al. Citation2021b, Citation2021a; Cao et al. Citation2016).
Floods are the most damaging and deadly of all natural disasters, affecting approximately 200 million people worldwide yearly and causing enormous economic losses (Ali et al. Citation2020). Romania and other European countries such as Italy, Germany, Spain and France have suffered severe losses due to floods (Vinke-de Kruijf et al. Citation2015). Therefore, it is imperative to conduct research into flood vulnerability and develop preventive measures to reduce its severity. Identifying flood risk zones with high precision is essential in this regard, as it can help minimize the effects of floods. Therefore, flood mitigation measures should focus on identifying highly vulnerable areas to floods to mitigate their impact.
About 100,000 Yemenis are affected by natural catastrophes yearly as estimated by the Emergency Events Database (EM-DAT) (Al-Aizari et al. Citation2022). Many climate models suggest that Yemen may experience more frequent and severe floods in the future due to high precipitation (Breisinger et al. Citation2012). In October 2008, the Wadi Hadramout in Yemen had devastating floods caused by prolonged heavy rains. Yemen has witnessed a rising occurrence of natural hazards attributed to factors such as inadequate environmental controls, rapid urbanization and substantial population growth (Breisinger et al. Citation2012). The floods caused extensive damage, resulting in over $1.6 billion in losses, more than 70 fatalities, displacement of 25,000 people and destruction of over 2800 homes (Breisinger et al. Citation2012).
Flood hazard modelling and forecasting methods have been thoroughly investigated in various research studies. For instance, Konadu and Fosu (Citation2009) used a vector-based Geographic Information System (GIS) and a Digital Elevation Model (DEM) to model watercourses and predict floods in Accra, Ghana. Concurrently, Al-Areeq et al. (Citation2022) suggested a GIS-integrated machine learning model for flood susceptibility assessment.
Multifaceted techniques are utilized for flood hazard evaluation, including MCDM methods such as TOPSIS (Cheng et al. Citation2006), and logistic regression (Al-Juaidi et al. Citation2018). Primary statistical techniques for flood susceptibility mapping encompass frequency ratio methods (Ullah and Zhang Citation2020), frequency ratio and weights-of-evidence (Rahmati et al. Citation2016), frequency ratio and index of entropy (Wang et al. Citation2021) and statistical index.
Furthermore, non-machine learning models such as Global Circulation Models (GCMs), a numeric model, were used for GCMs to evaluate the nature of annual-maximum precipitation events and estimate future precipitation in the Kolkata Metropolitan Area (KMA) (Malik et al. Citation2020a). Also, HEC-RAS (Version 5.0.7) rain-on-grid model was applied to simulate the August 2016 flood in the Dwarkeswar River near Arambag Town, Hooghly District, West Bengal (Malik et al. Citation2020b).
However, machine learning techniques like support vector machine (SVM) (Hussain et al. Citation2023; Roy et al. Citation2020; Shafapour Tehrany et al. Citation2019). random forest (RF) (Abedi et al. Citation2022; Roy et al. Citation2020), extreme gradient boosting (XGBoost) (Abedi et al. Citation2022; Ghanim et al. Citation2023; Ma et al. Citation2021), artificial neural networks (ANN) (Wang et al. Citation2022) and Naïve ayes (NB) (Pham et al. Citation2020a), analytical hierarchy processes (AHP) (Das et al. Citation2019; Hussain et al. Citation2021), knowledge-driven (KD), fuzzy logic (FL) and logistic regression (Malik et al. Citation2020c), evidence belief function (EBF), binomial Logistic regression (LR) and ensemble of EBF and LR (EBF-LR) (Chowdhuri et al. Citation2020) are currently being used to tackle flood-related problems. Moreover, statistical models were used to estimate the probability of flood occurrences, including log-normal (LN), Log-Pearson Type III (LPT-3), Gumbel’s extreme value distribution (EV-I) and extreme value distribution-III (EV-III) (Das et al. Citation2018; Malik and Pal Citation2021). Although deep learning models such as convolutional neural network (CNN) (Dong et al. Citation2021; Ullah et al. Citation2022; Wang et al. Citation2020), recurrent neural network (RNN) (Cai and Yu Citation2022) and deep neural network (DNN) (Costache et al. Citation2020) are highly accurate in predicting flash floods and landslides, they require large datasets, which can be a problem in regions like Yemen that have limited data (Al-Aizari et al. Citation2022).
Optimization of machine learning algorithms is crucial. Machine learning has proven effective for predicting and mitigating flood susceptibility (Kulkarni and Satapathy Citation2020; Zhang et al. Citation2022). However, selecting and fine-tuning the optimal algorithm is key for accurate predictions (Yang and Shami Citation2020). Various optimization algorithms have been applied in conjunction with ML algorithms in flood susceptibility studies, including deep learning (Pham et al. Citation2021), ensembles and GIS techniques (Costache et al. Citation2022), XGboost with a genetic algorithm (GA) (Thi Thuy Linh et al. Citation2022), fuzzy rule-based feature selection (Bui et al. Citation2019), hybrid ML algorithms (Ranjgar et al. Citation2021) and fuzzy-metaheuristic ANFIS-based ML models (Arora et al. Citation2021).
Training ANNs is a non-linear optimization problem addressed by various optimization algorithms like gradient descent, Levenberg-Marquardt (LM) and Adam. However, LM may encounter local minima and depends heavily on initial optimization parameters’ weights, making it potentially time-consuming (Yan et al. Citation2021). This article proposes a new approach, GWO_LM ANN, integrating the LM algorithm with the Grey Wolf Optimizer (GWO) to develop an enhanced ANN classifier, which aims to overcome LM limitations while harnessing GWO's advantages.
It is imperative to emphasize the distinguishing characteristics of the proposed hybridization method compared to those put forth in the existing literature. The prevailing methods found in the literature generally adopt one of two approaches to hybridize gradient-based algorithms with meta-heuristic algorithms:
They utilize gradient-based algorithms to determine the optimal weights of the ANN while using meta-heuristic algorithms to fine-tune the remaining parameters.
They use meta-heuristic algorithms to ascertain the optimal initial weights for the ANN and subsequently utilize gradient-based algorithms to continue the training process.
In contrast, the present research introduces a novel hybridization method (GWO_LM_ANN) that amalgamates the functionalities of both algorithms, ensuring an optimal equilibrium between global exploration and local exploitation. This innovative approach is designed to enhance the overall optimization performance by harnessing the strengths of both methods in a synergistic manner.
Our contributions in this study significantly advance flood susceptibility mapping. We undertook an in-depth analysis of flood susceptibility in Qaa’Jahran watersheds, a region in Dhamar, Yemen, highly susceptible to flooding due to climate change and urbanization. We adopted innovative geoprocessing and computational techniques using historical flood data and SAR imagery to pinpoint flood-prone zones (He et al. Citation2023; Tazmul Islam and Meng Citation2022; Zhao et al. Citation2023), presenting a new approach to flood susceptibility mapping. These results can significantly impact flood mitigation strategies by accurately identifying flood-prone areas and fostering the adoption of non-structural solutions.
The remainder of this article is meticulously structured to provide a comprehensive understanding of the subject matter. In Section 2, we delve into a detailed description of the case study under review. This is followed by Section 3, which offers an extensive methodological overview, encompassing an inventory of flood zones, the analysis of flood conditioning factors, a background of the models used, details on the proposed model and a discussion of the evaluation metrics used. Section 4 then presents the application results and analysis, including the importance of features, the convergence rate of the proposed model, the performance of the flood susceptibility models on the testing dataset, and maps identifying flood-prone zones. Finally, Section 5 encapsulates the article by providing a succinct conclusion, summarizing the findings and their implications.
2. Case study description
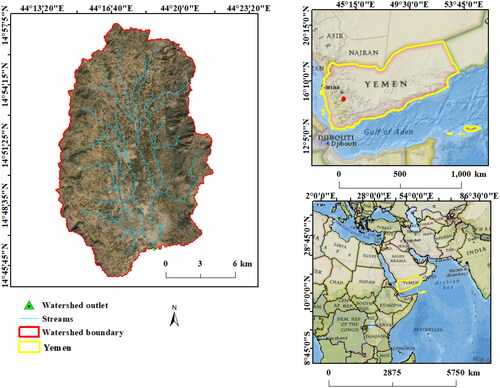
The Qaa’Jahran basin, situated in Yemen’s western Central Highland Plains (Al-Areeq et al. Citation2021; Al-Masnay et al. Citation2022), is frequently subjected to flash floods, a characteristic that is common among numerous other basins throughout the country. The focal point of this study is the upper region of the Qaa’Jahran watershed, spanning an area of 209.68 km2, with parts of it urbanized. The study area lies between 14° 40′ 00ʺ and 14° 56′ 50ʺ north latitude and 44° 13′ 45ʺ and 44° 22′ 30ʺ east longitude and is situated at an altitude ranging from 2322 to 2925 m above sea level. It is located about 55 km from Sana’a, Yemen’s capital city. The northern part of Qaa’Jahran, where Mabar city and surrounding villages are located, has been affected by flash floods in recent years, causing damage to both public and private infrastructure. Despite the presence of urban settlements like the city of Mabar and neighbouring villages, which account for about 1.3% of the area, the majority of the study area remains non-urban. The upper part of Qaa’Jahran’s location is depicted in .
Figure 1. Qaa’Jahran watershed location.
3. Methodological overview
The applied methodology’s overall workflow, depicted in , encompasses several stages for flood susceptibility mapping. It commences with data collection and pre-processing, involving relevant information like topography, land cover, hydrological features, historical flood events and subsidence records. Subsequently, the dataset is divided into training and validation sets, and the input data is normalized to ensure consistency. Thereafter, several ML models were applied like linear regression (LR) k nearest neighbour (KNN), random forest (RF) LM_ANN, support vector machine (SVM) Tree-based Pipeline Optimization Tool (TPOT), AdaBoost radial basic function (ABRBF) and the proposed GWO_LM_ANN model. The hyperparameters of each ML model were meticulously adjusted and optimized. This fine-tuning step was essential in maximizing the accuracy and predictive capabilities of each model.
Figure 2. The framework of the proposed methodology.
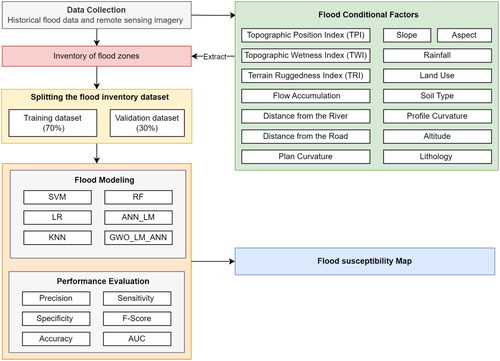
A rigorous comparative analysis was then carried out to evaluate the performance of all the fine-tuned ML models. The comparison involved the use of various evaluation metrics, enabling the researchers to assess the individual strengths and weaknesses of each model in the context of flood susceptibility mapping. Particular attention was given to the proposed GWO_LM_ANN model, which was developed with the explicit goal of outperforming the other models.
Following the model development and validation, an independent evaluation was conducted using a new dataset. This dataset was distinct from the one used for model development and fine-tuning, ensuring an unbiased assessment of the models’ generalization capabilities. The evaluation results on this new dataset provided valuable insights into the models’ real-world applicability and robustness. Finally, based on the final validated model, a flood susceptibility map was generated. This map depicted the spatial distribution of flood-prone areas, offering crucial information for decision-makers, urban planners and disaster management authorities.
3.1. Inventory of flood zones
In order to accurately assess the risk of future floods, it is crucial to have both historical flood data and scientific evidence to support the analysis (Manandhar Citation2010). The reliability and accuracy of future flood risk estimates depend on the amount of historical flood data available (Merz et al. Citation2007). The locations of past flood events play a critical role in estimating flood susceptibility, as areas with similar characteristics to those that have previously experienced flooding are more likely to flood again (Arabameri et al. Citation2019). This study used Sentinel-1 SAR imagery and historical flood data to identify flooded areas and create a detailed flood zone map. The methodology used several key steps to achieve this. Firstly, the study area was equipped with historical flood data and SAR imagery, encompassing both pre-flood and post-flood images. Pre-processing was conducted to enhance the quality and interpretability of the SAR images, involving radiometric calibration, speckle filtering and geometric correction. This crucial step prepared the images for the subsequent analysis. Moving forward, the pre-processed SAR images underwent thorough image analysis to pinpoint areas affected by flooding and distinguish them from non-flood locations. The presence of floodwater was accurately detected by carefully examining significant changes between the pre-flood and post-flood images. Finally, based on the historical flood data and image analysis results, the flood and non-flood locations were classified and differentiated, culminating in a comprehensive flood zone inventory. This integrated approach successfully merged SAR imagery and historical flood data to provide valuable insights into flood extents and inundation patterns, facilitating effective flood risk assessment and management.
To create the flood vulnerability model, the flood inventory dataset needs to be split into training and validation sets (Caniani et al. Citation2008), and the model is constructed using weight values from the training set (Pradhan et al. Citation2014). For this particular study, the dataset comprises 141 non-flood and 141 flood locations, ascertained through the combination of historical flood data and SAR imagery within a GIS framework. Subsequently, this data was partitioned into training (80%) and validation (20%) subsets to facilitate in-depth analysis and verification of the model’s performance. It should be noted that normalization was utilized as the key technique to rescale numerical features of the dataset to a common range between 0 and 1. This approach ensures that no particular feature dominates others due to differences in scales, which could potentially bias the outcome of many machine learning algorithms.
3.2. Flood conditioning factors
For this study, fifteen flood conditioning elements were selected based on previous research and expert recommendations. These elements are highly associated with flood disasters and include Topographic Position Index (TPI), slope, altitude, rainfall, distance from the road, aspect, Topographic Wetness Index (TWI), flow accumulation, land use, soil type, distance from the river, plan curvature, profile curvature, Terrain Ruggedness Index (TRI) and lithology (). The study considers several crucial factors that significantly influence flood likelihood and impact. Elevation serves as a key determinant in flood occurrences, with low-lying areas being more susceptible due to gravitational effects (Tien Bui et al. Citation2016). The slope impacts runoff, infiltration and the velocity of water flow (Meraj et al. Citation2015).
Figure 3. The Qaa’Jahran watershed’s flood predictors.
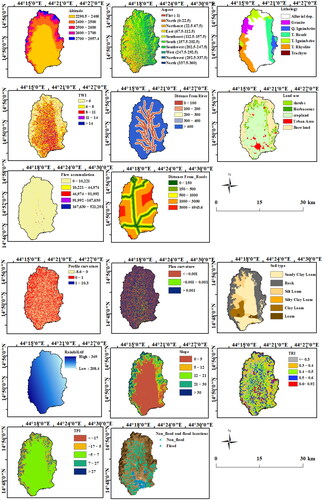
The river’s proximity is another vital aspect, as regions closer to the riverfront experience more significant flood impacts, diminishing with distance (Vojtek and Vojteková Citation2019). Land use directly and indirectly influences runoff production, sediment transport and infiltration (Shadmehri Toosi et al. Citation2019). Rainfall, especially during intense periods, is a primary catalyst for floods (Tehrany et al. Citation2013). Soil type also plays a pivotal role in infiltration and runoff processes. Clay-rich soils, for instance, due to their impermeability, intensify drainage, thereby contributing to flooding (Pham et al. Citation2020b). Topographic Wetness Index (TWI) is a common measure for assessing the impact of terrain on hydrology, with high wetness values indicating a greater likelihood of flooding.
Lithology, which influences water infiltration due to its porosity, significantly affects flood frequency (Costache and Tien Bui Citation2019). TRI, which is the variation in altitude between neighbouring cells on an elevation grid (Kalantari et al. Citation2017), is also considered as part of the chosen criteria for this study. These factors, when combined, provide a comprehensive understanding of flood risks in the region.
3.3. Background of models
In literature, multiple optimization algorithms have been proposed to address non-linear optimization problems. Such algorithms include Gradient Descent (Qian Citation1999), Levenberg-Marquardt (LM) (Hagan and Menhaj Citation1994) and Adam (Kingma and Ba Citation2014). Also, in the domain of computer science, hybrid combinations of several algorithms have recently gained much popularity. By merging multiple algorithms, more resilient and effective algorithms can be formulated (Akay et al. Citation2022). This process has facilitated the development of hybrid metaheuristic algorithms, also referred to as hybrid artificial neural networks (HANN) (Nawi et al. Citation2013). However, despite the existence of various hybrid methods, the problem of local minima in neural networks persists. Moreover, in accordance NFL Theorem, no better optimization technique is available for all optimization problems (Aljarah et al. Citation2018). Hence, researchers are required to investigate their problems in order to discover the most suitable optimization algorithms for their particular problem (Saleh and Akay Citation2021). With this consideration in mind, the authors opt to hybridize two of the most common algorithms, combining the strengths of each. One of these algorithms exhibits superior performance in exploration, while the other demonstrates high exploitation ability. The subsequent subsections will delve into two optimization algorithms pertaining to the proposed work.
3.3.1. Levenberg-Marquardt algorithm (LM)
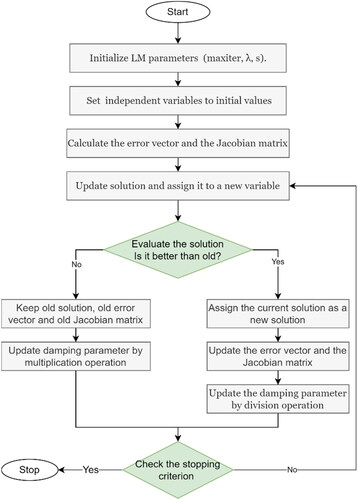
According to Madsen et al. (Citation2004), the LM method, first proposed by Levenberg (1944) and later refined by Marquardt (1963), stands as a popular and effective optimization algorithm in the literature to address non-linear least-squares problems. This technique constitutes a modification of the Gauss-Newton method, incorporating a damping mechanism that allows the inclusion of the Steepest-Descent (SD) and Gauss-Newton (GN) techniques. Indeed, the LM algorithm may be regarded as a combined approach that balances the advantages and drawbacks of the SD and GN methods. A detailed flowchart of the LM algorithm is provided in , offering further insights into this optimization method.
Figure 4. Flowchart of LM algorithm.
3.3.2. Grey Wolf Optimizer (GWO)
Mirjalili et al. (Citation2014) developed the GWO, an optimization algorithm mimicking wolves’ social characteristics and hunting behaviour. It features a simple structure, easy implementation and strong convergence. It uses self-adaptive adjustment, information feedback and four steps: pack initialization, wolf position updates with three search mechanisms, ranking and social hierarchy updates and iteration until a stopping criterion is met. The search agents use three basic operations to update their positions in the search space, including searching for prey, encircling and attacking prey. During the exploration phase, the search agents randomly explore the search space, while during the exploitation phase, they converge to the best solutions found so far. The initial population of grey wolves is generated randomly. The GWO algorithm adjusts the positions of the wolves using a set of equations that incorporate the influence of the alpha, beta and delta wolves, which represent the most optimal, second-best and third-best solutions, respectively. Thus, the position of each wolf in the group is updated using the equations stated below:
(1)
(1)
(2)
(2)
(3)
(3)
wherein
and
signify the respective locations of the alpha, beta and delta wolves, the current wolf’s position is represented by
denotes the vector encompassing the distances between the search agents and the prey, which corresponds to the optimal solution. For each iteration, random coefficient vectors
and
are generated.
The calculation of coefficients and
is accomplished through the utilization of their corresponding equations, denoted by EquationEquations 4
(4)
(4) and Equation5
(5)
(5) , respectively.
(4)
(4)
(5)
(5)
wherein the components of
experience a linear reduction from 2 to 0 across the iterations,
and
represent random vectors.
constitutes the maximum quantity of iterations, and the coefficient
serves to regulate the linearly diminishing scope of the search agents.
3.3.3. Proposed model
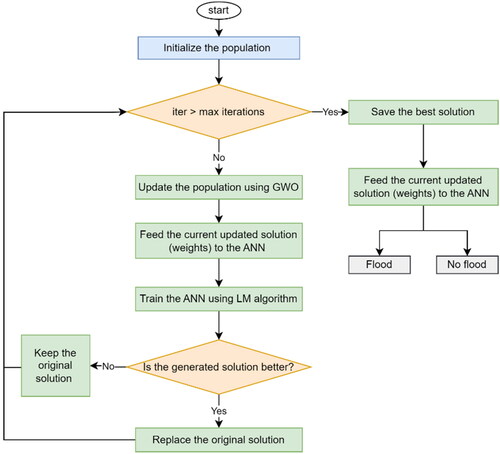
This article proposes a novel hybridization between LM and a state-of-the-art metaheuristic algorithm called GWO, which overcomes the LM algorithm limitations and produces a better ANN classifier. The proposed optimization algorithm is named GWO_LM, and its pseudo code is introduced in Algorithm 1. The proposed model uses the fast convergence advantage of the LM algorithm to enhance the searching exploitation and uses the good exploration ability of the GWO algorithm to avoid falling into the trap of the local solution. Thus, new initial weights are fed to the ANN in each iteration. Then, the LM algorithm starts training the ANN. Thereafter, the generated solution is saved if it produces better results; otherwise, it is deleted immediately. In the next iteration, the saved solution is updated using the updated equations of the GWO algorithm and fed to the LM algorithm. The update equations, together with the framework search of the GWO algorithm, enhance the model’s exploration. In contrast, the LM algorithm enhances its exploitation and convergence.
Furthermore, depicts the flowchart of the proposed classification model. The proposed model uses a simple structure for the artificial neural network (ANN). It comprises of one input layer with fifteen neurons, one hidden layer with five neurons, and one output layer consisting of a single neuron. The intention behind choosing such a simple structure is to demonstrate the effectiveness of the proposed training algorithm. The parameters of the GWO algorithm have been chosen as follows: Population Size = 30 and the Maximum Iterations = 100. After that, the population was initialized randomly using EquationEquation 6(6)
(6) .
(6)
(6)
where
is the upper bound and
is the lower bound of the jth solution.
Figure 5. Flowchart of the proposed classification model.
Algorithm 1:
Grey Wolf Optimizer with Levenberg-Marquardt (GWO-LM)
* Set the initial population (the weights and biases) to be in the range [-2.5, 2.5] by EquationEquation 1(1)
(1) .
* Initialize α, β and γ
* Select the number of Input = 15, Output = 1 and Hidden neurons for the ANN = 5.
* The fitness values of the search agents should be computed, and then they should be graded. ( denotes the solution that the search agent considers to be the best,
the solution that it considers to be the second best, and
the solution that it considers to be the third best)
* t = 0
While (t < Max number of iterations)
For each search agent
Update the position of the current search agent by Equation (3.7)
End for
Use the generated solutions as initial weights to train the ANN using the LM algorithm.
Update α, β and γ
Calculate the fitness values of all search solutions and grade them
Update the positions of
and
t= t + 1
End while
3.4. Evaluation metrics
The current study conducts a comprehensive evaluation of flood susceptibility models by utilizing a diverse set of metrics. These metrics include area under the curve (AUC) and the receiver operating characteristic (ROC) curve, as well as accuracy, F1 measure, precision, sensitivity and specificity. The test dataset is utilized to comprehensively assess the models’ efficacy through these metrics. Such metrics offer a comprehensive understanding of the models’ performance, enabling informed decisions regarding their viability for flood susceptibility analysis. The outcomes of these measurements are derived from the confusion matrix, which is calculated using conventional equations in the following manner.
(7)
(7)
(8)
(8)
(9)
(9)
(10)
(10)
(11)
(11)
The number of false positives is compared to the number of true positives to evaluate the accuracy of a flood susceptibility model. EquationEquation 7(7)
(7) is used to calculate the area under the ROC curve. This metric ranges from 0 to 1, with a higher value indicating greater agreement between the model and actual values. Therefore, a higher AUC value signifies a more precise flood susceptibility model.
4. Application results and analysis
4.1. Feature importance
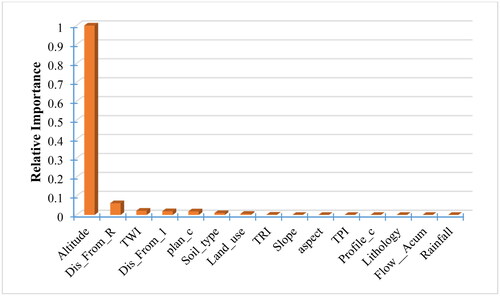
To determine feature importance using an Artificial Neural Network (ANN) for flood susceptibility mapping, one commonly used method is to perform a technique called ‘feature attribution’. This involves analysing the trained ANN model to understand how much each input feature contributes to the model’s predictions.
As per the study findings, regardless of their direction, the top five factors that exhibited the most significant impact on the target variables were altitude, distance to the river, TWI, distance to roads and plan curvature. This conclusion has been supported by various literature, but historical flood data investigations revealed that the most frequent flooding occurrences were attributed to elevation and distance to rivers, which aligns with the findings of previous research conducted by Chapi et al. (Citation2017) and Hosseini et al. (Citation2020). illustrates the ranking of the variables’ absolute weights based on their level of influence on the overall flood analysis.
Figure 6. The impact of flood conditioning factors.
4.2. Performance of the flood susceptibility models on the testing dataset
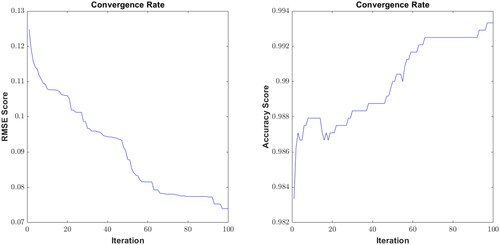
Evaluating the effectiveness of machine learning models relies on the convergence rate, a metric that gauges the speed of performance improvement during training iterations. presents the convergence rate of the proposed model, measured in 'Root Mean Square Error (RMSE)' and accuracy, reflecting the average of independent 30 runs. RMSE is decreasing with each iteration and the accuracy is increasing, this implies that the proposed model is learning and improving its performance over each iteration on the training dataset.
Figure 7. Convergence rate for the proposed model on the training dataset.
The proposed model, based on a metaheuristic algorithm, necessitates 30 repeated experiments for statistical presentation. exhibits mean, standard deviation, maximum and minimum values of performance metrics (RMSE, precision, sensitivity, specificity, F-score, accuracy and AUC) on the training dataset. Results in highlight the algorithm’s stability and robustness, with standard deviations below 1.05% and means above 99% for all metrics.
Table 1. The proposed model performance of the 30 runs on the training dataset.
To assess the strength and effectiveness of our proposed method we conducted a comparison, between the GWO_LM_ANN model and various state of the art machine learning models. This comprehensive evaluation involved algorithms like regression (LR) k nearest neighbour (KNN) random forest (RF) LM_ANN, support vector machine (SVM) Tree based Pipeline Optimization Tool (TPOT) (Abu-Salih et al. Citation2023) and AdaBoost radial basic function (ABRBF) (Luu et al. Citation2023).
The inclusion of TPOT and ABRBF in this comparison is particularly noteworthy, as these cutting-edge ensemble models have been specifically designed to create hazard susceptibility maps for the NH6 case study, thereby maximizing their forecasting capabilities. By subjecting our proposed GWO_LM_ANN model to testing alongside these esteemed competitors we aimed to showcase its superior performance and potential to surpass existing methods.
illustrates the performance of the proposed GWO_LM_ANN model on the testing dataset. They indicate that the proposed GWO_LM_ANN model achieved superior performance compared to all other models in terms of precision, sensitivity, specificity, F-score, accuracy and AUC. It achieved 97.92% precision, 100% sensitivity, 100% specificity, 98.95% F-score, 98.75% accuracy and 98.48 AUC. The effectiveness of the proposed GWO technique in improving the predictions of the LM_ANN model emphasizes its ability to enhance the accuracy and robustness of the predictions. The GWO_LM_ANN model achieves a high precision of 97.92%, accurately identifying most positive samples in the testing dataset. Sensitivity is 100%, indicating the model detects all positive actual samples, emphasizing its robustness in capturing true positive cases. Specificity of 100% highlights the model’s ability to correctly identify negative samples, minimizing false positive predictions.
Table 2. Performance evaluation of the proposed model compared to other models on the testing dataset.
The high F1 score of 98.95% and accuracy of 98.75% achieved by the proposed model indicates its strong classification performance. The True Positive (TP), True Negative (TN), False Positive (FP) and False Negative (FN) are critical components in evaluating the performance of machine learning models, as they give a more granular representation of the model’s performance. By presenting these metrics in a table, it is possible to easily compare the performance of different models and make informed decisions on which model to choose for a specific task. reveals that the proposed model did not mis-classify any sample, which speaks to its robustness. Furthermore, among the evaluated models, the AUC value of 0.9848 indicates that the proposed model is the most representative and performs the best.
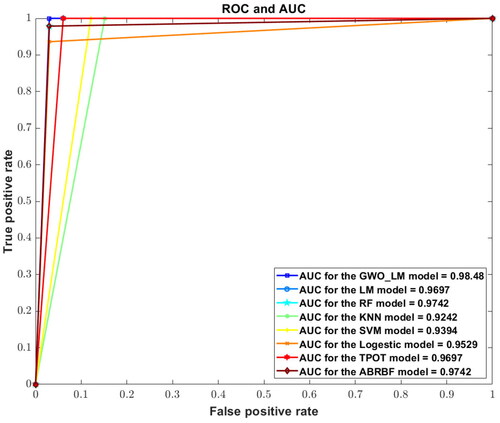
Furthermore, the ROC and AUC metrics, as depicted in , provide a visual representation of the models’ performance on the testing dataset. A perfect model would have an AUC value of 1.0, and an AUC value of 0.5 would indicate a random model. In this study, the proposed model achieved an AUC value of 0.9848, which indicates its superior performance compared to other models. Conversely, among all the models evaluated, the KNN model exhibited the weakest performance, as indicated by its AUC value of 0.9242. The ROC and AUC metrics provide a useful tool for comparing the models’ performance and identifying the most suitable model for a given task.
Figure 8. ROC and AUC for all models on the testing dataset.
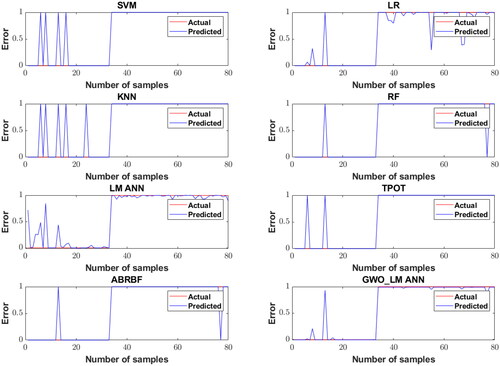
Machine learning models can be better understood and optimized with the help of a plot depicting the actual versus anticipated values. Therefore, in order to visually evaluate the performance of the models and determine how effectively they can generate predictions for fresh, unseen data, we compare the actual vs predicted values of the testing dataset in . The significant deviation between the actual and predicted values for the SVM, KNN, RF, LM ANN, LR, ABRBF and TPOT models reveals their shortcomings and highlights the need for further improvement. On the other hand, the proposed GWO_LM_ANN model stands out with its close alignment between the actual and predicted values, showcasing its stability and robustness. This stability and high performance is a testament to the benefits of advanced techniques such as hybridising different optimization algorithms in improving machine learning models. The results suggest that the GWO_LM_ANN model is better equipped to make accurate predictions and effectively capture the underlying relationships in the data, making it a strong contender for use in real-world applications.
Figure 9. Actual and predicted values of testing dataset for all models.
4.3. Maps identifying flood-prone zones
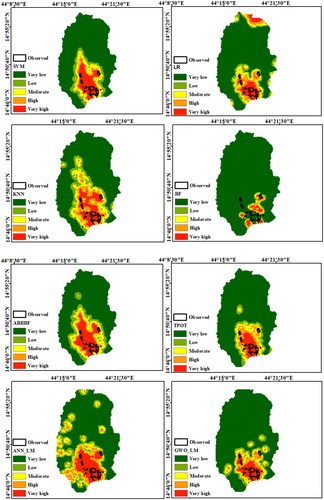
To effectively mitigate flood risk, it is crucial to understand the susceptibility of a region to flooding. One important tool for managing flood risk is the classification of flood susceptibility maps, which involves categorizing probability maps generated by flood models into different zones based on various classification methods. The quantile approach is the most widely used technique for generating susceptibility maps (Tehrany et al. Citation2015). This study used the quantile method to classify the flood susceptibility maps generated by machine learning models into five subcategories: very high, high, moderate, low and very low.
To validate the models’ performance, out-of-sample data points were used to test the models, drawn from real-world flood events that occurred on August 17, 2022. These new observations provide useful insights into how well the model will perform in new, unseen situations. The examination of flood susceptibility mapping models was conducted based on the validation of classical machine learning models, two state-of-the-art models and a proposed model using new data samples. It was observed that RF model fell short in covering the inundated area during the validation phase. Conversely, the proposed models, namely SVM, KNN, LR and ANN_LM, demonstrated their competence in mapping the extent of the inundated area. However, the predicted inundated areas exceeded the well-known ones by a significant margin, indicating a substantial overestimation in their predictions. In contrast, the proposed model emerged as the most effective in identifying high-risk areas. Additionally, a comparison was made between the proposed model and two novel models, namely ABRBF introduced by Luu et al. (Citation2023) and TPOT proposed by Abu-Salih et al. (Citation2023). Click or tap here to enter text. The findings revealed that ABRBF produced inundated area predictions that closely aligned with those generated by SVM. Conversely, TPOT outperformed ABRBF in terms of prediction accuracy. Nevertheless, when comparing these models to the observed data, it became evident that some of the observed very high-risk areas fell within the predicted areas of low, moderate and high risk. In contrast, the proposed model accurately identified all observed very high-risk areas within the predicted highly risky zone, consistent with historical data and the observed flood inundation areas during the storm event on August 17, 2022. Moreover, TPOT significantly overestimated the very high-risk areas. This confirmation solidifies the proposed model’s superiority in identifying high-risk areas. illustrates the flood susceptibility maps for the study area. These maps are classified into five subcategories, namely: very low, low, moderate, high and very high.
Figure 10. Maps indicating the likelihood or vulnerability of Qaa’Jahran to experience floods.
5. Conclusion
In this study, flood susceptibility in the Qaa’Jahran watersheds of Dhamar, Yemen, was effectively mapped using geoprocessing and computational techniques. SAR imagery and historical flood data were utilized to create a flood inventory map, addressing the challenges posed by one of the most flood-prone regions in Yemen. Adopting the primary non-structural solutions designed to mitigate the detrimental effects of flash floods is based on precisely identifying particularly sensitive locations. In this study, ANN was trained using a novel algorithm called GWO_LM, which combines the LM algorithm and GWO algorithm. The efficacy of the proposed model was assessed on a testing dataset using a range of metrics: precision, sensitivity, specificity, F1 score, accuracy and AUC. Comparative analysis revealed that the GWO_LM_ANN model outperformed other models, including KNN, SVM, LR, ANN_LM, ABRBF and TPOT, demonstrating its superiority in accurately identifying flood-prone areas. The KNN model was revealed to be the least effective, while the GWO_LM model emerged as the superior performer, achieving an impressive precision of 97.92%, a sensitivity of 100%, a specificity of 100%, an F1 score of 98.95%, an accuracy of 98.75% and an AUC of 98.48. This highlights the efficiency of the hybridization between LM algorithm and the proposed metaheuristic algorithm. The key innovation of this study is the introduction of the GWO_LM algorithm, a new approach to assessing susceptibility to natural hazards, marking its first appearance in the academic literature. The model’s robust performance in identifying high-risk areas aligns closely with historical data and observed flood inundation areas, confirming its reliability as a valuable tool for flood risk assessment and mitigation.
The implications of this research extend beyond the Qaa’Jahran watersheds and Yemen. As the proposed model demonstrates competence in mapping inundated areas and accurately identifying high-risk regions, it holds significant value for flood management efforts globally. With climate change exacerbating the frequency and intensity of floods worldwide, the ability to precisely identify vulnerable locations becomes paramount for disaster preparedness and response. By offering a novel hybridization method for flood susceptibility assessment and showcasing its superiority over traditional models, our research contributes valuable insights to the field of natural hazard mapping. The adoption of the GWO_LM algorithm in flood risk studies can enhance the accuracy and effectiveness of flood mitigation strategies, benefiting regions prone to flooding across the globe.
In conclusion, the proposed models, including SVM, KNN, LR and ANN_LM, demonstrated competence in mapping the inundated area, but exhibited a tendency to overestimate the extent of flooding compared to well-known areas. However, the proposed model stood out as the most effective in identifying high-risk areas, surpassing alternative models such as ABRBF and TPOT. While these models showed some discrepancies when compared to observed data, the proposed model consistently accurately identified all observed very high-risk areas within the predicted highly risky zone, aligning with historical data and observed flood inundation areas. This robust performance confirms the superiority of the proposed model in accurately identifying high-risk areas, making it a valuable tool for flood risk assessment and mitigation efforts.
Author contributions
Conceptualization, methodology, software, validation, formal analysis, investigation, resources, visualization, A.M.A.-A, R.A.A.S., A.A.J.G., M.G., N.M.A.-A. and E.A.-W.; data curation, A.M.A.-A, R.A.A.S., M.G., N.M.A.-A. and A.A.J.G.; writing—original draft preparation, A.M.A.-A, R.A.A.S., A.A.J.G., M.G., N.M.A.-A. and E.A.-W.; writing—review and editing, A.M.A.-A, R.A.A.S., A.A.J.G., M.G., N.M.A.-A. and E.A.-W. All authors have read and agreed to the published version of the manuscript.
Acknowledgment
The authors are thankful to the Deanship of Scientific Research at Najran University for funding this work under the Research Group funding program grant code (NU/RG/SERC/12/47). The authors also would like to acknowledge the support provided by the Interdisciplinary Research Center for Membranes and Water Security and Interdisciplinary Research Center for Intelligent Secure Systems (IRC-ISS) at KFUPM to complete this study.
Disclosure statement
No potential conflict of interest was reported by the authors.
References
- Abedi R, Costache R, Shafizadeh-Moghadam H, Pham QB. 2022. Flash-flood susceptibility mapping based on XGBoost, random forest and boosted regression trees. Geocarto Int. 37(19):5479–5496. doi: 10.1080/10106049.2021.1920636.
- Abu-Salih B, Wongthongtham P, Coutinho K, Qaddoura R, Alshaweesh O, Wedyan M. 2023. The development of a road network flood risk detection model using optimised ensemble learning. Eng Appl Artif Intell. 122:106081. doi: 10.1016/j.engappai.2023.106081.
- Akay R, Saleh RAA, Farea SMO, Kanaan M. 2022. Multilevel thresholding segmentation of color plant disease images using metaheuristic optimization algorithms. Neural Comput Appl. 34(2):1161–1179. doi: 10.1007/s00521-021-06437-1.
- Al-Areeq AM, Al-Zahrani MA, Sharif HO. 2021a. Physically-based, distributed hydrologic model for Makkah watershed using GPM satellite rainfall and ground rainfall stations. Geomatics, Nat Hazards and Risk. 12(1):1234–1257. http://www.tandfonline.com/action/journalinformation?show=aimsscope&journalcode=tgnh20#.VsXodSCLRhE. doi: 10.1080/19475705.2021.1924873.
- Al-Areeq AM, Al-Zahrani MA, Sharif HO. 2021b. The performance of physically based and conceptual hydrologic models: a case study for Makkah Watershed, Saudi Arabia. Water. 13(8):1098. doi: 10.3390/w13081098.
- Al-Aizari AR, Al-Masnay YA, Aydda A, Zhang J, Ullah K, Islam ARMT, Habib T, Kaku DU, Nizeyimana JC, Al-Shaibah B, et al. 2022. Assessment analysis of flood susceptibility in tropical desert area: a case study of Yemen. Remote Sens. 14(16):4050. doi: 10.3390/rs14164050.
- Al-Areeq NM, Quriaa HA, Al-Areeq AM, Al-Sabri AM. 2021. Evaluation of groundwater quality variations using Geographical Information System (GIS) and multivariate statistical techniques: a case study from Qa’Jahran Basin, Dhamar, Yemen. Adv Sci Technol Innov. 131–145. doi: 10.1007/978-3-030-67028-3_11/FIGURES/6.
- Al-Areeq AM, Abba SI, Yassin MA, Benaafi M, Ghaleb M, Aljundi IH. 2022. Computational machine learning approach for flood susceptibility assessment integrated with remote sensing and GIS techniques from Jeddah, Saudi Arabia. Remote Sens. 14(21):5515. doi: 10.3390/rs14215515.
- Alfieri L, Dottori F, Betts R, Salamon P, Feyen L. 2018. Multi-model projections of river flood risk in Europe under global warming. Climate. 6(1):6. doi: 10.3390/cli6010006.
- Ali SA, Parvin F, Pham B, Vojtek M, Vojteková J, Costache R, Thi N, Linh T, Quan Nguyen H, Ahmad A, et al. 2020. GIS-based comparative assessment of flood susceptibility mapping using hybrid multi-criteria decision-making approach, naïve Bayes tree, bivariate statistics and logistic regression: a case of Topľa basin, Slovakia. doi: 10.1016/j.ecolind.2020.106620.
- Aljarah I, Faris H, Mirjalili S. 2018. Optimizing connection weights in neural networks using the whale optimization algorithm. Soft Comput. 22(1):1–15. doi: 10.1007/s00500-016-2442-1.
- Al-Juaidi AEM, Nassar AM, Al-Juaidi OEM. 2018. Evaluation of flood susceptibility mapping using logistic regression and GIS conditioning factors. Arab J Geosci. 11(24):765. doi: 10.1007/s12517-018-4095-0.
- Al-Masnay YA, Al-Areeq NM, Ullah K, Al-Aizari AR, Rahman M, Wang C, Zhang J, Liu X. 2022. Estimate earth fissure hazard based on machine learning in the Qa’ Jahran Basin, Yemen. Sci Rep. 12(1):21936. doi: 10.1038/s41598-022-26526-y.
- Arabameri A, Rezaei K, Cerdà A, Conoscenti C, Kalantari Z. 2019. A comparison of statistical methods and multi-criteria decision making to map flood hazard susceptibility in Northern Iran. Sci Total Environ. 660:443–458. doi: 10.1016/j.scitotenv.2019.01.021.
- Arora A, Arabameri A, Pandey M, Siddiqui MA, Shukla UK, Bui DT, Mishra VN, Bhardwaj A. 2021. Optimization of state-of-the-art fuzzy-metaheuristic ANFIS-based machine learning models for flood susceptibility prediction mapping in the Middle Ganga Plain, India. Sci Total Environ. 750:141565. doi: 10.1016/j.scitotenv.2020.141565.
- Breisinger C, Ecker O, Thiele R, Wiebelt M. 2012. The Impact of the 2008 hadramout flash flood in Yemen on economic performance and nutrition: a simulation analysis. Working Paper 1758. Kiel Working Paper. https://www.econstor.eu/bitstream/10419/55865/1/688262007.pdf.
- Bui T, Ribeiro L, Ponti M, Collomosse J. 2019. Deep manifold alignment for mid-grain sketch based image retrieval. In: Jawahar CV, Li H, Mori G, Schindler K, editors. In Computer Vision–ACCV 2018: 14th Asian Conference on Computer Vision; December 2–6, 2018; Perth, Australia. Revised Selected Papers, Part III 14. p. 314–329. Springer International Publishing.
- Cai B, Yu Y. 2022. Flood forecasting in urban reservoir using hybrid recurrent neural network. Urban Clim. 42:101086. doi: 10.1016/j.uclim.2022.101086.
- Caniani D, Pascale S, Sdao F, Sole A. 2008. Neural networks and landslide susceptibility: a case study of the urban area of Potenza. Nat Hazards. 45(1):55–72. doi: 10.1007/s11069-007-9169-3.
- Cao C, Xu P, Wang Y, Chen J, Zheng L, Niu C. 2016. Flash flood hazard susceptibility mapping using frequency ratio and statistical index methods in coalmine subsidence areas. Sustainability. 8(9):948. doi: 10.3390/su8090948.
- Chapi K, Singh VP, Shirzadi A, Shahabi H, Bui DT, Pham BT, Khosravi K. 2017. A novel hybrid artificial intelligence approach for flood susceptibility assessment. Environ Modell Softw. 95:229–245. doi: 10.1016/j.envsoft.2017.06.012.
- Cheng C-T, Zhao M-Y, Chau KW, Wu X-Y. 2006. Using genetic algorithm and TOPSIS for Xinanjiang model calibration with a single procedure. J Hydrol. 316(1–4):129–140. doi: 10.1016/j.jhydrol.2005.04.022.
- Chowdhuri I, Pal SC, Chakrabortty R. 2020. Flood susceptibility mapping by ensemble evidential belief function and binomial logistic regression model on river basin of eastern India. Adv Space Res. 65(5):1466–1489. doi: 10.1016/j.asr.2019.12.003.
- Costache R, Tien Bui D. 2019. Spatial prediction of flood potential using new ensembles of bivariate statistics and artificial intelligence: a case study at the Putna river catchment of Romania. Sci Total Environ. 691:1098–1118. doi: 10.1016/J.SCITOTENV.2019.07.197.
- Costache R, Ngo PTT, Bui DT. 2020. Novel ensembles of deep learning neural network and statistical learning for flash-flood susceptibility mapping. Water. 12(6):1549. doi: 10.3390/w12061549.
- Costache R, Arabameri A, Costache I, Crăciun A, Md Towfiqul Islam AR, Abba SI, Sahana M, Pham BT. 2022. Flood susceptibility evaluation through deep learning optimizer ensembles and GIS techniques. J Environ Manage. 316:115316. doi: 10.1016/j.jenvman.2022.115316.
- Das B, Pal SC, Malik S. 2018. Assessment of flood hazard in a riverine tract between Damodar and Dwarkeswar River, Hugli District, West Bengal, India. Spat Inf Res. 26(1):91–101. doi: 10.1007/S41324-017-0157-8/FIGURES/8.
- Das B, Pal SC, Malik S, Chakrabortty R. 2019. Living with floods through geospatial approach: a case study of Arambag C.D. Block of Hugli District, West Bengal, India. SN Appl Sci. 1(4):1–10. doi: 10.1007/S42452-019-0345-3/FIGURES/7.
- Dong Z, Wang G, Amankwah SOY, Wei X, Hu Y, Feng A. 2021. Monitoring the summer flooding in the Poyang Lake area of China in 2020 based on Sentinel-1 data and multiple convolutional neural networks. Int J Appl Earth Obs Geoinf. 102:102400. doi: 10.1016/j.jag.2021.102400.
- Ghanim AAJ, Shaf A, Ali T, Zafar M, Al-Areeq AM, Alyami SH, Irfan M, Rahman S. 2023. An improved flood susceptibility assessment in Jeddah, Saudi Arabia, using advanced machine learning techniques. Water. 15(14):2511. doi: 10.3390/w15142511.
- Hagan MT, Menhaj MB. 1994. Training feedforward networks with the Marquardt Algorithm. IEEE Trans Neural Netw. 5(6):989–993. doi: 10.1109/72.329697.
- He X, Zhang S, Xue B, Zhao T, Wu T. 2023. Cross-modal change detection flood extraction based on convolutional neural network. Int J Appl Earth Obs Geoinf. 117:103197. doi: 10.1016/j.jag.2023.103197.
- Hosseini FS, Choubin B, Mosavi A, Nabipour N, Shamshirband S, Darabi H, Haghighi AT. 2020. Flash-flood hazard assessment using ensembles and Bayesian-based machine learning models: application of the simulated annealing feature selection method. Sci Total Environ. 711:135161. doi: 10.1016/J.SCITOTENV.2019.135161.
- Hussain M, Tayyab M, Ullah K, Ullah S, Rahman ZU, Zhang J, Al-Shaibah B. 2023. Development of a new integrated flood resilience model using machine learning with GIS-based multi-criteria decision analysis. Urban Clim. 50:101589. doi: 10.1016/j.uclim.2023.101589.
- Hussain M, Tayyab M, Zhang J, Shah AA, Ullah K, Mehmood U, Al‐shaibah B. 2021. GIS-based multi-criteria approach for flood vulnerability assessment and mapping in district Shangla: Khyber Pakhtunkhwa, Pakistan. Sustainability. 13(6):3126. doi: 10.3390/su13063126.
- Kalantari Z, Ferreira CSS, Walsh RPD, Ferreira AJD, Destouni G. 2017. Urbanization development under climate change: hydrological responses in a Peri-Urban Mediterranean Catchment. Land Degrad Develop. 28(7):2207–2221. doi: 10.1002/ldr.2747.
- Kingma DP, Ba JL. 2014. Adam: a method for stochastic optimization. In: 3rd International Conference on Learning Representations, ICLR 2015 – Conference Track Proceedings. https://arxiv.org/abs/1412.6980v9.
- Konadu DD, Fosu C. 2009. Digital elevation models and GIS for watershed modelling and flood prediction – a case study of Accra Ghana. In: Yanful EK, editor, Appropriate technologies for environmental protection in the developing world: selected papers from ERTEP 2007. Ghana, Africa: Springer Netherlands. p. 325–332. doi: 10.1007/978-1-4020-9139-1_31.
- Kulkarni AJ, Satapathy SC. 2020. Optimization in machine learning and applications (pp. 51–68). Heidelberg: Springer. http://link.springer.com10.1007/978-981-15-0994-0.
- Luu C, Ha H, Bui QD, Luong ND, Khuc DT, Vu H, Nguyen DQ. 2023. Flash flood and landslide susceptibility analysis for a mountainous roadway in Vietnam using spatial modeling. Quat Sci Adv. 11:100083. doi: 10.1016/j.qsa.2023.100083.
- Ma M, Zhao G, He B, Li Q, Dong H, Wang S, Wang Z. 2021. XGBoost-based method for flash flood risk assessment. J Hydrol. 598:126382. doi: 10.1016/j.jhydrol.2021.126382.
- Madsen K, Nielsen HB, Tingleff O. 2004. Methods for non-linear least squares problems.
- Malik S, Pal SC. 2021. Potential flood frequency analysis and susceptibility mapping using CMIP5 of MIROC5 and HEC-RAS model: a case study of lower Dwarkeswar River, Eastern India. SN Appl Sci. 3(1):1–22. doi: 10.1007/S42452-020-04104-Z/TABLES/12.
- Malik S, Pal SC, Sattar A, Singh SK, Das B, Chakrabortty R, Mohammad P. 2020a. Trend of extreme rainfall events using suitable Global Circulation Model to combat the water logging condition in Kolkata Metropolitan Area. Urban Clim. 32:100599. doi: 10.1016/j.uclim.2020.100599.
- Malik S, Subodh Pal C, Pal SC. 2020b. Application of 2D numerical simulation for rating curve development and inundation area mapping: a case study of monsoon dominated Dwarkeswar river. Int J River Basin Manag. 19(4):553–563. doi: 10.1080/15715124.2020.1738447.
- Malik S, Chandra Pal S, Chowdhuri I, Chakrabortty R, Roy P, Das B. 2020c. Prediction of highly flood prone areas by GIS based heuristic and statistical model in a monsoon dominated region of Bengal Basin. Remote Sens Appl Soc Environ. 19:100343. doi: 10.1016/j.rsase.2020.100343.
- Manandhar B. 2010. Flood plain analysis and risk assessment of Lothar Khola, Nepal [Unpublished Ph.D. Thesis]. Nepal: Tribhuvan University.
- Meraj G, Romshoo SA, Yousuf AR, Altaf S, Altaf F. 2015. Assessing the influence of watershed characteristics on the flood vulnerability of Jhelum basin in Kashmir Himalaya. Nat Hazards. 77(1):153–175. doi: 10.1007/s11069-015-1605-1.
- Merz B, Thieken AH, Gocht M. 2007. Flood risk mapping at the local scale: concepts and challenges. Flood risk management in Europe: innovation in policy and practice, p. 231–251.
- Mirjalili S, Mirjalili SM, Lewis A. 2014. Grey wolf optimizer. Adv Eng Softw. 69:46–61. doi: 10.1016/j.advengsoft.2013.12.007.
- Nawi NM, Khan A, Rehman MZ. 2013. A new cuckoo search based Levenberg-Marquardt (CSLM) algorithm. In: International Conference on Computational Science and Its Applications, p. 438–451.
- Perucca LP, Angilieri YE. 2011. Morphometric characterization of del Molle Basin applied to the evaluation of flash floods hazard, Iglesia Department, San Juan, Argentina. Quat Int. 233(1):81–86. doi: 10.1016/j.quaint.2010.08.007.
- Pham BT, Phong TV, Nguyen HD, Qi C, Al-Ansari N, Amini A, Ho LS, Tuyen TT, Yen HPH, Ly H-B, et al. 2020a. A comparative study of Kernel logistic regression, radial basis function classifier, multinomial Naïve Bayes, and logistic model tree for flash flood susceptibility mapping. Water. 12(1):239. doi: 10.3390/w12010239.
- Pham BT, Avand M, Janizadeh S, Phong Tv, Al-Ansari N, Ho LS, Das S, Le H v, Amini A, Bozchaloei SK, et al. 2020b. GIS based hybrid computational approaches for flash flood susceptibility assessment. Water. 12(3):683. doi: 10.3390/w12030683.
- Pham BT, Luu C, Phong TV, Trinh PT, Shirzadi A, Renoud S, Asadi S, Le HV, von Meding J, Clague JJ. 2021. Can deep learning algorithms outperform benchmark machine learning algorithms in flood susceptibility modeling? J Hydrol. 592:125615. doi: 10.1016/j.jhydrol.2020.125615.
- Pradhan B, Abokharima MH, Jebur MN, Tehrany MS. 2014. Land subsidence susceptibility mapping at Kinta Valley (Malaysia) using the evidential belief function model in GIS. Nat Hazards. 73(2):1019–1042. doi: 10.1007/s11069-014-1128-1.
- Qian N. 1999. On the momentum term in gradient descent learning algorithms. Neural Netw. 12(1):145–151. doi: 10.1016/s0893-6080(98)00116-6.
- Rahmati O, Pourghasemi HR, Zeinivand H. 2016. Flood susceptibility mapping using frequency ratio and weights-of-evidence models in the Golastan Province, Iran. Geocarto Int. 31(1):42–70. doi: 10.1080/10106049.2015.1041559.
- Ranjgar B, Razavi-Termeh SV, Foroughnia F, Sadeghi-Niaraki A, Perissin D. 2021. Land subsidence susceptibility mapping using persistent scatterer SAR interferometry technique and optimized hybrid machine learning algorithms. Remote Sens. 13(7):1326. doi: 10.3390/rs13071326.
- Roy P, Chandra Pal S, Chakrabortty R, Chowdhuri I, Malik S, Das B. 2020. Threats of climate and land use change on future flood susceptibility. J Cleaner Prod. 272:122757. doi: 10.1016/j.jclepro.2020.122757.
- Saleh RAA, Akay R. 2021. Artificial bee colony algorithm with directed scout. Soft Comput. 25(21):13567–13593. doi: 10.1007/S00500-021-06062-Z/TABLES/16.
- Shadmehri Toosi A, Calbimonte GH, Nouri H, Alaghmand S. 2019. River basin-scale flood hazard assessment using a modified multi-criteria decision analysis approach: a case study. J Hydrol. 574:660–671. doi: 10.1016/j.jhydrol.2019.04.072.
- Shafapour Tehrany M, Kumar L, Neamah Jebur M, Shabani F. 2019. Evaluating the application of the statistical index method in flood susceptibility mapping and its comparison with frequency ratio and logistic regression methods. Geomatics Nat Hazards Risk. 10(1):79–101. doi: 10.1080/19475705.2018.1506509.
- Tazmul Islam M, Meng Q. 2022. An exploratory study of Sentinel-1 SAR for rapid urban flood mapping on Google Earth Engine. Int J Appl Earth Obs Geoinf. 113:103002. doi: 10.1016/j.jag.2022.103002.
- Tehrany MS, Pradhan B, Jebur MN. 2013. Spatial prediction of flood susceptible areas using rule based decision tree (DT) and a novel ensemble bivariate and multivariate statistical models in GIS. J Hydrol. 504:69–79. doi: 10.1016/j.jhydrol.2013.09.034.
- Tehrany MS, Pradhan B, Jebur MN. 2015. Flood susceptibility analysis and its verification using a novel ensemble support vector machine and frequency ratio method. Stoch Environ Res Risk Assess. 29(4):1149–1165. doi: 10.1007/S00477-015-1021-9/FIGURES/9.
- Thi Thuy Linh N, Pandey M, Janizadeh S, Sankar Bhunia G, Norouzi A, Ali S, Bao Pham Q, Tran Anh D, Ahmadi K. 2022. Flood susceptibility modeling based on new hybrid intelligence model: optimization of XGboost model using GA metaheuristic algorithm. Adv Space Res. 69(9):3301–3318. doi: 10.1016/j.asr.2022.02.027.
- Tien Bui D, Pradhan B, Nampak H, Bui QT, Tran QA, Nguyen QP. 2016. Hybrid artificial intelligence approach based on neural fuzzy inference model and metaheuristic optimization for flood susceptibilitgy modeling in a high-frequency tropical cyclone area using GIS. J Hydrol. 540:317–330. doi: 10.1016/j.jhydrol.2016.06.027.
- Ullah K, Wang Y, Fang Z, Wang L, Rahman M. 2022. Multi-hazard susceptibility mapping based on Convolutional Neural Networks. Geosci Front. 13(5):101425. doi: 10.1016/j.gsf.2022.101425.
- Ullah K, Zhang J. 2020. GIS-based flood hazard mapping using relative frequency ratio method: A case study of Panjkora River Basin, eastern Hindu Kush, Pakistan. PLoS One. 15(3):e0229153. doi: 10.1371/JOURNAL.PONE.0229153.
- Vinke-de Kruijf J, Kuks SMM, Augustijn DCM. 2015. Governance in support of integrated flood risk management? The case of Romania. Environ Dev. 16:104–118. doi: 10.1016/j.envdev.2015.04.003.
- Vojtek M, Vojteková J. 2019. Flood susceptibility mapping on a national scale in Slovakia using the analytical hierarchy process. Water. 11(2):364. doi: 10.3390/w11020364.
- Wang Y, Fang Z, Hong H, Peng L. 2020. Flood susceptibility mapping using convolutional neural network frameworks. J Hydrol. 582:124482. doi: 10.1016/j.jhydrol.2019.124482.
- Wang Y, Fang Z, Hong H, Costache R, Tang X. 2021. Flood susceptibility mapping by integrating frequency ratio and index of entropy with multilayer perceptron and classification and regression tree. J Environ Manage. 289:112449. doi: 10.1016/J.JENVMAN.2021.112449.
- Wang G, Yang J, Hu Y, Li J, Yin Z. 2022. Application of a novel artificial neural network model in flood forecasting. Environ Monit Assess. 194(2):125. doi: 10.1007/s10661-022-09752-9.
- Yan Z, Zhong S, Lin L, Cui Z. 2021. Adaptive Levenberg–Marquardt algorithm: a new optimization strategy for Levenberg–Marquardt neural networks. Mathematics. 9(17):2176. doi: 10.3390/math9172176.
- Yang L, Shami A. 2020. On hyperparameter optimization of machine learning algorithms: theory and practice. Neurocomputing. 415:295–316. doi: 10.1016/j.neucom.2020.07.061.
- Zhang R, Chen Y, Zhang X, Ma Q, Ren L. 2022. Mapping homogeneous regions for flash floods using machine learning: A case study in Jiangxi province, China. Int J Appl Earth Obs Geoinf. 108:102717. doi: 10.1016/j.jag.2022.102717.
- Zhao B, Sui H, Liu J. 2023. Siam-DWENet: flood inundation detection for SAR imagery using a cross-task transfer siamese network. Int J Appl Earth Obs Geoinf. 116:103132. doi: 10.1016/j.jag.2022.103132.