
 ?Mathematical formulae have been encoded as MathML and are displayed in this HTML version using MathJax in order to improve their display. Uncheck the box to turn MathJax off. This feature requires Javascript. Click on a formula to zoom.
Abstract
This research aimed to assess landslide susceptibility in the Badakhshan province of Afghanistan, an area highly susceptible to landslides due to its complex topography and geological conditions. Three distinct machine learning (ML) models, namely the Generalized Linear Model (GLM), Maximum Entropy (ME), and Random Forest (RF), were employed to identify the key contributing factors to landslide occurrences in the study region. The dataset used in this study consisted of landslide conditioning factors and a landslide inventory map. The conditioning factors encompassed lithology, soil type, plane curvature, profile curvature, elevation, slope, aspect, precipitation, land use/land cover (LULC), distance to fault, river, road, Normalized Difference Vegetation Index (NDVI), Topographic Wetness Index (TWI), Terrain Ruggedness Index (TRI), and Standardized Precipitation Index (SPI). The landslide inventory map contained 177 landslide locations and 65 non-landslide points obtained from Google Earth. Each machine learning (ML) model was trained and implemented independently using 70% of the training data, with the results validated against the remaining 30% of the landslide inventory dataset. Ensemble results from GLM, ME, and RF were obtained using the median approach. All three models exhibited consistent performance and identified similar landslide-prone areas. Among the various factors studied, proximity to rivers emerged as the most influential factor contributing to landslides, followed by the distance to roads and slope gradient. The study revealed that the districts of Argo and Yaftali Sufla, near Faizabad, were identified as particularly susceptible to landslides, especially in the vicinity of large valleys. Out of the total study area of 3086.4 km2, ∼2162 km2 were deemed relatively safe from landslides, while 149 km2 (representing 4.8% of the study region) were identified as highly susceptible to landslides. Area Under the Receiver Operating Characteristic Curve (AUC) and Root Mean Square Error (RMSE) statistics were used to evaluate the performance of the machine learning (ML) algorithms. The RF and ME models demonstrated the highest performance levels. This research contributes to our understanding of landslide susceptibility in Badakhshan province and can aid in implementing effective landslide risk management strategies in the region.
1. Introduction
Landslides are a significant geohazard with substantial economic and environmental impacts worldwide, causing loss of life, property, and infrastructure (Juliev et al. Citation2019). Landslide susceptibility mapping (LSM) is an essential tool to assess the potential risk of landslides in different areas and to guide the development of appropriate mitigation measures (Nhu, Shirzadi, Shahabi, Chen, et al. Citation2020). In recent years, machine learning (ML) algorithms have been increasingly employed for LSM, as they can provide accurate predictions based on a range of environmental factors (Lin et al. Citation2017).
Afghanistan exhibits a diverse environment and geology resulting from the tectonic collision between Eurasia and India. This geological event has caused high-density faulting, the fracturing of rocks, sutures running through central and northeastern regions, and accompanying metamorphism (Schlagel et al. Citation2016). The country’s terrain is highly susceptible to landslides, and the spatial distribution of mass movements is mainly determined by the considerable relief and diverse rock types (Schlagel et al. Citation2016). Various parts of Afghanistan show evidence of landslides, which have had reciprocal impacts, including the damming of Lake Shewa by a rockslide in Badakhshan province (Shroder and Weihs Citation2010). On 2 May 2014, a large-scale landslide occurred in Abe Barek village, Argo district, Badakhshan province, Afghanistan, killing 300 to over 2700 people (Atefi and Miura Citation2021). Zhang et al. (Citation2015) conducted a study on the Abe Barek landslide, encompassing all districts in the Badakhshan province, to identify susceptible areas within the region. To mitigate economic and human losses from landslides, immediate recognition of landslide-prone locations is essential, necessitating an up-to-date landslide susceptibility map (Ba et al. Citation2017).
Landslides pose a significant threat to mountainous regions worldwide, leading to loss of human life, property damage, and economic crises. A range of external factors, such as heavy rainfall, earthquakes, volcanoes, and anthropogenic activities, triggers these natural hazards (Di Napoli et al. Citation2020; Nhu, Shirzadi, Shahabi, Singh, et al. Citation2020; Sahin et al. Citation2020; Atefi and Miura Citation2021; Thi Ngo et al. Citation2021). Landslide susceptibility maps can be utilized to identify the areas most susceptible to landslides, which can aid in mitigating these issues. These maps rely on various factors, such as soil type, land use, drainage, slope, altitude, and the engineering properties of the land material (Bragagnolo et al. Citation2020). These factors include lithology, lineaments, geomorphology, curvature, and slope aspect (Huang and Zhao Citation2018). Remote sensing and GIS techniques have been used in numerous studies on landslide susceptibility assessment (Hong et al. Citation2018; Arabameri, Pradhan, Rezaei, Sohrabi, et al. Citation2019; Wang, Fang, et al. Citation2020; Nhu, Hoang, et al. Citation2020; Nhu, Mohammadi, et al. Citation2020; Tang et al. Citation2020; Sahin et al. Citation2020; Pourghasemi et al. Citation2020; Gaidzik and Ramírez-Herrera Citation2021).
Numerous studies have investigated landslide susceptibility as the spatial distribution of the probability of landslide occurrence, including Ayalew et al. (Citation2004), Pham et al. (Citation2020), and Fang et al. (Citation2021). Huang, Cao, Guo, et al. (Citation2020) Compared heuristic, general statistics, and machine learning (ML) models in landslide prediction. The results obtained from this research indicated the higher performance of machine learning (ML) models compared to others. Chang et al. (Citation2020) Conducted a comparative study of supervised machine learning (ML) (SML) and unsupervised machine learning (USML) models for landslide detection based on remote sensing data. The results of this study exposed better performance of SML compared to USMl. Huang, Zhang, et al. (Citation2020) utilized a deep learning algorithm using FC-SAE to predict susceptible landslide locations. The results of this model were compared with SVM and BPNN and exhibited better performance of FC-SAE. Huang, Cao, Jiang, et al. (Citation2020) utilized the semi-supervised multiple perceptron model (SSMLP) to map susceptible areas for landslides. The results showed that SSMLP performed well and was more feasible than the traditional multiple perceptron model (MLP).
Using various models to predict landslides can help reduce damage to some extent, as Wang, Fang, et al. (Citation2020) noted. Landslide inventories and data on variables influencing landslide development can be a basis for predicting future landslides’ spatial distribution and characteristics. Predictive approaches based on past landslide events assume that future landslides will follow similar patterns to past ones (Dikshit et al. Citation2020). Depending on the available data, susceptibility models can be created to predict the likelihood of future landslides in specific locations, usually presented as susceptibility maps with different degrees of relative probability (Fang et al. Citation2020).
Novellino et al. (Citation2021) developed a novel methodology integrating machine learning (ML) Algorithms (MLAs) to assess landslide risk for slow-moving mass movements with intermittent activity. InSAR results revealed that seven out of fifteen slow-moving landslides are active and exhibit seasonal velocity patterns. These insights were used as independent variables to train three MLAs (Artificial Neural Network, Generalized Boosting Model, and Maximum Entropy) to derive the landslide hazard in the area. Based on official population and buildings census data, the risk assessment identified the highest risk areas in the crown region south of Termini village and nearby Nerano. Festa et al. (Citation2022) investigated a machine learning (ML)-based approach using the random forest (RF) technique to effectively identify high-displacement areas and classify ground motion sources in parts of northern Italy. The model demonstrated promising performance, with an overall accuracy of 0.97, a true positive rate of 0.94, and an F1 score of 0.93. The research suggests that such a transferable and automated approach could be valuable for land hazard risk management stakeholders. Zhang et al. (Citation2021) conducted a study near Wenchuan County, China, using the Stacking-InSAR method to rapidly identify potential landslides based on 40 sentinel SAR images from November 2017 to March 2019. Using the Staking-InSAR method, the research identified ∼72 active areas as potential landslide foci. Zhang et al. (Citation2022) proposed the GACOS-assisted Stacking-InSAR method for potential landslide identification in the Jinshan River Region. Stacking-InSAR and conventional TS-InSAR methods have gained attention and have been employed in wide-area potential landslide identification, with fast processing and high accuracy. However, further investigation is required to understand the differences in performance and suitability between these methods in mountainous areas.
Multiple techniques can generate susceptibility maps for various natural hazards (Michel et al. Citation2014; Hemasinghe et al. Citation2018; Wang, Feng, et al. Citation2020). Landslide susceptibility mapping can utilize diverse methods, such as expert-based direct mapping, stability analysis-based deterministic models, heuristic approaches, and probabilistic techniques (Pradhan, Sezer, et al. Citation2010). Geographical Information System (GIS) is frequently employed for landslide susceptibility evaluation, with studies presenting various analytical methods, including generalized linear model (GLM), random forest (RF) Maximum Entropy (ME), bivariate analyses, logistic regression, knowledge-based approaches, and machine learning (ML) models, such as support vector machines, fuzzy logic, artificial neural networks, decision trees, generalized additive models, AdaBoost, and random forests. While each model has distinct strengths and limitations, their integration can enhance the accuracy of landslide susceptibility assessments (Chen et al. Citation2016; Kavzoglu et al. Citation2019; Di Napoli et al. Citation2020). Machine learning (ML) algorithms and models are extensively employed to develop susceptibility maps (Pradhan Citation2013; Kavzoglu et al. Citation2014). Probabilistic and machine learning (ML) approaches offer several benefits, such as their objective statistical foundation, reproducibility, ability to quantify the contribution of factors to landslide development, and potential for continuous updates (Micheletti et al. Citation2014; Lee et al. Citation2017; Shirzadi et al. Citation2018; Kalantar et al. Citation2020).
Our research aimed to employ accurate modeling methods to identify regions prone to landslides in the study area. We employed three machine learning (ML) models, namely generalized linear model (GLM), maximum Entropy (ME), and random forest (RF), to determine the most susceptible locations of landslides. Specifically, we utilized advanced machine learning (ML) techniques, including GLM, RF, and ME, to construct maps that depict the susceptibility of the study area to landslides using remote sensing and GIS techniques. Numerous studies have underscored the significance of employing advanced models in landslide susceptibility mapping, particularly for identifying areas prone to landslides. Among these models, the Maximum Entropy (ME) and Generalized Linear Model (GLM) have emerged as exceptionally functional and efficient options. One such research conducted by Park (Citation2015) focused on evaluating the performance of the Maximum Entropy model in landslide susceptibility mapping. The results of this study demonstrated the model’s effectiveness, showing a high level of accuracy and reliability in predicting landslide-prone areas. In another study by Saha et al. (Citation2022), the researchers explored various machine-learning models, including the Generalized Linear Model (GLM) and Random Forest (RF), to identify landslide-prone regions in the Bhagirathi river basin situated in the Tehri Garhwal district of Uttarakhand, India. The findings of this research further reinforced the value of these models in accurately detecting areas susceptible to landslides.
Similarly, Kalantar et al. (Citation2020) adopted machine learning (ML) ensemble-based approaches to model landslide susceptibility in the northern region of Iran. The investigation highlighted the notable performance of the GLM and RF methods in predicting landslide-prone locations, offering essential insights for practical risk assessment and management. The significance of these provided models in landslide susceptibility mapping lies in their ability to process vast amounts of geospatial data and incorporate various influencing factors. By harnessing these models, researchers and authorities can make informed decisions to mitigate landslide risks, implement preventive measures, and safeguard vulnerable communities and infrastructures. Furthermore, the continuous improvement and validation of these models through ongoing research enhance their accuracy and applicability, strengthening the overall landslide risk assessment process.
Our research findings have the potential to make a significant contribution to the scientific community. The significance and novelty of this research lie in its pioneering effort to generate a comprehensive landslide map in the selected area, making it a groundbreaking study locally. The research addresses the crucial need for accurate landslide susceptibility assessment in a region characterized by complex topography, where landslides pose significant hazards to communities and infrastructure. The novelty of the research stems from its integration of various datasets, including landslide inventory maps and diverse environmental variables, as well as the application of different machine learning (ML) models, such as the Generalized Linear Model (GLM), Random Forest, and Maximum Entropy. This innovative approach allows for a more robust and reliable prediction of landslide-prone areas, contributing valuable insights for land use planning and risk management. Overall, the research represents a significant advancement in landslide susceptibility mapping, opening avenues for further investigations and serving as a foundational reference for future studies in the region and beyond. These landslide susceptibility maps can also aid planners and decision-makers in identifying and delineating areas vulnerable to landslides, which can inform future development initiatives, such as creating new urban areas.
2. Study area
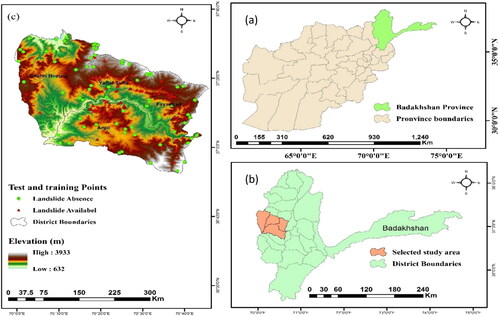
The present study focuses on a mountainous region located in the central Badakhshan province of Afghanistan, between the north latitudes 36° 52′ 29″ and 37° 34′ 19″ and the east longitudes 69° 59′ 29″ and 70° 45′ 42″. This complex topographic region ranges in elevation from 632 to 3933 m and is divided into two parts by the Kokcha River and its branches (Naseri Citation2017). The area features mountain glaciers that serve as a surface and underground water source, resulting in natural springs that supply water to the residents (Shroder and Weihs Citation2010). Mountainous conditions at higher elevations and semi-arid conditions at lower altitudes characterize the region’s climate. Most rainfall occurs in winter and spring (from December to late May). Dry weather prevails from the end of May to November. This region is one of the most landslide-prone areas in Afghanistan, with considerable evidence of landslide occurrence visible throughout the Area (Qutbudin et al. Citation2019) ().
Figure 1. (a) Indicates Afghanistan provinces and Badakhshan is highlighted, (b) indicates the map of Badakhshan province, and (c) presents the select study area and landslide inventory points.
3. Data and methodology
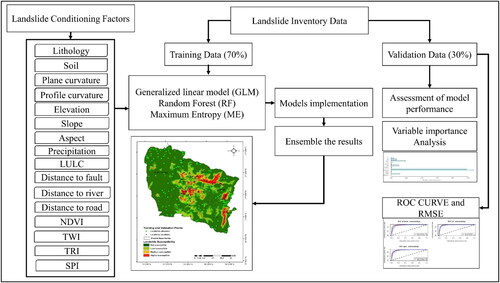
The methodology for mapping landslide-susceptible areas involves a systematic approach to data collection, preprocessing, model development, evaluation, and prediction. Firstly, relevant data are meticulously gathered, including landslide inventory maps and environmental variables, such as elevation, slope, aspect, curvature, lithology, land use, precipitation, and soil type. These data serve as crucial inputs for the subsequent analysis. The landslide inventory data is subjected to preprocessing to ensure robust model performance, including cleaning, transforming, and splitting into training and testing datasets. This step is essential to avoid overfitting and to validate the model’s generalization capabilities. Subsequently, three distinct statistical models are developed independently: the Generalized Linear Model (GLM), Random Forest, and Maximum Entropy models. Each model is trained using the training dataset, where relationships between environmental variables and landslide occurrences are learned. Following the training process, the performance of each model is assessed using key metrics, including the Receiver Operating Characteristic (ROC) Curve and Root Mean Square Error (RMSE). These evaluations provide insights into the models’ ability to discriminate between landslide-prone and non-landslide areas and their predictive accuracy. To enhance the predictive power and robustness of the results, the outputs from the three models are combined using the median method, forming an ensemble prediction. This ensemble approach leverages the strengths of each model while mitigating individual weaknesses, resulting in a more reliable and comprehensive prediction of landslide susceptibility. The results can be visualized as a map or probability distribution, providing valuable information for land management, hazard assessment, and mitigation strategies. The final result obtained from the ensemble method was further classified into four susceptible classes using the natural breaks classification technique. The natural breaks method identifies natural groupings in the data by maximizing the differences between classes while minimizing the variability within each class. This classification process allows for dividing the landslide susceptibility values into distinct and meaningful categories, ranging from low to high susceptibility. Classifying the results into four distinct classes makes the susceptibility levels easier to interpret and communicate to decision-makers, facilitating targeted land use planning and risk management strategies in the study area. The methodology workflow is provided in ().
Figure 2. Presents the workflow of the methodology.
3.1. Data
Several datasets were utilized in this study, including a landslide inventory dataset obtained from Google Earth, Landsat 8 Operational Land Imager (OLI) images acquired between 2018 and 2021 with a 15-m resolution (following image fusion), a Shuttle Radar Topography Mission (SRTM) digital elevation model, and geological and soil type data. Subsequently, these datasets were projected using the Universal Transverse Mercator (UTM) coordinate system, specifically UTM-Zone 42 with the World Geodetic System 1984 (WGS84) Datum.
3.1.1. Landslide inventory data
The landslide inventory data plays a pivotal role in identifying susceptible locations for landslides. While the study area exhibits a high frequency of landslides, the absence of GPS-recorded datasets posed a challenge in acquiring precise information. Nevertheless, a landslide inventory map was meticulously generated to overcome this limitation by integrating data from Google Earth and conducting thorough field verification by the researchers, who comprehensively understood the selected study area. The resulting dataset consists of 177 points representing landslide occurrences and 65 points denoting non-landslide locations, providing a valuable resource for landslide hazard assessment and mitigation efforts in the region.
3.1.2. Lithology
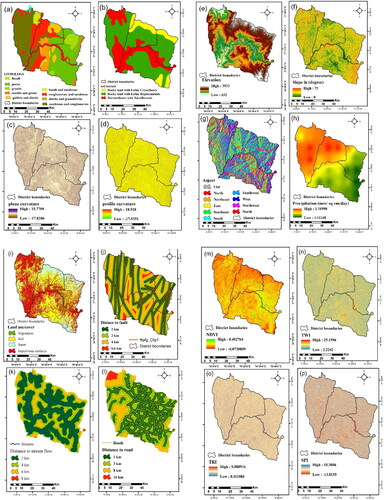
The geological composition of the study area plays a critical role in determining landslide susceptibility (Lee Citation2005). Different geological classes have varying susceptibilities to active geomorphic processes (Pradhan, Oh, et al. Citation2010). We utilized a geological map produced by the USGS at a scale of 1:850,000 to generate the lithology map for the study area ().
Figure 3. Landslide influencing factors (a) lithology, (b) soil texture, (c) plane curvature, (d) profile curvature, (e) elevation, (f) slope, (g) aspect, (h) precipitation, (i) land use, (j) distance to fault, (k) distance to stream flow, (l) distance to road, (m) NDVI, (n) TWI, (o) TRI, and (p) SPI.
3.1.3. Soil type
Numerous studies have indicated that soil plays a critical role in slope failures. The earth’s composition and the soil’s depth on a slope are essential factors in determining whether a landslide is shallow or deeply seated (Youssef et al. Citation2015; Moayedi et al. Citation2019). We utilized the USGS-created soil map of Afghanistan as the source of the soil map for our study area. The study area has three distinct soil classes, described in . The data were prepared and converted into TIF format in the ArcGIS environment before being imported into R software for predicting landslide-prone areas.
3.1.4. Profile curvature
Profile curvature, which measures the concavity or convexity of the maximum slope, usually along stream channels, was examined in this study. Depending on whether the surface is upwardly concave, linear, or convex, it can be positive, zero, or negative. Profile curvature is considered one of the most critical LCFs in landslide susceptibility prediction models since it affects water flow over the slope; the profile curvature of the research area was obtained using SRTM digital elevation model ( ) (Pourghasemi et al. Citation2012).
3.1.5. Elevation
Elevation was analyzed in this study as it can be a critical LCF since the incidence and frequency of landslides may vary with elevation, as indicated by Naseri and Kang (Citation2016). According to Delaney and Evans (Citation2011), the effects of temperature and precipitation on soil moisture commonly vary with elevation. Lower elevations are usually more suitable for road construction, which may trigger landslides in hilly or mountainous areas. The impacts of elevation on landslides will likely vary depending on the geology and region studied (Zhang et al. Citation2015). In this study, the area’s elevation ranged from 632 to 3933 meters (). The elevation model utilized in this research was obtained from the Shuttle Radar Topography Mission (SRTM) digital elevation model with a spatial resolution of 30 m.
3.1.6. Slope
Slope, which represents the expression of changes in elevation over distance and is expressed in degrees, was examined in this study. The slope map of the study area was created using SRTM 30 m resolution digital elevation model. Steeper slopes are more susceptible to landslides, making slope a vital conditioning factor in modeling landslide susceptibility, according to Lee and Sambath (Citation2006). This study used slope as continuous data (). The study area’s slope map was created using the SRTM digital elevation model.
3.1.7. Slope aspect
The slope aspect, expressed relative to north (00), measures the cardinal direction of a slope. It is associated with evapotranspiration in hilly areas, making it a critical LCF (Yilmaz et al. Citation2012). The study divided the slope aspect into nine categories: flat, north, northeast, east, southeast, south, southwest, west, and northwest (). The aspect map of the current study is prepared using SRTM digital elevation model.
3.1.8. Precipitation
The frequency of landslides is often positively linked to the amount and intensity of rainfall, but the strength of this correlation depends significantly on the region’s topography (Thanh and de Smedt Citation2012). In areas with well-drained and relatively flat terrain, rainfall may impact slope stability less than in hilly areas (Naseri and Kang Citation2016). To create a rainfall map for the study area, we utilized CHIRPS data from 1982 to 2022 with a spatial resolution of 0.05° and calculated the daily mean precipitation over 40 years ().
3.1.9. Land use and land cover
Land use land cover (LULC) is a crucial factor in slope stability (Schlagel et al. Citation2016). Vegetation-covered land regulates water flow and infiltration, while bare soil can increase the saturation of covered soil, leading to instability (Pradhan Citation2010). We used three years of Landsat 8 OLI imagery (2018–2021) averaged data with a spatial resolution of 30 m in the Google Earth Engine cloud computing platform to generate a land use and land cover map of the study area ().
3.1.10. Distance to faults
Many landslides are associated with faults due to the weaker strength of rocks along these structures (Juliev et al. Citation2019). Using the Euclidean distance tool in ArcGIS 10.8, we created a distance-to-fault layer from the geological map with values ranging from 0 to 6600 m. We classified the LCF into four groups using the natural break classification method: (1) 0–1000, (2) 1000–2000, (3) 2000–4000, and (4) 4000–6000 m ().
3.1.11. Distance to rivers
The proximity of rivers and streams is a significant factor in initiating landslides due to runoff (Nohani et al. Citation2019). distance to the river significantly influences landslide susceptibility due to the interaction between hydrological processes, soil saturation, and erosion, increasing slope instability (Hong et al. Citation2017). Using the Euclidean distance tool in the ArcGIS 10.8 environment, we generated a map of drainage proximity based on rivers and streams. This study divides the distance from the river map into five categories ().
3.1.12. Distance to road
Road construction in hilly and mountainous regions can exacerbate the likelihood of landslides by deteriorating the rock and sediment, increasing slopes, and introducing fill to the waysides (Polykretis et al. Citation2015). Such changes in topography and loss of support contribute to increased strain behind the slope and the development of cracks, leading to slope instabilities (Shahabi and Hashim Citation2015). Negative impacts, such as water infiltration, can also occur afterward, further destabilizing the slope (Arabameri, Pradhan, Rezaei, Lee, et al. Citation2020). Moreover, a road segment can act as a barrier, net source, net sink, or corridor for water flow, and depending on its location, it can serve as a source of landslides (Pourghasemi et al. Citation2012). To visualize the distance to the road, we calculate it into four categories and present it in .
3.1.13. NDVI
The normalized difference vegetation index (NDVI) is an important metric for measuring vegetation greenness and, thus, biomass. Changes in vegetated areas can lead to slope failures (Hong et al. Citation2017). We generated a time series of NDVI for three years (2018–2021) and calculated the mean NDVI map using Landsat 8 OLI sensor in the Google Earth Engine platform, following (EquationEquation 3(3)
(3) ). The NDVI map is presented in .
(1)
(1)
3.1.14. Topographic wetness index (TWI)
The topographic wetness index (TWI) measures the degree of water accumulation at a given site. As the TWI increases, so does the landslide susceptibility (Yilmaz Citation2009). Using (EquationEquation 2(2)
(2) ) in the ArcGIS environment, we calculated the TWI from the DEM, considered a contributing factor in this study ().
(2)
(2)
where α represents the total upslope area draining via the point, and tanβ is the slope angle at the point. Since groundwater flow typically follows surface topography, it impacts the spatial distribution of soil moisture.
3.1.15. Topographic ruggedness index (TRI)
Riley et al. (Citation1999) introduced the topographic ruggedness index (TRI) to quantify the variation in elevation between neighboring cells within a digital elevation model (DEM). TRI measures the disparity in elevation values between a central cell and its eight surrounding cells. The present study highlights the significance of TRI as a decisive factor in landslide initiation. TRI is calculated using (EquationEquation 3(3)
(3) ) ().
3.1.16. Stream power index (SPI)
The stream power index (SPI) measures the erosive potential of flowing water and is determined by the combination of slope gradient and catchment area (Althuwaynee et al. Citation2012). As a result, it is a strong candidate for developing models that predict landslide susceptibility (Roy et al. Citation2019). In the ArcGIS software environment, we derived the SPI from the digital elevation model (DEM) using (EquationEquation 4(4)
(4) ) and visualized the results ().
(3)
(3)
where As represents the specific catchment area, b is the slope gradient measured in degrees ().
3.2. Generalized linear model (GLM)
A generalized linear model is a statistical framework that allows for modeling response variables with non-normal error distributions by assuming a link function between the linear predictor and the response variable (Bernat Gazibara et al. Citation2023). In the case of landslide susceptibility mapping, the GLM could be used to model the relationship between landslide occurrence (binary response variable) and various environmental factors (predictors). The model can be written as:
(4)
(4)
where p is the probability of landslide occurrence, β0 is the intercept term, β1–βp are the coefficients for the predictor variables x1–xp, and logit is the link function (in this case, the logit function) that maps the linear combination of the predictor variables to the probability of landslide occurrence.
3.3. Random forest
Random forest was developed by Breiman (Citation2001) and is an ensemble machine learning (ML) technique combining multiple decision trees to improve predictive accuracy and reduce overfitting. Each tree in the forest is grown using a randomly sampled subset of the training data and a randomly selected subset of the predictor variables (Kim et al. Citation2018). The final prediction is then determined by aggregating the predictions of all the trees in the forest. In the case of landslide susceptibility mapping, a random forest model could be trained using various environmental factors as input features and landslide occurrence as the response variable (Nhu, Shirzadi, Shahabi, Chen, et al. Citation2020). The model can be written as:
(5)
(5)
where ŷ is the predicted probability of landslide occurrence for a given set of input features x, and f is the function that maps the input features to the predicted probability using the random forest algorithm.
3.4. Maximum entropy (ME)
Maximum Entropy (ME) is a machine learning (ML) technique that estimates the probability distribution of variables given a set of constraints, subject to the principle of maximum Entropy (Salvacion Citation2022). In the case of landslide susceptibility mapping, ME could be used to estimate the probability distribution of landslide occurrence given a set of environmental constraints (Golkarian and Rahmati Citation2018). The model can be written as:
(6)
(6)
Equation (8) involves known values of both Fk and fk (xi), but the virtual unknowns are the m values of β (β1, β2, … βm). The m expressions comprise mβ values, which determine the value of pi when Entropy is at its Maximum, according to Park (Citation2015). The outcomes of discrete circumstances may also be relevant to continuous situations.
4. Results and discussion
Landslides are among the most devastating natural disasters that cause significant loss of life, property, and infrastructure. The mountainous regions of Afghanistan are particularly prone to landslides due to their complex topography and geological settings. Badakhshan province is one of the areas in Afghanistan that has witnessed many landslide events, some of which have been catastrophic. In 2014, more than 300 people were killed by a landslide in the Argo district (Zhang et al. Citation2015). In this study, we aimed to identify the landslide-prone regions in the studied area using accurate modeling methods. We used three machine learning (ML) models, namely generalized linear model (GLM), maximum Entropy (ME), and random forest (RF), to identify the most critical factors contributing to landslide occurrence in the study area.
4.1. Variable contribution and models performance
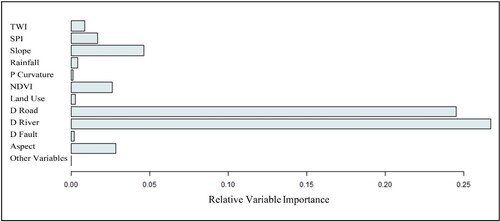
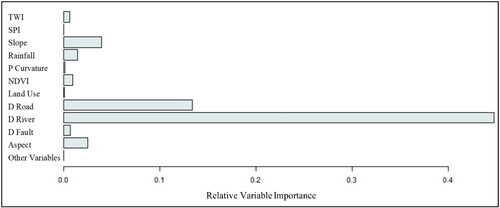
The outputs obtained from all three models showed similar performance and identified similar landslide-prone areas. The most important factor contributing to landslides in the studied area was the distance to the river, with a percentage importance of 26% in the GLM model, 45% in the ME model, and 40% in the RF model. The distance from the road was the second most crucial factor, with a percentage importance of 25% in the GLM model, 15% in the ME model, and 15% in the RF model.
The slope was identified as an essential important factor, with a percentage importance of <5%, and ranked third in the GLM model. In contrast, it was ranked third and fourth in the ME and RF models, respectively, with percentage importance of 5 and 4%. The slope direction and vegetation were less important factors, with a percentage importance of <5%, following the slope, and ranked fifth and sixth, respectively. The SPI and TWI factors had <4% importance and were followed by rainfall, land use, distance from fractures, and contour profile in terms of importance, respectively, after TWI, and were less critical. Other variables did not play a significant role in landslides in the studied area, according to the GLM output ().
Figure 4. Variable importance according to the GLM model.
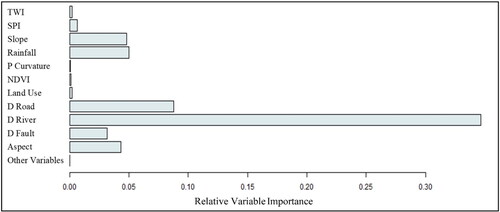
According to the ME model, the distance from the river was still the most critical landslide factor in the study area, with an importance of 45%. The section of the road was ranked second with 15% importance, followed by slope and slope direction with a percentage importance of 5 and 4%, respectively. Rainfall, NDVI, TWI, and distance from fractures were <5% important, respectively, after slope direction. The role of NDVI, SPI, and TWI was less compared to the output of the GLM model, and on the contrary, the importance of rainfall was more significant ().
Figure 5. Variable importance according to the ME model.
According to the RF model output, the role of importance and the percentage of variable sharing differed from the previous two models. The variables (distance to the river) and distance to the road were ranked first and second, respectively, with a percentage importance of 40 and 15%. Rainfall was ranked third with 7% importance, followed by slope and slope direction with a percentage importance of 5 and 4%, respectively. In this model, the distance from fractures was more critical than in the two previous models, with a significance of 4%. The role of the SPI variable with a significance of two percent in this model was more efficient than the ME model, but it was less compared to the GLM model. Other variables did not have significant importance and showed <1% importance ().
Figure 6. Variable importance according to the RF model.
The study conducted in Badakhshan province aimed to identify regions highly susceptible to landslides using accurate modeling methods due to the area’s complex topography. The outcomes obtained from the three machine learning (ML) models, namely GLM, RF, and ME, indicated that the maps of the landslide-prone areas were almost the same and showed similar performances. As a result, an ensemble map was generated to represent the areas highly prone to landslides in the studied region. The findings revealed that the Argo and Yaftali Sufla districts near Faizabad are the most susceptible to landslides, especially around large valleys. The center of the studied region, comprising the districts of Argo, Yaftali Sufla, and Faizabad, is highly prone to landslides, and the width of this area increases towards the north with the river network. The eastern parts of the Faizabad and Argo districts still pose a significant risk of landslides. On the other hand, the Shahr-e Bozorg district is less prone to landslides, with only the eastern parts showing moderate susceptibility ().
Figure 7. Obtained ensemble (median) landslide susceptibility map for the selected study area.
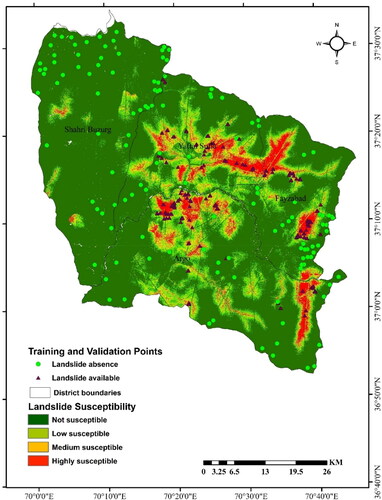
The results showed that out of the total area of 3086.4 km2, 2162 km2 are not prone to landslides. Meanwhile, 423 km2 has low sensitivity, and 252 km2 is moderately prone to landslides, accounting for 70, 14, and 11.4% of the studied area, respectively. The highly susceptible area in the study region spans 149 km2, corresponding to 4.8% of the total area of the study region ().
Table 1. Susceptible areas according to the result obtained for models.
4.2. Accuracy assessment
To assess the performance of machine learning (ML) algorithms, the AUC and RMSE statistics were utilized. The AUC results (, ) revealed notable variations in performance among the models. The RF and ME models exhibited the highest performances, with AUC values of 97.7 and 96.8%, respectively, while the GLM model had an AUC value of 95.7%. All three machine learning (ML) algorithms demonstrated acceptable performance with AUC values exceeding 95% ().
Figure 8. ROC curves for susceptibility maps produced in this research for all three models.
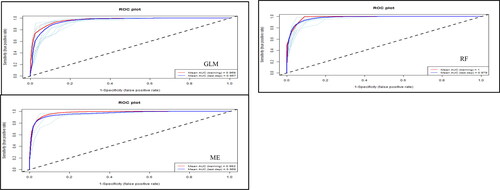
However, it should be noted that reliance on AUC alone as a performance assessment tool may only sometimes be appropriate, as high AUC values do not necessarily guarantee the high accuracy of spatial predictions, as noted by Nefeslioglu et al. (Citation2008). Therefore, RMSE was also employed as an additional criterion to evaluate model predictions and inform model selection decisions. The RMSE values for the applied machine learning (ML) algorithms ranged from 0.053 to 0.324 (), indicating a substantial level of agreement between these models and actual observations. Overall, the RF model exhibited the best performance, followed by the ME and GLM algorithms, with the former two producing significantly superior results.
Table 2. The values for the area under the Curve and RMSE were obtained for the models.
4.3. Discussion
Landslides are natural disasters that severely impact lives, property, and infrastructure. Afghanistan is particularly prone to landslides due to its complex topography and geological settings. In this study, researchers aimed to identify the most susceptible areas to landslides in Badakhshan province using accurate modeling methods. The study used three machine learning (ML) models, GLM, ME, and RF, to identify the most critical factors contributing to landslides in the study area. The study results showed that the distance to the river was the most crucial factor contributing to landslides in the studied area, followed by the distance to the road and the slope; the results are similar to the outcomes of research conducted by Kavzoglu et al. (Citation2014). The slope direction and vegetation were less critical, while the SPI and TWI factors had <4% importance. Rainfall, land use, and plane and profile curvature were less significant after TWI.
Interestingly, the role of some variables differed in the three models used. For instance, the distance to the river was still the most critical landslide factor in the study area according to the ME model, with an importance of 45%. In contrast, according to the RF model, the distance to the river and the road were the most critical factors contributing to landslides, with percentages of 40 and 15%, respectively. However, despite these differences, the maps generated by the three models were similar and showed similar performances. An ensemble map was created to represent the areas highly prone to landslides in the studied region. The results showed that out of the total area of 3086.4 km2, 2162 km2 are not prone to landslides.
Meanwhile, 423 km2 has low sensitivity, and 252 km2 is moderately prone to landslides, accounting for 70, 14, and 11.4% of the studied area, respectively. The highly susceptible area in the study region spans 149 km2, corresponding to 4.8% of the total area of the study region. The outcomes of this research are similar to previous investigations. Huang, Cao, Guo, et al. (Citation2020) conducted a comparative investigation of landslide susceptibility predictions using heuristic and machine-learning models. They employed various landslide conditioning factors (LFCs) and found that machine learning (ML) models outperformed heuristic and general statistical models. The research outcomes demonstrated the superior performance of machine learning (ML) models in this context (Huang, Cao, Jiang, et al. Citation2020). Specifically, the study utilized the semi-supervised multiple perceptron model (SSMLP) to map susceptible areas for landslides. The results showed that SSMLP performed well and was more feasible than the traditional multiple perceptron model (MLP). Another relevant study by Nhu et al. (Citation2020) integrated Support Vector Machine (SVM) models using the stacking ensemble learning technique for landslide susceptibility prediction. However, the results indicated that the stacking technique could not significantly improve the performance of SVM. These findings align with previous research by Merghadi et al. (Citation2018) and Choubin et al. (Citation2019), highlighting that ensemble models generally enhance the performance of single-based models.
Contrary to the general trend, the validation of results in this study showed that ensemble machine-learning models might not always yield good results. For instance, in the case of SVM combined with the stacking model, the ensemble approach weakened the predictive performance. Dou et al. (Citation2017) conducted a noteworthy case study focused on torrential rainfall-induced shallow landslides in the Dongjianghu Reservoir, China. The study revealed that high intensity and extended cumulative rainfall were significant triggers for shallow landslides. This case study could provide a valuable reference for efficiently producing more accurate landslide susceptibility maps (LSM). All three models exhibited accurate performance regarding the Receiver Operating Characteristic (ROC) results, as indicated by the area Under the Curve (AUC) values. These standard ensemble models demonstrated good predictive abilities for landslide susceptibility.
Moreover, the three statistical measures, sensitivity, specificity, and accuracy, indicated reasonable and satisfactory results for all models. These findings are consistent with previous studies showing that tree ensemble algorithms achieve superior results than other algorithms (Merghadi et al. Citation2020; Akinci and Zeybek Citation2021; He et al. Citation2021). The findings of this study have important implications for disaster risk reduction and management in the region. The identified landslide-prone areas can be used to inform land use planning and urban development policies, as well as to identify potential areas for evacuation plans and emergency response strategies. Furthermore, using accurate modeling methods and machine learning (ML) techniques in this study can be applied in other regions prone to landslides to help reduce the risk of such natural disasters.
5. Conclusion
This study used machine learning (ML) models to identify landslide-prone regions in Badakhshan province, Afghanistan. The models, including the generalized linear model, maximum entropy, and random forest, performed similarly and identified similar landslide-prone areas. The study revealed that distance to the river, distance from the road, and slope were the most critical factors contributing to landslides in the area.
Argo and Yaftali Sufla were the most susceptible districts near Faizabad, especially around large valleys. The center of the region, comprising Argo, Yaftali Sufla, and Faizabad, was highly prone to landslides. The eastern parts of Faizabad and Argo districts also presented a significant landslide risk. On the other hand, the Shahr-e Bozorg district was less susceptible, with only the eastern parts showing moderate susceptibility.
Out of the total area studied (3086.4 km2), 2162 km2 were not prone to landslides, while 423, 252, and 149 km2 had low, moderate, and high susceptibility, respectively. This study has important implications for regional disaster management, providing vital information for decision-makers to identify high-risk areas and prioritize mitigation efforts. The findings can be utilized to develop early warning systems, evacuation plans, and land use policies, reducing the impact of landslides in the region. Moreover, the study’s methodology can be applied to other areas to identify landslide-prone regions, contributing to a better understanding of landslide hazards worldwide. The findings regarding model performance and the influence of variables on landslide occurrence can be extended to other geographical locations that share similar topography with the research area. However, the lack of available GPS-recorded landslide inventory maps, high-resolution satellite images, aerial photos, and up-to-date soil maps represents the primary constraints of this study.
Author contributions
All authors contributed equally to this research study’s conception, design, and implementation. The data collection and analysis were carried out jointly by all authors. The manuscript was drafted by Zabihullah Nadry, Enayatullah Enayat, and Abdul Halim Majidy, with contributions from all other authors. Abdul Baser Qasimi and Vahid Issazade contributed to the machine learning (ML) modeling and provided the geographic information system (GIS) expertise and data processing. The final manuscript was reviewed and approved by all authors. All authors have read and approved the final version of the manuscript and agreed to be accountable for all aspects of the work.
Code availability statement
The codes will be available based on Request.
Acknowledgements
We the authors thank the referees for reviewing the paper.
Disclosure statement
No potential conflict of interest was reported by the author(s).
Data availability statement
Data will be available upon request.
Additional information
Funding
References
- Akinci H, Zeybek M. 2021. Comparing classical statistic and machine learning (ML) models in landslide susceptibility mapping in Ardanuc (Artvin), Turkey. Nat Hazards. 108(2):1515–1543. doi: 10.1007/s11069-021-04743-4.
- Althuwaynee OF, Pradhan B, Lee S. 2012. Application of an evidential belief function model in landslide susceptibility mapping. Comput Geosci. 44:120–135. doi: 10.1016/j.cageo.2012.03.003.
- Arabameri A, Pradhan B, Rezaei K, Lee S, Sohrabi M. 2020. An ensemble model for landslide susceptibility mapping in a forested area. Geocarto Int. 35(15):1680–1705. doi: 10.1080/10106049.2019.1585484.
- Arabameri A, Pradhan B, Rezaei K, Sohrabi M, Kalantari Z. 2019. GIS-based landslide susceptibility mapping using numerical risk factor bivariate model and its ensemble with linear multivariate regression and boosted regression tree algorithms. J Mt Sci. 16(3):595–618. doi: 10.1007/s11629-018-5168-y.
- Atefi MR, Miura H. 2021. Volumetric analysis of the landslide in Abe Barek, Afghanistan based on nonlinear mapping of stereo satellite imagery-derived DEMs. Rem Sens. 13(3):446. doi: 10.3390/rs13030446.
- Ayalew L, Yamagishi H, Ugawa N. 2004. Landslide susceptibility mapping using GIS-based weighted linear combination, the case in Tsugawa area of Agano River, Niigata Prefecture, Japan. Landslides. 1(1):73–81. doi: 10.1007/s10346-003-0006-9.
- Ba Q, Chen Y, Deng S, Wu Q, Yang J, Zhang J. 2017. An improved information value model based on gray clustering for landslide susceptibility mapping. ISPRS Int J Geo-Inform. 6(1):18. doi: 10.3390/ijgi6010018.
- Bernat Gazibara S, Sinčić M, Krkač M, Lukačić H, Mihalić Arbanas S. 2023. Landslide susceptibility assessment on a large scale in the Podsljeme area, City of Zagreb (Croatia). J Maps. 1–11. doi: 10.1080/17445647.2022.2163197.
- Bragagnolo L, da Silva RV, Grzybowski JMV. 2020. Landslide susceptibility mapping with r.landslide: a free open-source GIS-integrated tool based on artificial neural networks. Environ Modell Softw. 123:104565. doi: 10.1016/j.envsoft.2019.104565.
- Breiman L. 2001. Random forests. Mach Learn. 45(1):5–32. doi: 10.1023/A:1010933404324/METRICS.
- Chang Z, Du Z, Zhang F, Huang F, Chen J, Li W, Guo Z. 2020. Landslide susceptibility prediction based on remote sensing images and GIS: comparisons of supervised and unsupervised machine learning (ML) models. Rem Sens. 12(3):502. doi: 10.3390/rs12030502.
- Chen W, Chai H, Zhao Z, Wang Q, Hong H. 2016. Landslide susceptibility mapping based on GIS and support vector machine models for the Qianyang County, China. Environ Earth Sci. 75(6):1–13. doi: 10.1007/s12665-015-5093-0.
- Choubin B, Moradi E, Golshan M, Adamowski J, Sajedi-Hosseini F, Mosavi A. 2019. An ensemble prediction of flood susceptibility using multivariate discriminant analysis, classification and regression trees, and support vector machines. Sci Total Environ. 651:2087–2096. doi: 10.1016/j.scitotenv.2018.10.064.
- Delaney KB, Evans SG. 2011. Rockslide dams in the Northwest Himalayas (Pakistan, India) and the adjacent Pamir mountains (Afghanistan, Tajikistan), Central Asia. doi: 10.1007/978-3-642-04764-0_7.
- Di Napoli M, Carotenuto F, Cevasco A, Confuorto P, Di Martire D, Firpo M, Pepe G, Raso E, Calcaterra D. 2020. Machine learning (ML) ensemble modelling as a tool to improve landslide susceptibility mapping reliability. Landslides. 17(8):1897–1914. doi: 10.1007/s10346-020-01392-9.
- Dikshit A, Sarkar R, Pradhan B, Jena R, Drukpa D, Alamri AM. 2020. Temporal probability assessment and its use in landslide susceptibility mapping for Eastern Bhutan. Water. 12(1):267. doi: 10.3390/w12010267.
- Dou J, Yamagishi H, Xu Y, Zhu Z, Yunus AP. 2017. Characteristics of the torrential rainfall-induced shallow landslides by Typhoon Bilis, in July 2006, using remote sensing and GIS. In: Yamagishi H, Bhandary NP, editors. GIS landslide. Springer. p. 221–230. doi: 10.1007/978-4-431-54391-6_13.
- Fang Z, Wang Y, Peng L, Hong H. 2020. Integration of convolutional neural network and conventional machine learning (ML) classifiers for landslide susceptibility mapping. Comput Geosci. 139:104470. doi: 10.1016/j.cageo.2020.104470.
- Fang Z, Wang Y, Peng L, Hong H. 2021. A comparative study of heterogeneous ensemble-learning techniques for landslide susceptibility mapping. Int J Geogr Inf Sci. 35(2):321–347. doi: 10.1080/13658816.2020.1808897.
- Festa D, Casagli N, Casu F, Confuorto P, De Luca C, Del Soldato M, Lanari R, Manunta M, Manzo M, Raspini F. 2022. Automated classification of A-DInSAR-based ground deformation by using random forest. GISci Rem Sens. 59(1):1749–1766. doi: 10.1080/15481603.2022.2134561.
- Gaidzik K, Ramírez-Herrera MT. 2021. The importance of input data on landslide susceptibility mapping. Sci Rep. 11(1):19334. doi: 10.1038/s41598-021-98830-y.
- Golkarian A, Rahmati O. 2018. Use of a maximum entropy model to identify the key factors that influence groundwater availability on the Gonabad Plain, Iran. Environ Earth Sci. 77(10):369. doi: 10.1007/s12665-018-7551-y.
- He Q, Jiang Z, Wang M, Liu K. 2021. Landslide and wildfire susceptibility assessment in southeast Asia using ensemble machine learning (ML) methods. Remote Sensing. 13(8):1572. doi: 10.3390/rs13081572.
- Hemasinghe H, Rangali RSS, Deshapriya NL, Samarakoon L. 2018. Landslide susceptibility mapping using logistic regression model (a case study in Badulla District, Sri Lanka). Procedia Eng. 212:1046–1053. doi: 10.1016/j.proeng.2018.01.135.
- Hong H, Liu J, Bui DT, Pradhan B, Acharya TD, Pham BT, Zhu AX, Chen W, Ahmad BB. 2018. Landslide susceptibility mapping using J48 Decision Tree with AdaBoost, Bagging and Rotation Forest ensembles in the Guangchang area (China). Catena. 163:399–413. doi: 10.1016/j.catena.2018.01.005.
- Hong H, Pradhan B, Bui DT, Xu C, Youssef AM, Chen W. 2017. Comparison of four kernel functions used in support vector machines for landslide susceptibility mapping: a case study at Suichuan area (China). Geomatics Nat Hazards Risk. 8(2):544–569. doi: 10.1080/19475705.2016.1250112.
- Huang F, Cao Z, Guo J, Jiang SH, Li S, Guo Z. 2020. Comparisons of heuristic, general statistical and machine learning (ML) models for landslide susceptibility prediction and mapping. Catena. 191:104580. doi: 10.1016/j.catena.2020.104580.
- Huang F, Cao Z, Jiang SH, Zhou C, Huang J, Guo Z. 2020. Landslide susceptibility prediction based on a semi-supervised multiple-layer perceptron model. Landslides. 17(12):2919–2930. doi: 10.1007/s10346-020-01473-9.
- Huang F, Zhang J, Zhou C, Wang Y, Huang J, Zhu L. 2020. A deep learning algorithm using a fully connected sparse autoencoder neural network for landslide susceptibility prediction. Landslides. 17(1):217–229. doi: 10.1007/s10346-019-01274-9.
- Huang Y, Zhao L. 2018. Review on landslide susceptibility mapping using support vector machines. Catena. 165:520–529. doi: 10.1016/j.catena.2018.03.003.
- Juliev M, Mergili M, Mondal I, Nurtaev B, Pulatov A, Hübl J. 2019. Comparative analysis of statistical methods for landslide susceptibility mapping in the Bostanlik District, Uzbekistan. Sci Total Environ. 653:801–814. doi: 10.1016/j.scitotenv.2018.10.431.
- Kalantar B, Ueda N, Saeidi V, Ahmadi K, Halin AA, Shabani F. 2020. Landslide susceptibility mapping: machine and ensemble learning based on remote sensing big data. Rem Sens. 12(11):1737. doi: 10.3390/rs12111737.
- Kavzoglu T, Colkesen I, Sahin EK. 2019. Machine learning (ML) techniques in landslide susceptibility mapping: a survey and a case study. Adv Nat Technol Hazards Res. 50:283–301. doi: 10.1007/978-3-319-77377-3_13.
- Kavzoglu T, Sahin EK, Colkesen I. 2014. Landslide susceptibility mapping using GIS-based multi-criteria decision analysis, support vector machines, and logistic regression. Landslides. 11(3):425–439. doi: 10.1007/s10346-013-0391-7.
- Kim JC, Lee S, Jung HS, Lee S. 2018. Landslide susceptibility mapping using random forest and boosted tree models in Pyeong-Chang, Korea. Geocarto Int. 33(9):1000–1015. doi: 10.1080/10106049.2017.1323964.
- Lee S. 2005. Application of logistic regression model and its validation for landslide susceptibility mapping using GIS and remote sensing data. Int J Rem Sens. 26(7):1477–1491. doi: 10.1080/01431160412331331012.
- Lee S, Sambath T. 2006. Landslide susceptibility mapping in the Damrei Romel area, Cambodia using frequency ratio and logistic regression models. Environ Geol. 50(6):847–855. doi: 10.1007/s00254-006-0256-7.
- Lee S, Hong SM, Jung HS. 2017. A support vector machine for landslide susceptibility mapping in Gangwon Province, Korea. Sustainability. 9(1):48. doi: 10.3390/su9010048.
- Lin L, Lin Q, Wang Y. 2017. Landslide susceptibility mapping on a global scale using the method of logistic regression. Nat Hazards Earth Syst Sci. 17(8):1411–1424. doi: 10.5194/nhess-17-1411-2017.
- Merghadi A, Abderrahmane B, Tien Bui D. 2018. Landslide susceptibility assessment at Mila Basin (Algeria): a comparative assessment of prediction capability of advanced machine learning methods. ISP RS Int J Geo-Inf. 7(7):268. doi: 10.3390/ijgi7070268.
- Merghadi A, Yunus AP, Dou J, Whiteley J, ThaiPham B, Bui DT, Avtar R, Abderrahmane B. 2020. Machine learning (ML) methods for landslide susceptibility studies: a comparative overview of algorithm performance. Earth Sci Rev. 207:103225. doi: 10.1016/j.earscirev.2020.103225.
- Michel GP, Kobiyama M, Goerl RF. 2014. Comparative analysis of SHALSTAB and SINMAP for landslide susceptibility mapping in the Cunha River basin, southern Brazil. J Soils Sediments. 14(7):1266–1277. doi: 10.1007/s11368-014-0886-4.
- Micheletti N, Foresti L, Robert S, Leuenberger M, Pedrazzini A, Jaboyedoff M, Kanevski M. 2014. Machine learning (ML) feature selection methods for landslide susceptibility mapping. Math Geosci. 46(1):33–57. doi: 10.1007/s11004-013-9511-0.
- Moayedi H, Mehrabi M, Mosallanezhad M, Rashid ASA, Pradhan B. 2019. Modification of landslide susceptibility mapping using optimized PSO-ANN technique. Eng Comput. 35(3):967–984. doi: 10.1007/s00366-018-0644-0.
- Naseri K. 2017. Landslide-dammed mapping and logistic regression modeling using GIS and R statistical software in the Northeast Afghanistan. J Electr Eng. 4:165–172. doi: 10.17265/2328-2223/2016.04.002.
- Naseri MK, Kang D. 2016. Statistical landslide susceptibility mapping by using GIS-based weight-of-evidence (WofE) analysis in Takhar Province of Afghanistan. J Eng Tech Res. 869(1):71–75. http://www.academia.edu/download/53864417/IJETR041792.pdf.
- Nefeslioglu HA, Duman TY, Durmaz S. 2008. Landslide susceptibility mapping for a part of tectonic Kelkit Valley (Eastern Black Sea region of Turkey). Geomorphology. 94(3–4):401–418. doi: 10.1016/j.geomorph.2006.10.036.
- Nhu VH, Hoang ND, Nguyen H, Ngo PTT, Thanh Bui T, Hoa PV, Samui P, Tien Bui D. 2020. Effectiveness assessment of Keras based deep learning with different robust optimization algorithms for shallow landslide susceptibility mapping at tropical area. Catena. 188:104458. doi: 10.1016/j.catena.2020.104458.
- Nhu VH, Mohammadi A, Shahabi H, Ahmad BB, Al-Ansari N, Shirzadi A, Clague JJ, Jaafari A, Chen W, Nguyen H. 2020. Landslide susceptibility mapping using machine learning (ML) algorithms and remote sensing data in a tropical environment. Int J Environ Res Public Health. 17(14):1–23. doi: 10.3390/ijerph17144933.
- Nhu VH, Shirzadi A, Shahabi H, Chen W, Clague JJ, Geertsema M, Jaafari A, Avand M, Miraki S, Asl DT, et al. 2020. Shallow landslide susceptibility mapping by random forest base classifier and its ensembles in a semi-arid region of Iran. Forests. 11(4):421. doi: 10.3390/f11040421.
- Nhu VH, Shirzadi A, Shahabi H, Singh SK, Al-Ansari N, Clague JJ, Jaafari A, Chen W, Miraki S, Dou J, et al. 2020. Shallow landslide susceptibility mapping: a comparison between logistic model tree, logistic regression, naïve bayes tree, artificial neural network, and support vector machine algorithms. Int J Environ Res Public Health. 17(8):2749. doi: 10.3390/ijerph17082749.
- Nohani E, Moharrami M, Sharafi S, Khosravi K, Pradhan B, Pham BT, Lee S, Melesse AM. (2019). Landslide susceptibility mapping using different GIS-based bivariate models. Water. 11(7):1402. doi: 10.3390/w11071402.
- Novellino A, Cesarano M, Cappelletti P, Di Martire D, Di Napoli M, Ramondini M, Sowter A, Calcaterra D. 2021. Slow-moving landslide risk assessment combining machine learning (ML) and InSAR techniques. Catena. 203:105317. doi: 10.1016/j.catena.2021.105317.
- Park NW. 2015. Using maximum entropy modeling for landslide susceptibility mapping with multiple geoenvironmental data sets. Environ Earth Sci. 73(3):937–949. doi: 10.1007/s12665-014-3442-z.
- Pham BT, Nguyen-Thoi T, Qi C, Phong TV, Dou J, Ho LS, Le HV, Prakash I. 2020. Coupling RBF neural network with ensemble learning techniques for landslide susceptibility mapping. Catena. 195:104805. doi: 10.1016/j.catena.2020.104805.
- Polykretis C, Ferentinou M, Chalkias C. 2015. A comparative study of landslide susceptibility mapping using landslide susceptibility index and artificial neural networks in the Krios River and Krathis River catchments (northern Peloponnesus, Greece). Bull Eng Geol Environ. 74(1):27–45. doi: 10.1007/s10064-014-0607-7.
- Pourghasemi HR, Kornejady A, Kerle N, Shabani F. 2020. Investigating the effects of different landslide positioning techniques, landslide partitioning approaches, and presence-absence balances on landslide susceptibility mapping. Catena. 187:104364. doi: 10.1016/j.catena.2019.104364.
- Pourghasemi HR, Mohammady M, Pradhan B. 2012. Landslide susceptibility mapping using index of Entropy and conditional probability models in GIS: Safarood Basin, Iran. Catena. 97:71–84. doi: 10.1016/j.catena.2012.05.005.
- Pradhan B. 2010. Landslide susceptibility mapping of a catchment area using frequency ratio, fuzzy logic and multivariate logistic regression approaches. J Indian Soc Rem Sens. 38(2):301–320. doi: 10.1007/s12524-010-0020-z.
- Pradhan B. 2013. A comparative study on the predictive ability of the decision tree, support vector machine and neuro-fuzzy models in landslide susceptibility mapping using GIS. Comput Geosci. 51:350–365. doi: 10.1016/j.cageo.2012.08.023.
- Pradhan B, Oh HJ, Buchroithner M. 2010. Weights-of-evidence model applied to landslide susceptibility mapping in a tropical hilly area. Geomat Nat Hazards Risk. 1(3):199–223. doi: 10.1080/19475705.2010.498151.
- Pradhan B, Sezer EA, Gokceoglu C, Buchroithner MF. 2010. Landslide susceptibility mapping by neuro-fuzzy approach in a landslide-prone area (Cameron Highlands, Malaysia). IEEE Trans Geosci Rem Sens. 48(12):4164–4177. doi: 10.1109/TGRS.2010.2050328.
- Qutbudin I, Shiru MS, Sharafati A, Ahmed K, Al-Ansari N, Yaseen ZM, Shahid S, Wang X. 2019. Seasonal drought pattern changes due to climate variability: case study in Afghanistan. Water. 11(5):1096. doi: 10.3390/w11051096.
- Riley SJ, DeGloria SD, Elliot R. 1999. Terrain_Ruggedness_Index.pdf. In. Intermt J Sci. 5:23–27.
- Roy J, Saha S, Arabameri A, Blaschke T, Bui DT. 2019. A novel ensemble approach for landslide susceptibility mapping (LSM) in Darjeeling and Kalimpong Districts, West Bengal, India. Rem Sens. 11(23):2866. doi: 10.3390/rs11232866.
- Saha S, Saha A, Hembram TK, Mandal K, Sarkar R, Bhardwaj D. 2022. Prediction of spatial landslide susceptibility applying the novel ensembles of CNN, GLM and random forest in the Indian Himalayan region. Stoch Environ Res Risk Assess. 36(10):3597–3616. doi: 10.1007/S00477-022-02212-3/METRICS.
- Sahin EK, Colkesen I, Acmali SS, Akgun A, Aydinoglu AC. 2020. Developing comprehensive geocomputation tools for landslide susceptibility mapping: LSM tool pack. Comput Geosci. 144:104592. doi: 10.1016/j.cageo.2020.104592.
- Salvacion A. 2022. Groundwater potential mapping using maximum entropy. In: Kumar P, Nigam GK, Sinha MK, Singh A, editors. Water resources management and sustainability. Singapore: Springer Nature Singapore; p. 239–256. https://www.researchgate.net/publication/342550661.
- Schlagel NA, Johnson WC, Johnson WC, Dere ALD, Dere ALD, Shroder JF, Shroder JF. 2016. Multi-criteria analysis of landslide susceptibility, Afghanistan. Poster session presented at: Geological Society of America Annual Meeting; Sep 25–29; Denver, CO. doi: 10.1130/abs/2016am-281520.
- Shahabi H, Hashim M. 2015. Landslide susceptibility mapping using GIS-based statistical models and Remote sensing data in tropical environment. Sci Rep. 5(1):1–15. doi: 10.1038/srep09899.
- Shirzadi A, Soliamani K, Habibnejhad M, Kavian A, Chapi K, Shahabi H, Chen W, Khosravi K, Pham BT, Pradhan B, et al. 2018. Novel GIS based machine learning (ML) algorithms for shallow landslide susceptibility mapping. Sensors. 18(11):3777. doi: 10.3390/s18113777.
- Shroder JF, Weihs BJ. 2010. Geomorphology of the lake Shewa Landslide Dam, Badakhshan, Afghanistan, using remote sensing data. Geogr Ann Ser A. 92(4):469–483. doi: 10.1111/j.1468-0459.2010.00408.x.
- Tang Y, Feng F, Guo Z, Feng W, Li Z, Wang J, Sun Q, Ma H, Li Y. 2020. Integrating principal component analysis with statistically-based models for analysis of causal factors and landslide susceptibility mapping: a comparative study from the loess plateau area in Shanxi (China). J Clean Prod. 277:124159. doi: 10.1016/j.jclepro.2020.124159.
- Thanh LN, de Smedt F. 2012. Application of an analytical hierarchical process approach for landslide susceptibility mapping in A Luoi district, Thua Thien Hue Province, Vietnam. Environ Earth Sci. 66(7):1739–1752. doi: 10.1007/s12665-011-1397-x.
- Thi Ngo PT, Panahi M, Khosravi K, Ghorbanzadeh O, Kariminejad N, Cerda A, Lee S. 2021. Evaluation of deep learning algorithms for national scale landslide susceptibility mapping of Iran. Geosci Front. 12(2):505–519. doi: 10.1016/j.gsf.2020.06.013.
- Wang Y, Fang Z, Wang M, Peng L, Hong H. 2020. Comparative study of landslide susceptibility mapping with different recurrent neural networks. Comput Geosci. 138:104445. doi: 10.1016/j.cageo.2020.104445.
- Wang Y, Feng L, Li S, Ren F, Du Q. 2020. A hybrid model considering spatial heterogeneity for landslide susceptibility mapping in Zhejiang Province, China. Catena. 188:104425. doi: 10.1016/j.catena.2019.104425.
- Yilmaz C, Topal T, Süzen ML. 2012. GIS-based landslide susceptibility mapping using bivariate statistical analysis in Devrek (Zonguldak-Turkey). Environ Earth Sci. 65(7):2161–2178. doi: 10.1007/s12665-011-1196-4.
- Yilmaz I. 2009. Landslide susceptibility mapping using frequency ratio, logistic regression, artificial neural networks and their comparison: a case study from Kat landslides (Tokat-Turkey). Comput Geosci. 35(6):1125–1138. doi: 10.1016/j.cageo.2008.08.007.
- Youssef AM, Pradhan B, Jebur MN, El-Harbi HM. 2015. Landslide susceptibility mapping using ensemble bivariate and multivariate statistical models in Fayfa area, Saudi Arabia. Environ Earth Sci. 73(7):3745–3761. doi: 10.1007/s12665-014-3661-3.
- Zhang C, Li Z, Yu C, Chen B, Ding M, Zhu W, Yang J, Liu Z, Peng J. 2022. An integrated framework for wide-area active landslide detection with InSAR observations and SAR pixel offsets. Landslides. 19(12):2905–2923. doi: 10.1007/s10346-022-01954-z.
- Zhang J, Gurung DR, Liu R, Murthy MSR, Su F. 2015. Abe Barek landslide and landslide susceptibility assessment in Badakhshan Province, Afghanistan. Landslides. 12(3):597–609. doi: 10.1007/s10346-015-0558-5.
- Zhang L, Dai K, Deng J, Ge D, Liang R, Li W, Xu Q. 2021. Identifying potential landslides by stacking-InSAR in southwestern China and its performance comparison with SBAS-InSAR. Rem Sens. 13(18):3662. doi: 10.3390/rs13183662.