
 ?Mathematical formulae have been encoded as MathML and are displayed in this HTML version using MathJax in order to improve their display. Uncheck the box to turn MathJax off. This feature requires Javascript. Click on a formula to zoom.
Abstract
Expanding urbanization has led to an increased risk of urban flooding, which poses a hazard to humans. Scientific assessment of urban flooding vulnerability (UFV) is essential to protect human health and reduce losses. In this study, UFV was assessed using the Analytic Hierarchy Process-Press-State-Response (AHP-PSR) model in Jining City, China. The urban flooding index (UFI) was calculated from 13 indicators. Based on the magnitude of UFI, the vulnerability was classified into five classes. Among them, the areas of very high, high, medium, low and very low vulnerability are 897.21 km2 (8.02%), 3192.14 km2 (28.53%), 2063.22 km2 (18.44%), 39773.96 km2 (35.52%) and 1060.47 km2 (9.48%), respectively. Finally, suggestions were proposed for further urban flooding management based on the results. The results of the study can provide an important reference for the government to prevent and mitigate urban flooding. Meanwhile, the modeling framework can be easily transferred to other cities, providing new ideas for UFV assessment.
1. Introduction
In recent years, urban flooding has become a frequent occurrence worldwide, especially in developing countries (Lin et al. Citation2022; Yavari et al. Citation2022; Yin et al. Citation2022). Floods have a severe impact on the residents of 188 countries around the globe (Rentschler et al. Citation2022). Since 2008, more than 20 million people have suffered annually as a result of storms and floods (Singh et al. Citation2023). Along with population congestion, traffic congestion and environmental pollution, it has become one of the major challenges facing cities around the globe (Mustafa et al. Citation2019; Francipane et al. Citation2021).
As we know, urbanization is the main trend of human social development in the future (Wang et al. Citation2023). Rapid and progressive urbanization is profoundly changing the situation of urban flooding, often with serious consequences. Many cities have experienced severe urban flooding, resulting in external features such as traffic paralysis and extensive damage to facilities (Romali and Yusop Citation2021). In 2000, nearly 17,000 telephone lines in the city of Mumbai were out of service following floods, and power supplies were cut off as a safety precaution (Mark et al. Citation2004). In November 2009, a massive urban flood swept through Jeddah, the capital of Saudi Arabia. The floods caused more than 113 deaths, many injuries and the destruction of more than 10,000 houses and industrial properties (Ahmed et al. Citation2016). On 15 July 2020, Palermo experienced a particularly severe urban flood that resulted in the flooding of several highways and underpasses and damage to many cars. People were forced to hide in their homes, schools and all economic activities were forced to close (Francipane et al. Citation2021). The human intervention within streambed increases flooding. Moreover, in urban environments the devastating effects are increased. To that end, vehicle-related flood fatalities have been occurred in urbanized watersheds (Diakakis and Deligiannakis Citation2013; Chatzichristaki et al. Citation2015). The lack of realistic and trained evacuation plans intensifies the problem. As urbanization continues to accelerate, more people will be affected by urban flooding, making it imperative to enhance regional resilience to this phenomenon for the development and construction of urban agglomerations (Mousavi et al. Citation2019; Mustafa and Szydłowski Citation2020).
Vulnerability is affected by a variety of elements and is an unstable state determined by a combination of natural, social, economic and environmental factors. Exposure reflects the degree to which a region is exposed to external pressures and is the basic premise of vulnerability (Li et al. Citation2023). Scientific assessment of urban flooding vulnerability (UFV) is an effective way to reduce losses (Xu and Ma Citation2021; Xie et al. Citation2022). A large number of studies have been conducted on urban flooding assessment, and the methods can be classified into the three categories: (1) historical disaster mathematical and statistical method, (2) hydrological-hydrodynamic model simulation method and (3) indicators system method. The historical disaster mathematical and statistical method is based on a long series of historical disaster data and uses mathematical and statistical methods to assess the vulnerability of urban flooding. However, this method is highly reliant on historical data, and fewer observations can lead to distorted assessment (Wang et al. Citation2022; Zhou et al. Citation2022). The hydrological-hydrodynamic model simulation method refers to the dynamic assessment of urban flooding under different scenarios by establishing a coupled hydrological and hydrodynamic model. However, reliable simulations always require many different kinds of information and accuracy that are not always available or easily accessible (Zhu et al. Citation2019; M Amen et al. Citation2023). Finally, the indicator system method enables to analyze the formation principle of urban flooding, construct an assessment indicator system and use different models to determine the weights of assessment indicators for comprehensive assessment of UFV. The model is widely applicable and can reflect the distribution of vulnerability in a comprehensive and macroscopic manner (Jiangzhang Citation2020; Zong Citation2020; Zhou et al. Citation2021).
At present, how to achieve sustainable management of urban flooding in the context of expanding urbanization has been a serious challenge, and there is a dearth of research on this issue. Jining City is the economic center of southwestern Shandong Province, and is experiencing high urban flooding stress. Moreover, the urban flooding is further exacerbated by urban construction and mineral mining activities (Zhou et al. Citation2022). Therefore, it is necessary to systematically analyze urban flooding in order to mitigate the negative impacts of flooding on the socio-economic structure. Shu et al. (Citation2020) introduced the STARMA model to establish a simulation system for urban flooding using real-time rainfall information and urban flooding data. Li et al. (Citation2019) proposed a Sponge City indicator restoration system based on the identification of different land types and the construction status in Jining City, using the SWMM model to analyze the control methods. Meng et al. (Citation2020) constructed an application system for monitoring urban flooding based on the information of rainfall, flooding and hydrological stations, which provides tools for the prevention of urban flooding in Jining City. For most developing countries, assessing urban flooding vulnerability with limited data is a daunting challenge (Craciun Citation2018). As historical flood data in Jining City are incomplete and difficult to obtain. Therefore, it is important to develop an assessment framework that reflects the local urban flooding situation. However, few studies have focused on the vulnerability to urban flooding in Jining City. There is an urgent need for research in this area, especially in the field of urban flooding vulnerability assessment.
In this study, UFV was assessed using the AHP-PSR model. The distribution of the vulnerability maps helps to identify vulnerable areas, which is useful for flood management. Due to the lack of previous studies on urban flooding, filling the gap in the current study will help to further understand the urban flooding in Jining City. The results of the study can provide a scientific basis for the identification and management of urban flooding in Jining City, as well as the formulation of technical measures and capacity building for disaster prevention and mitigation, which will contribute to the development of a more comprehensive flood management and mitigation plans by the relevant authorities.
2. Study area
2.1. Location
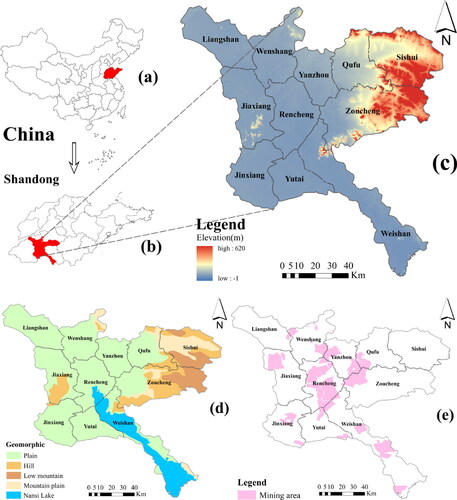
Jining City is located in the southwestern region of Shandong Province, with geographic coordinates of about 115°52′-117°36′ E and 34°26′-35°57′ N ().
Figure 1. Study area information: (a) China, (b) Shandong Province, (c) Jining City with elevation, (d) geomorphic, (e) mining area.
2.2. Geography
The study area is characterized by three main landforms, with the majority of the terrain being below 600 m in elevation. Among them, mountains cover about 14%, hills cover about 13% and the plain landform accounts for more than 60% of the total study area ().
2.3. Climate and hydrology
The study area is situated in the warm temperate monsoon climate zone of East Asia. The average annual temperature is 13.3–14.1 °C, and the average annual precipitation is around 597–820 mm (Wang and Zhu Citation2021). The rivers in the study area are radial in direction and converge from the periphery to the south-central part of the area.
2.4. Environmental issues
Large-scale coal mining began in the study area from the 1970s (). And the ground subsidence caused by coal mining has been increasing year by year (Zhou et al. Citation2022).
3. Methods
3.1. Technical route
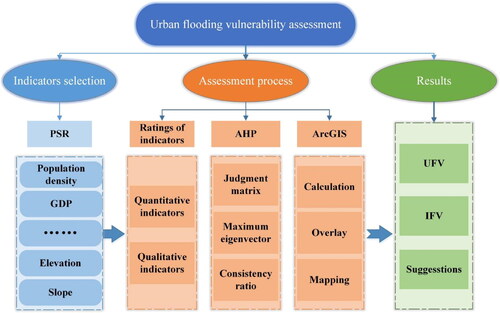
In this study, the press-state-response (PSR) model was used to select the indicators for UFV assessment, and the weights were determined using the analytic hierarchy process (AHP) model. Then the indicators were superimposed and calculated in ArcGIS 10.5, and the vulnerability maps in the study area were drawn. Finally, based on the results of the study, corresponding suggestions were made for the study area. The research process is shown in .
Figure 2. Flowchart of this study.
The data for assessment in the study area were all obtained from different sources, as shown in .
Table 1. Data sources and corresponding scales.
3.2. PSR model
The assessment indicators system used for assessing UFV is the foundation for such assessment, and a reasonable indicators system should satisfy scientificity, conciseness, hierarchy and representativeness (Zhou et al. Citation2022). The PSR model is a framework developed jointly by the Organization for Economic Cooperation and Development (OECD) and the United Nations Environment Programme (UNEP) and is a common model used in the discipline of environmental quality assessment for ecosystem health assessment (Hu et al. Citation2021). In this framework, P represents the external pressure on ecosystem health, S represents the natural state of ecosystem health and R represents the human conservation measures (Zhou Citation2022). The PSR model utilizes the cause-effect-response logic to reflect the interaction between humans and the environment, allowing for a better understanding and prevention of disasters (Huang et al. Citation2019).
3.3. AHP model
The AHP model is a multilevel weighting analysis method proposed by Saaty (Citation2003). It integrates people’s subjective judgment and objective data, and is a concise qualitative and quantitative analysis of the system (Huang et al. Citation2019). The steps to determine the weights are as follows: according to the relationship between internal indicators, the complex problem is divided into certain levels, the importance of each indicators at the same level is judged, and then, a judgment matrix is formed. The maximum eigenvector of the judgment matrix is calculated. And the random consistency ratio (CR) of the judgment matrix was tested, the calculation of CR is shown in EquationEqs. (1)(1)
(1) and Equation(2)
(2)
(2) . When CR < 0.1, the judgment matrix is considered to have passed the consistency test, i.e. the error generated by this matrix can be ignored. When CR > 0.1, the judgment matrix needs to be reconstructed. AHP model is widely used because of its systematic, hierarchical and flexible characteristics (Yu et al. Citation2022; M Amen et al. Citation2023).
(1)
(1)
(2)
(2)
where CI is the consistency indicator, λmax is the maximum eigenvalue, m is the number of indicators, CR is the consistency ratio and RI is the average random consistency indicator.
3.4. Extreme difference method
Combining different data sources into the model requires standardization of the data to ensure consistency of scales and units (Percival and Teeuw Citation2019). The indicators for this assessment can be divided into quantitative and qualitative indicators. Indicators such as population density, population growth, watershed area index, forest cover index, GDP, elevation, slope, annual average rainfall, number of rescue teams, annual average investment in drainage facilities and natural recharge of groundwater are quantitative indicator. Mining area and land use types are qualitative indicator. Quantitative indicator can be divided into positive and negative indicators. The larger the value of positive indicators, the greater the corresponding vulnerability. The larger the value of negative indicators, the smaller the corresponding vulnerability. The quantitative indicators are normalized by using the extreme difference method and are scored according to the standardized values. The normalization of the positive and negative indicators is shown in EquationEqs. (3)(3)
(3) and Equation(4)
(4)
(4) :
(3)
(3)
(4)
(4)
where X′ is the standardized value of the indicator i, X is the actual value of the indicator i and Xmax, Xmin are the maximum and minimum of the indicator i, respectively.
3.5. Spatial autocorrelation
The spatial autocorrelation method is a spatial statistical method for studying the correlation of attributes in neighboring locations, which can quantify the degree of autocorrelation of geographic variables (Luo Citation2019). Global spatial autocorrelation and local spatial autocorrelation are two important indicators of the spatial autocorrelation of a single element. Global spatial autocorrelation uses a single value to reflect the degree of regional autocorrelation, while local spatial autocorrelation reveals the degree of correlation between each unit and its neighboring units with respect to a certain attribute. The Moran’s I (Moran Citation1950) is usually calculated using EquationEq. (5)(5)
(5) :
(5)
(5)
where n is the total number of cells, Wij is the spatial weight matrix and xi, xj are the values of the attribute of cells i and j, respectively, x is the average value of the attributes of all cells.
4. Results
4.1. Rating values of indicators
The selection of vulnerability assessment indicators is an important part of urban flood analysis. To obtain reliable vulnerability maps, it is crucial to determine the assessment indicators (Gigović et al. Citation2017). In urban systems, urban flooding exhibits both natural and social attributes and is influenced by both human and natural indicators (Cui Citation2021). Based on longer field observations, experts’ opinions and previous studies (Liu et al. Citation2014; Deng Citation2022; Vaddiraju and Talari Citation2022; Senan et al. Citation2023), 13 indicators were selected as assessment indicators to reflect urban flooding in the study area (). The indicators used in this study cover a wide range of natural, social, population and economic systems and are highly relevant to local UFV issues. The results of the standardized value scores for each indicator are shown in .
Table 2. Ratings of the indicators.
Table 3. The nature and hierarchy of AHP-PSR model.
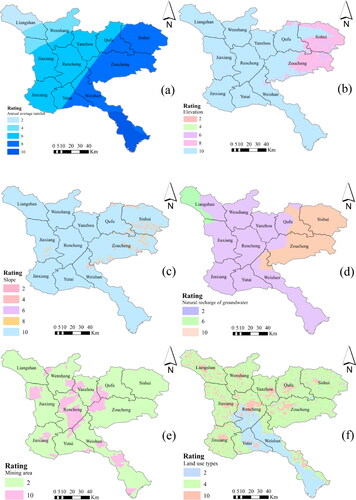
Based on previous studies, the indicators were assigned corresponding rating values (Li and Zhang Citation2008; Hu et al. Citation2021). The quantitative indicators were divided into five parts from low to high, with ratings of 2, 4, 6, 8 and 10 (Supporting Information Appendix 1). The annual average rainfall is a positive indicator, and the elevation, slope and natural recharge of groundwater are negative indicators with values of 2, 4, 6, 8 and 10 (). Mining area is divided into two classes, with values of 2 and 10 (). Land use types are divided into three classes, with values of 2, 4 and 10, respectively ().
Figure 3. Thematic maps of the indicators: (a) annual average rainfall, (b) elevation, (c) slope, (d) natural recharge of groundwater, (e) mining area, (f) land use types.
4.2. Weighting of indicators
The AHP model as an multicriteria analysis method has been used to solve various flooding problems (Abdrabo et al. Citation2023). Since the vulnerability of urban flooding is influenced by multiple indicators, and there are many interactions and nonlinearities among them (Percival and Teeuw Citation2019). For this complex multi-indicator problem, the AHP model proposes a hierarchical structure for constructing the criteria, which allows a better focus on the individual indicators when assigning weights. This study used AHP model to determine the weight of each indicator, and the weight is shown in . The CR value is satisfied with the consistency requirement (CR < 0.1), indicating reasonable results (Saaty Citation2003). The AHP model provides an effective decision-making tool for dealing with unstructured problems that can be used within a simpler and more effective framework to help decision makers find the fit for their needs and problem decisions.
4.3. Urban flooding vulnerability
After determining the rating and weight of the indicators, the urban flooding index (UFI) was then calculated (EquationEq. (6)(6)
(6) ).
(6)
(6)
where wi is the weight of the indicator i, ri is the rating of the indicator i.
In this study, the UFI was calculated as 4.12–7.99. To classify the vulnerability levels, the natural breakpoint method was employed, resulting in five classes: very low, low, medium, high and very high vulnerability (). It can be seen from that the very high vulnerability areas are mainly distributed in the center part of the study area, including Yanzhou District, Rencheng District, Zoucheng County and Weishan County, with an area of 897.21 km2 (8.02%). The high vulnerability areas are mainly distributed in Yanzhou District, Rencheng District, Qufu County and Zoucheng County, with an area of 3192.14 km2 (28.53%). The medium vulnerability areas are mainly distributed in the south of the study area, Rencheng District and Weishan County, with an area of 2063.22 km2 (18.44%). The low vulnerability areas are mainly distributed in Jiaxiang County, Jinxiang County, Yutai County and Sishui County, with an area of 39773.96 km2 (35.52%). The very low vulnerability areas are mainly distributed in the northern part of the study area, Liangshan County and Wenshang County, with an area of 1060.47 km2 (9.48%).
Figure 4. Vulnerability maps: (a) UFV, (b) inherent flooding vulnerability (IFV).
5. Discussion
5.1. Distribution of UFV
Vulnerability map identifies the degree of vulnerability in the study area. And analyzing the distribution of indicators within the areas helps to understand the main factors influencing vulnerability (Ouma and Tateishi Citation2014). According to the UFV, the high and very high vulnerability areas are mainly distributed in Yanzhou district, Rencheng County, Qufu County and Zoucheng County, with fragmented distribution in Jiaxiang County and Weishan County, which indicates that these areas are most vulnerable to the effects of urban flooding. Urbanization has changed the subsurface conditions in urban areas, increasing the flood intensity of storms of the same intensity. Subsurface refer to the topography, vegetation, watersheds and land types of the area, which directly influence the pattern of flood formation. Two rainstorms with identical temporal and spatial distribution falling on different subsurface are completely different. This is mainly reflected in the increasing area of impervious surfaces in cities, while watersheds are becoming smaller. This is consistent with previous findings that increased urban development in floodplain areas will increase the vulnerability of urban flooding (Hussein et al. Citation2020; Mustafa and Szydłowski Citation2020). In addition, there are a large number of mining zones in these areas, further exacerbating the vulnerability to urban flooding. The low vulnerability areas cover the largest area and are mainly distributed in the western and eastern parts of the study area. They are primarily characterized by cultivated land, with no mineral development activities and low human activity intensity. The rainfall in these areas is relatively low, and they have abundant forest coverage and watershed areas, enhancing the infiltration capacity of rainfall and reducing the likelihood of flooding occurrences.
5.2. Comparison the vulnerability maps
To provide a comprehensive understanding of the influence of human activities on urban flooding, natural indicators such as annual average rainfall, elevation, slope, watershed area index, forest cover index and natural recharge of groundwater were selected, and the IFV of the study area was calculated using the same method according to the weights in . The IFV was also divided into five parts ().
By comparing the UFV and IFV, a clear difference in the distribution of vulnerability distribution can be observed. Two characteristic areas were selected for comparison in this study. Area A is situated in a plain region and most of the IFV in this area mostly falls within the low vulnerability category before human development and utilization of the area. However, with the development of human society, the natural ecological environment has been negatively impacted. The increase of constructed and road areas prevents rainfall from infiltrating into the soil, which in turn leads to an increase in surface run of in the area. As a result, the vulnerability has increased, leading to high vulnerability. In Area B, UFV is mostly lower than the IFV. This is primarily due to the fact that the land here is mainly used as cultivated land and a series of drainage facilities have been constructed to mitigate urban flooding. Rainfall enters the urban drainage facilities and drains out quickly, effectively relieving the pressure of urban flooding. The above comparative analysis shows that anthropogenic modifications have a significant influence on the vulnerability of urban flooding, which is consistent with previous studies (Francipane et al. Citation2021). However, this study also identified an aspect where human activities have a positive impact on urban flood vulnerability. In areas where vulnerability is high under natural conditions, vulnerability can be reduced by reducing the intensity of human activities and increasing drainage facilities. This also suggests that it is important for policymakers and local governments to decide how to adapt cities to the current situation and plan for future development.
5.3. Single-indicator analysis
The contribution of an indicator to vulnerability is not only related to the weight but also to the rating of the indicator (Souleymane and Zhonghua Citation2017). Single-indicator analysis can contribute to a proper understanding of the main indicators affecting vulnerability by calculating the effective weights of each indicator and analyzing them statistically (EquationEq. (7)(7)
(7) ).
(7)
(7)
where Ei is the effective weight of the ith indicator, ri and wi are the rating and weight of the ith indicator, respectively, V is the vulnerability index.
The effective weight of each indicator in this study is shown in . The average effective weight of number of rescue teams, annual average rainfall and annual average investment in drainage facilities are 10.37%, 11.19% and 12.08%, respectively, indicating that these indicators have the greatest impact on urban flooding and the accuracy of these data is critical to the assessment. This is consistent with previous study that urban flooding is caused by a combination of meteorological, hydrological and human factors (Yereseme et al. Citation2022). In terms of rainfall, urbanization has changed the climate in localized urban areas, resulting in changes in urban precipitation. Studies have shown that the average temperatures in urban areas is higher than that in suburban areas, and that rainfall due to the urban heat island effect is more frequent, significantly more intense and longer in the study areas (Wang and Dong Citation2013). While urbanization promotes economic development and improves the comprehensive strength of the country, it also brings disaster-prone environments and exacerbates urban flooding. Therefore, the impact of multisource information indicators on urban flooding should be considered comprehensively in UFV assessment, while it is very important to focus on analyzing the important impact indicators.
Table 4. Effective weight of indicators in AHP-PSR model.
5.4. Spatial autocorrelation analysis
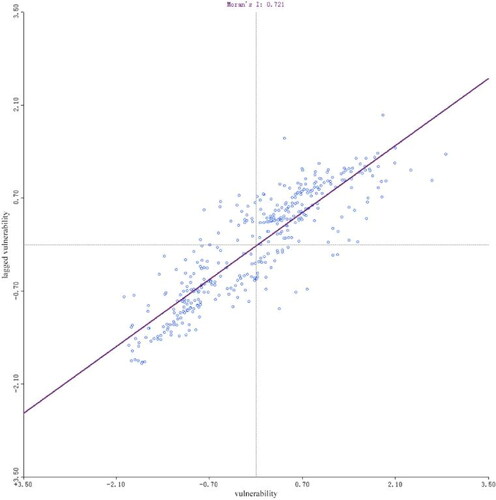
The global spatial autocorrelation Moran’s I of UFV was calculated from the UFI results, and a scatter plot of the global spatial autocorrelation Moran’s I of the study area was drawn (). The global spatial autocorrelation Moran’s I was 0.721, indicating that UFV in the study area does not occur randomly, but has a positive spatial correlation and an obvious positive clustering characteristics. The global spatial autocorrelation Moran’s I scatter plot shows that most of the points are concentrated in the first and third quadrants, indicating that areas with high vulnerability are adjacent to high vulnerability and areas with low vulnerability are adjacent to low vulnerability.
Figure 5. Moran scatter plot of spatial autocorrelation.
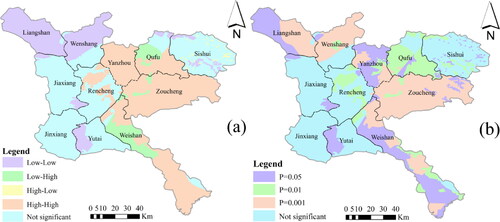
The local spatial autocorrelation analysis reveals distinct patterns of vulnerability clustering within the study area. Yanzhou District, Zoucheng County, southern Qufu County and eastern Weishan County have a high-high clustering of vulnerability. The northern part of Liangshan and Wenshang county are low-low clustering of vulnerability (). The vulnerability in these areas has positive spatial autocorrelation. The northern part of Weishan County and the northern part of Qufu County have high-low clustering and negative spatial autocorrelation of vulnerability. The vulnerability in these areas is influenced by the surrounding areas. The rest of the regions have no obvious clustering, spatial autocorrelation is not obvious, and the vulnerability is randomly distributed. That is, the vulnerability in these regions has less influence on the surrounding areas. Meanwhile, the significance of spatial statistical analysis showed that the significance level of most clustered areas was less than 0.5%, indicating that the results were credible ().
Figure 6. Spatial statistical analysis: (a) spatial clustering, (b) spatial autocorrelation significance.
5.5. Suggestions on urban flooding management
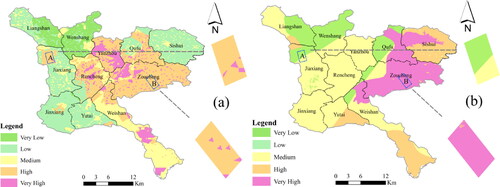
Prevention is particularly important in the face of urban flooding. Based on the results of UFV and spatial autocorrelation analysis, the study area was divided into maintenance area, key monitoring area, general treatment area and priority treatment area (). It can guide emergency planners where hazards may arise and assist in policy development. Further management recommendations are presented:
Figure 7. Urban flooding management in the study area.
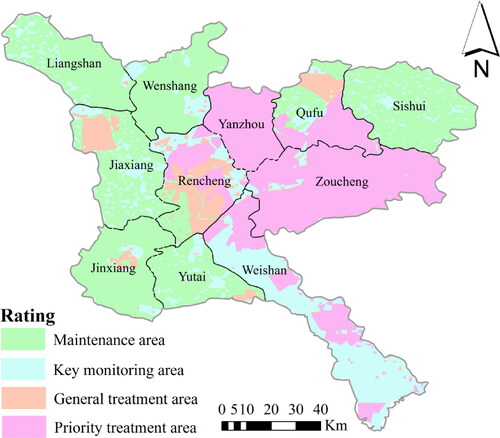
Priority treatment should be given to the priority treatment areas. Due to the high spatial autocorrelation of these areas, prioritization can improve the vulnerability of urban flooding in these areas quickly, and thus, improve the efficiency.
Strengthen monitoring and early warning of urban flooding in key monitoring area. Increase monitoring facilities and equipment for water level and rainfall in high vulnerability areas throughout the region.
Reasonable improvements and refinements should be made according to the characteristics of different land use types, thus, realizing the scientific use of land resources and reducing the UFV in the study area.
Urban planning and management should be advanced, including designing sustainable urban drainage systems, introducing integrated stormwater management, reducing the use of hard surfaces and promoting permeable materials.
6. Conclusion
In this study, the AHP-PSR model was used to classify the vulnerability to urban flooding in Jining City. The model provides a flexible and transparent approach to efficiently deal with complex multi-indicator problems. The results of the study show that the high vulnerability to urban flooding in Jining City is mainly located in the east-central part of the city, where elevations are lower and slopes are gentler. Meanwhile, the vulnerability is further exacerbated by the heat island effect and the increase in impervious surfaces brought about by urbanization. The urban flooding management map drawn in combination with spatial autocorrelation analysis can provide valuable references for urban flood management. The findings of this study can serve as a reference for urban flooding management in Jining City, while adjustments can be made in other areas based on local conditions. Considering the complexity of urban flooding, it is important to have comprehensive and detailed data to support UFV assessments. In this study, the assessment indicator system does not cover all the indicators affecting UFV. Future research should combine the actual situation of the study area as much as possible and integrate multiple data sources to get closer to the real assessment results. For multicriteria decision analysis, the determination of indicator weights is crucial. In order to further optimize the application of the AHP model in urban flooding studies, the research work can further explore how to combine it with other models.
Supplemental Material
Download MS Word (31.9 KB)Acknowledgement
The authors are grateful to the editor and reviewers for their suggestions.
Disclosure statement
The authors declare that they have no known competing financial interests or personal relationships that could have appeared to influence the work reported in this article.
Data availability statement
The data are available from the authors upon reasonable request.
Additional information
Funding
References
- Abdrabo KI, Kantoush SA, Esmaiel A, Saber M, Sumi T, Almamari M, Elboshy B, Ghoniem S. 2023. An integrated indicator-based approach for constructing an urban flood vulnerability index as an urban decision-making tool using the PCA and AHP techniques: a case study of Alexandria, Egypt. Urban Clim. 48:101426. doi: 10.1016/j.uclim.2023.101426.
- Ahmed MY, Saleh AS, Biswajeet P, Emad AA. 2016. Analysis on causes of flash flood in Jeddah city (Kingdom of Saudi Arabia) of 2009 and 2011 using multi-sensor remote sensing data and GIS. Geomatics Nat Hazards Risk. 7(3).
- Chatzichristaki C, Stefanidis S, Stefanidis P, Stathis D. 2015. Analysis of the flash flood in Rhodes Island (South Greece) on 22 November 2013. Silva. 16(1):76–86.
- Craciun I. 2018. GIS tools for quantitative flood damage assessment in data-scarce environments [PhD thesis]. Cluj-Napoca, Romania: BabesBolyai University.
- Cui H. 2021. Research and application of urban flooding risk assessment method. Jiangxi Building Materials, 11:296–298. (In Chinese).
- Deng N. 2022. Research on the index system of urban flood risk assessment and emergency response capacity evaluation [PhD dissertation]. Shenyang University of Aeronautics and Astronautics (In Chinese).
- Diakakis M, Deligiannakis G. 2013. Vehicle-related flood fatalities in Greece. Environ Hazards. 12(3–4):278–290. doi: 10.1080/17477891.2013.832651.
- Francipane A, Pumo D, Sinagra M, La Loggia G, Noto LV. 2021. A paradigm of extreme rainfall pluvial floods in complex urban areas: the flood event of 15 July 2020 in Palermo (Italy). Nat Hazards Earth Syst Sci. 21(8):2563–2580. doi: 10.5194/nhess-21-2563-2021.
- Gigović L, Pamučar D, Bajić Z, Drobnjak S. 2017. Application of GIS-interval rough AHP methodology for flood hazard mapping in urban areas. Water. 9(6):360. doi: 10.3390/w9060360.
- Hu X, Ma C, Huang P, Guo X. 2021. Ecological vulnerability assessment based on AHP-PSR method and analysis of its single parameter sensitivity and spatial autocorrelation for ecological protection – a case of Weifang County, China. Ecol Indic. 125:107464. doi: 10.1016/j.ecolind.2021.107464.
- Huang X, Li H, Zhang Y, Yang X, Chen S. 2019. Construction of a vulnerability evaluation system and vulnerability assessment of urban flooding in Xi’an based on PSR and AHP methods. J Nat Hazards. 28:167–175. (In Chinese)
- Hussein K, Alkaabi K, Ghebreyesus D, Liaqat MU, Sharif HO. 2020. Land use/land cover change along the Eastern Coast of the UAE and its impact on flooding risk. Geomatics Nat Hazards Risk. 11(1):112–130. doi: 10.1080/19475705.2019.1707718.
- Jiangzhang Z. 2020. A study on multi-scenario flooding risk assessment based on entropy empowerment and GIS [PhD dissertation]. Nanchang University. doi: 10.27232/d.cnki.gnchu.2020.002123.
- Li B, Li Y, Yu L. 2019. Analysis of index development and control methods for sponge County construction in old cities. Water Purif Technol. 38:389–395. doi: 10.15890/j.cnki.jsjs.2019.s1.099.
- Li D, He K, Sun J, Zhao Z, Hao J. 2023. Research on social vulnerability assessment from the perspective of meteorological hazard processes. J Inner Mongolia Normal Univ (Nat Sci Chin). 52:374–381. doi: 10.3969/j.issn.1001-8735.2023.04.007.
- Li L, Zhang Z. 2008. Fuzzy comprehensive evaluation of geoecological environment quality in Fuxin City. J Environ Sci Manag. 33(2):188–190.
- Lin R, Zheng F, Ma Y, Duan H, Chu S, Deng Z. 2022. Impact of spatial variation and uncertainty of rainfall intensity on urban flooding assessment. Water Resour Manage. 36(14):5655–5673. doi: 10.1007/s11269-022-03325-8.
- Liu J., 2014. Quantitative modeling and dynamic evolution of urban flood hazard vulnerability. PhD Dissertation. Harbin Institute of Technology. (In Chinese).
- Luo Q. 2019. Spatial autocorrelation of massive spatial surface data [PhD dissertation]. Wuhan University. doi: 10.27379/d.cnki.gwhdu.2019.000127.
- M Amen AR, Mustafa A, Kareem DA, Hameed HM, Mirza AA, Szydłowski M, M. Saleem BK. 2023. Mapping of flood-prone areas utilizing GIS techniques and remote sensing: a case study of Duhok, Kurdistan Region of Iraq. Remote Sens-Basel. 15(4):1102. doi: 10.3390/rs15041102.
- Mark O, Weesakul S, Apirumanekul C, Aroonnet SB, Djordjević S. 2004. Potential and limitations of 1D modelling of urban flooding. J Hydrol. 299(3–4):284–299. doi: 10.1016/j.jhydrol.2004.08.014.
- Meng C, Shi Y, Chen S. 2020. Functions and applications of urban hydrological monitoring system in Jining. Shandong Water Conservancy. 12:32–33. (In Chinese).
- Moran PAP. 1950. Notes on continuous stochastic phenomena. Biometrika J. 37(1–2):17–23.
- Mousavi SM, Roostaei S, Rostamzadeh H. 2019. Estimation of flood land use/land cover mapping by regional modelling of flood hazard at sub-basin level case study: Marand basin. Geomatics Nat Hazards Risk. 10(1):1155–1175. doi: 10.1080/19475705.2018.1549112.
- Mustafa A, Muhammed H, Szydłowski M. 2019. Extreme rainfalls as a cause of urban flash floods; A case study of the Erbil-Kurdistan Region of Iraq. Acta Sci Pol. 18(3):113–132. doi: 10.15576/ASP.FC/2019.18.3.113.
- Mustafa A, Szydłowski M. 2020. The impact of spatiotemporal changes in land development (1984–2019) on the increase in the runoff coefficient in Erbil, Kurdistan Region of Iraq. Remote Sens-Basel. 12(8):1302. doi: 10.3390/rs12081302.
- Ouma Y, Tateishi R. 2014. Urban flood vulnerability and risk mapping using integrated multi-parametric AHP and GIS: methodological overview and case study assessment. Water. 6(6):1515–1545. doi: 10.3390/w6061515.
- Percival S, Teeuw R. 2019. A methodology for urban micro-scale coastal flood vulnerability and risk assessment and mapping. Nat Hazards. 97(1):355–377. doi: 10.1007/s11069-019-03648-7.
- Rentschler J, Salhab M, Jafino BA. 2022. Flood exposure and poverty in 188 countries. Nat Commun. 13(1). doi: 10.1038/s41467-022-30727-4.
- Romali NS, Yusop Z. 2021. Flood damage and risk assessment for urban area in Malaysia. Hydrol Res. 52(1):142–159. doi: 10.2166/nh.2020.121.
- Saaty TL. 2003. Decision-making with the AHP: why is the principal eigenvector necessary. Eur J Oper Res. 145(1):85–91. doi: 10.1016/S0377-2217(02)00227-8.
- Senan CPC, Ajin RS, Danumah JH, Costache R, Arabameri A, Rajaneesh A, Sajinkumar KS, Kuriakose SL. 2023. Flood vulnerability of a few areas in the foothills of the Western Ghats: a comparison of AHP and F-AHP models. Stoch Environ Res Risk Assess. 37(2):527–556. doi: 10.1007/s00477-022-02267-2.
- Shu B, Zhao X, Li X. 2020. Simulation analysis of urban flooding in Jining based on STARMA model. Shandong Water Conservancy. 9:34–35. doi: 10.16114/j.cnki.sdsl.2020.09.018.
- Singh H, Nielsen M, Greatrex H. 2023. Causes, impacts, and mitigation strategies of urban pluvial floods in India: a systematic review. Int J Disaster Risk Sci. 93:103751. doi: 10.1016/j.ijdrr.2023.103751.
- Souleymane K, Zhonghua T. 2017. A novel method of sensitivity analysis testing by applying the DRASTIC and fuzzy optimization methods to assess groundwater vulnerability to pollution: the case of the Senegal River basin in Mali. Nat Hazards Earth Syst Sci. 17(8):1375–1392. doi: 10.5194/nhess-17-1375-2017.
- Vaddiraju SC, Talari R. 2022. Urban flood susceptibility analysis of Saroor Nagar Watershed of India using Geomatics-based multi-criteria analysis framework. Environ Sci Pollut Res. doi: 10.1007/s11356-022-24672-4.
- Wang M, Zhai Y, Wang T, Xie Y, Wang R. 2022. Flood risk evaluation based on sequential relationship-entropy right-independence right-topologizable cloud. People’s Changjiang. 53:30–35. doi: 10.16232/j.cnki.1001-4179.2022.08.005.
- Wang P, Zhu H. 2021. Analysis of temperature characteristics in Jining City in the last 50 years. Henan Sci Technol. 40:147–149. (In Chinese).
- Wang XM, Dong N. 2013. Impacts of urbanization on air temperature in Jining City. Arid Weather. 31:732–737, 743. doi: 10.11755/j.issn.1006-7639(2013)-03-0732.
- Wang Z, Xiong H, Ma C, Zhang F, Li X. 2023. Assessment of groundwater vulnerability by applying the improved DRASTIC model: a case in Guyuan City, Ningxia, China. Environ Sci Pollut Res Int. 30(20):59062–59075. doi: 10.1007/s11356-023-26763-2.
- Xie S, Liu W, Yuan Z, Zhang H, Lin H, Wang Y. 2022. Integrated risk assessment of flooding in Guangzhou based on runoff modeling, AHP, GIS and scenario analysis. Water. 14(18):2899. doi: 10.3390/w14182899.
- Xu L, Ma A. 2021. Coarse-to-fine flooding probability assessment based on remote sensing image and social media data. Geo-Spatial Inform Sci. 24(2):279–301. doi: 10.1080/10095020.2020.1812445.
- Yavari F, Salehi Neyshabouri SA, Yazdi J, Molajou A, Brysiewicz A. 2022. A novel framework for urban flood damage assessment. Water Resour Manage. 36(6):1991–2011. doi: 10.1007/s11269-022-03122-3.
- Yereseme AK, Surendra HJ, Kuntoji G. 2022. Sustainable integrated urban flood management strategies for planning of smart cities: a review. Sustain Water Resour Manag. 8(3). doi: 10.1007/s40899-022-00666-5.
- Yin C, Dai L, Xu D, Zhao Y, Zheng J, Wang P. 2022. Risk assessment of flooding in mountainous cities: the case of Guiyang County. Meteorol Hydrol Oceanogr Inst. 39:64–69. doi: 10.19441/j.cnki.issn1006-009x.2022.04.028.
- Yu H, Wu Q, Zeng Y, Zheng L, Xu L, Liu S, Wang D. 2022. Integrated variable weight model and improved DRASTIC model for groundwater vulnerability assessment in a shallow porous aquifer. J Hydrol. 608:127538. doi: 10.1016/j.jhydrol.2022.127538.
- Zhou J, Lin K, Jie X, Chen H, Gao X. 2021. Risk evaluation of flooding based on improved weighted AHP method: a case study of Haojiang District, Shantou County. People’s Pearl River. 42:20–29. (In Chinese)
- Zhou Y. 2022. Study on development boundary delineation and control of coal resource-based cities under ecosystem health orientation [PhD dissertation]. China University of Mining and Technology. doi: 10.27623/d.cnki.gzkyu.2022.001066.
- Zhou Y, Yu D, Xia J, Wang Y, Wu Y. 2022. Study on the impact of LID measures on urban flood risk based on hydrodynamic model. J Wuhan Univ (Eng Ed). 55:1090–1101. doi: 10.14188/j.1671-8844.2022-11-002.
- Zhu Z, Chen Z, Chen X, Yu G. 2019. An assessment of the hydrologic effectiveness of low impact development (LID) practices for managing runoff with different objectives. J Environ Manage. 231:504–514. doi: 10.1016/j.jenvman.2018.10.046.
- Zong W. 2020. Research on urban flooding based on PRS and SWMM model [PhD dissertation]. Donghua University of Science and Technology. doi: 10.27145/d.cnki.ghddc.2020.000116.