
 ?Mathematical formulae have been encoded as MathML and are displayed in this HTML version using MathJax in order to improve their display. Uncheck the box to turn MathJax off. This feature requires Javascript. Click on a formula to zoom.
Abstract
The identification of ecological security pattern(ESP) is of great significance in solving regional ecological security problems. The study proposes two new perspectives for the study of ESP Firstly, a new method for identifying ecological supply and demand areas based on the ratio of ecosystem service supply and demand is proposed; The second is to combine socioeconomic pathways and representative concentration pathways (SSP-RCP) scenarios to predict the future supply and demand of regional ecosystem services under different climate scenarios, and to further predict the future regional ESPs under different climate scenarios. Finally, A planning proposal based on ESP of the Yangtze River Delta(YRD) based on the supply and demand perspective was put forward, with ‘two belts-four zones’. The results show that the ESP changes significantly under different climate scenarios, and the ecological demands under the three scenarios continue to increase during the study period.
1. Introduction
Rapid urbanization has emerged as the foremost characteristic of human social development. The relentless pursuit of economic progress and alterations in land use patterns by humans can readily give rise to ecological challenges, such as soil erosion, grassland degradation, and land desertification (Cumming et al. Citation2014; Ahmad et al. Citation2020). These ecological predicaments engender an imbalance between the supply and demand of ecosystem services, exacerbating the conflicts between humans and the environment while simultaneously impeding the sustainable development of socioeconomics and directly threatening regional ecological security (Meng et al. Citation2020; Cueva et al. Citation2022; YY Sun et al. Citation2022). Consequently, attaining harmony between humans and the environment in ecologically vulnerable areas, as well as integrating the economy and ecology have become major points of research (Wang et al. Citation2022). The ecological security pattern (ESP) endeavours to satisfy the fundamental ecological requirements of humanity and optimize regional economic, social, and ecological benefits. It identifies critical points, lines, and areas that safeguard human well-being within regional ecosystems and incorporates them into spatial planning (Peng et al. Citation2017). Identification of the ESP offers effective measures to preserve the integrity and stability of ecological system structure and processes (Han et al. Citation2018). Furthermore, it can guide the high-quality development of the economy and the planning of ecological security in territorial space, which is of great significance for enhancing the ecological environment’s functions and ensuring regional sustainable development (Su et al. Citation2016, Wang and Pan, Citation2019).
At present, the basic paradigm of ‘source identification – resistance surface identification – corridor extraction – determination of the safety pattern’ has been formed for the identification of ESPs at home and abroad (Peng et al. Citation2019; T. Wang et al. Citation2021). Over the past decade, the research framework in the field of ESP has progressively matured and become more systematic (M. Zhang et al. Citation2021). The research methods have evolved from initial qualitative analysis, static evaluation, and single optimization to quantitative assessment, dynamic simulation, and comprehensive studies (Yi et al. Citation2022). Among them, ecological sources constitute the foundation of the ESP, with their identification significance in the extraction of ecologically functional land essential for maintaining regional ecological security (Gou et al. Citation2022). When delineating ecological sources, various aspects including sustainability, stability, and ecosystem integrity need to be taken into consideration. Currently, methods for identifying ecological sources can be broadly categorized into two approaches: 1) Identification is conducted within larger land segments such as woodlands, watersheds (Vergnes et al. Citation2013), and areas of natural scenic importance (J. Li et al. Citation2016). 2) This process utilizes indicators of ecosystem service importance, ecological sensitivity, and landscape connectivity (Wickham et al. Citation2010; Gao et al. Citation2021). The construction of resistance surfaces serves as a prerequisite for corridor extraction, where prevailing research has predominantly adopted the mainstream method of assigning values based on landscape types. Specifically, the comprehensive index method is layered onto the resistance factor matrix, forming the foundational resistance surface (Pierik et al. Citation2016). Moreover, recent years have witnessed a gradual integration of nocturnal lighting data and habitat quality indices to refine the resistance surface (Tong and Shi Citation2020). In terms of ecological corridor extraction, the main methods currently used to extract ecological corridors include the lowest cost path analysis (Chetkiewicz et al. Citation2006), patch gravity model (Kong et al. Citation2010), and circuit theory (Huang et al. Citation2020). However, most current research on ecological sources solely focuses on the supply aspect of ecosystem services, disregarding the interaction between ecosystems and human needs. This limitation leads to a disconnect between planning and actual demands (Zhang et al. Citation2017). Ecosystem service supply refers to the capacity to provide ecosystem products and services in specific regions (Schröter et al. Citation2012), while ecosystem service demand refers to the quantity of ecosystem services consumed or desired by human society (Burkhard et al. Citation2012). The imbalance between ecosystem supply and demand is the fundamental cause of regional ecological problems (Kroll et al. Citation2012). Urban agglomerations, as highly complex socioeconomic-natural integrated ecosystems (Gomez-Baggethun and Barton Citation2013), play a crucial role in bridging the gap between the supply and demand of ecosystem services between the socioeconomic system and the natural ecological system (Castillo-Eguskitza et al. Citation2018). China has now entered the era of urban agglomerations, with the YRD urban agglomeration leading the nation in overall development. Given that the urban agglomeration consists of multiple cities at different stages of development and possessing diverse ecological resources, the establishment of a coordinated cross-regional Ecosystem Services Paradigm (ESP) becomes crucial (Jia et al. Citation2023). However, evaluating ecosystem service supply and demand necessitates a comprehensive consideration of ecological functions, processes, social construction consumption, and other aspects, thereby providing determining guidance for ESP identification (Zhang et al. Citation2017). Based on this, this study aimed to construct an ESP that couples ecosystem service supply and demand, focusing on the identification of socio-ecological coupled ESP, and to promote the conservation and restoration of ecological networks consisting of key ecological elements across regional urban agglomerations.
Despite numerous studies on constructing the ESP, there seems to be a lack of simulation of different future scenarios of ESP (Kang et al. Citation2021). The latest generation of CMIP6 coupled global climate models incorporates Shared Socioeconomic Pathways (SSPs) and Representative Concentration Pathways (RCPs), enabling researchers to conduct comprehensive analyses of various future global climate change scenarios (Pham et al. Citation2019; Cook et al. Citation2020). Global warming, climate change, and ecological degradation have enduring impacts on altering the dynamics of natural landscapes over the long term (Lambin et al. Citation2003). Presently, research related to SSP-RCPs mainly focuses on projecting future climate change and land use modifications (Underwood et al. Citation2019; Liao et al. Citation2020; Salimi and Scholz Citation2021), assessing natural disasters and physical changes in the climate system (Rao et al. Citation2017), projecting carbon balance (Wang et al., Citation2022), and evaluating risks associated with food production and energy utilization (Hamlet et al. Citation2010; Mouratiadou et al. Citation2016; Musyoki and Ko Citation2020).
However, the role of climate change in the supply and demand of ecosystem services has not been adequately addressed in previous research. And, the existing research predominantly emphasizes incremental advancements on the supply side, lacking comprehensive predictions and integration of ecosystem service supply and demand within coupled scenarios of climate change and socioeconomic transformations necessary to support the identification of ESPs. Therefore, the aim of this study was to simulate future ESPs by predicting ecosystem service supply and demand across various scenarios, aiming to comprehend the trends in response to diverse climate change scenarios. This research will facilitate the timely development of response strategies and management measures to mitigate potential risks.
This study used ecosystem service supply and demand analysis to organically connect the two by identifying the ecological sources and ecological demand areas in the region to enhance landscape connectivity and habitat continuity. In addition, the IPCC’s proposed joint scenario framework of shared socioeconomic pathways (SSPs) and representative concentration pathways (RCPs) was used to project the future supply and demand of ecosystem services in the YRD under different climate scenarios. Through comparison with key components of the ESP landscape, putting forward ecological management planning suggestions from the perspective of proactively addressing existing risks and preventing future risks. The objectives of this study were to (1) propose a new method for identifying ecological sources based on ecosystem service supply and demand; (2) extract ecological corridors and ecological demand corridors based on circuit theory and the minimum cumulative resistance (MCR) model to construct an ESP for the YRD; (3) predict future ESPs under different climate scenarios; and (4) propose relevant planning recommendations for regional ecological management based on the multiple scenarios simulation.
2. Study area and data sources
2.1. Study area
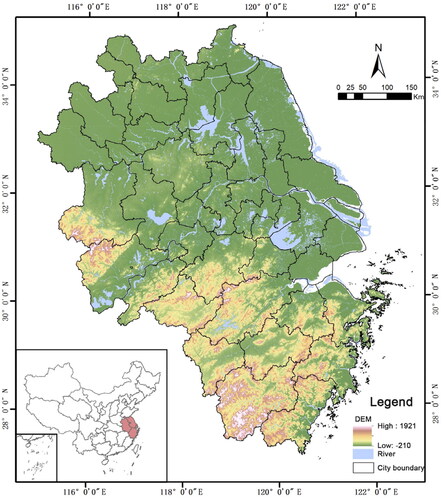
The YRD (114°50′∼122°36′E, 27°10′∼35°08′N) is situated in eastern China and encompasses the middle and lower plain of the Yangtze River. It comprises 41 prefecture-level cities in Zhejiang Province, Jiangsu Province, Anhui Province, and Shanghai, covering an area of approximately 358,000 km2, which accounts for approximately 3.67% of China’s total area (). The region experiences a temperate climate characterized as a mid-latitude East Asian monsoon climate, featuring moderate temperatures, four distinct seasons, and abundant rainfall. The terrain gradually slopes upwards from south to north, with the northern part predominantly composed of plains, while the southwestern part consists of mountains and hills. The region has complex ecosystem types, diverse land cover types, and abundant biodiversity. The YRD is home to several large cities and mega-cities. With the progress of the ‘Yangtze River Delta Integration’ and the national strategy of the ‘Belt and Road Initiative’, it has emerged as one of China’s most economically developed, densely populated, and highly urbanized regions, earning the title of China’s ‘Golden Triangle’. In 2021, the urbanization rate in the YRD reached 71.45%, accompanied by a GDP of 27.6 trillion yuan, accounting for 24.1% of the national total. Despite occupying less than 4% of the country’s land area, the region contributes nearly one-quarter of China’s economic output, showcasing a diverse hierarchical economy and strong competitiveness. However, alongside rapid economic development, the YRD has experienced a series of ecological and environmental challenges in recent years, including a significant decline in biodiversity, deterioration of water quality in rivers and lakes, and degradation of urban air quality. The process of urbanization has resulted in varying degrees of ecological space damage, with the fundamental cause lying in the spatial disparities or imbalances in the supply and demand of ecosystem services within the region (J. Wang et al. Citation2019). Against this backdrop, this study aimed to investigate the supply and demand of ecosystem services in the YRD, contributing to theoretical research on the identification of cross-regional ESPs and providing practical guidance for optimizing land use and maintaining ecological security.
Figure 1. Geographical location.
2.2. Data sources
The data in the study included land use, digital elevation models (DEMs), soils, meteorology and economic and social variables. All raster data had a uniform resolution of 1000 m × 1000 m, with a coordinate system reprojection of WGS1984_UTM_ZONE_50N and a consistent raster extent. Detailed information can be found in . The BCC-CSM2-MR model developed by the National Meteorological Centre of China was used as the data source for future climate data. The model has high accuracy in predicting variables such as temperature and precipitation and has been widely used in the Chinese region with some modelling capability (Fick and Hijmans Citation2017). Three representative concentration pathways were selected as future climate scenarios: a low-emission sustainable development pathway, a moderate-emission intermediate development pathway, and a high-emission imbalanced development pathway. The selection of these three climate scenarios aligned with the principles of ‘low-carbon’ and socioeconomic development trends.
Table 1. Data sources.
3. Methods
3.1. Ecosystem services supply and demand measurements
3.1.1. Ecosystem service supply measurement
3.1.1.1. Water yield
The water yield service was evaluated using the Water Yield module of the InVEST model (Rogelj et al. Citation2018). Based on the principle of water balance, the water provisioning quantity of a specific grid is determined as the difference between the precipitation and the actual evapotranspiration. The formula is as follows:
where Sxj is the annual water yield of j land-use types in raster x, mm; AETxj is the actual annual evaporation of j land-use types in raster cell x, mm; and Px is the annual precipitation of raster cell x, mm.
3.1.1.2. Carbon sequestration services
The carbon sequestration and oxygen release services in the YRD were estimated using the carbon sequestration module of the InVEST model. The calculation formula is as follows:
where Cabo(i), Cbel(i), Cdead(i), and 和Csoil(i) represent the aboveground carbon, belowground carbon, dead organic matter carbon, and soil carbon density of land-use type i, respectively, measured in (t·hm−2). Carboni and Areai represent the overall carbon density and corresponding area of land-use type i, respectively. Scar(i) represents the supply of carbon sequestration services provided by land-use type i, measured in metric tons (t).
3.1.1.3. Soil retention
The calculation of soil retention was performed using the Revised Universal Soil Loss Equation (RUSLE) through the InVEST model, and it is denoted as Ac (t/hm2) (JH Li et al. Citation2016). The formula is as follows:
where
is the potential soil erosion (t/hm2),
is the actual soil erosion (t/hm2),
is the rainfall erosivity factor (MJ mm hm−2) calculated from precipitation data,
is the erodibility factor (t MJ−1 mm−1) for different soil types,
and
are the slope length and slope gradient factors calculated from elevation data, respectively,
is the soil cover and human management factor, and
i s the soil and water yield measure implementation factor.
3.1.1.4. Habitat quality
Habitat quality refers to the potential capacity of an ecosystem to provide suitable conditions for species survival and is generally used to assess biodiversity (He et al. Citation2020). The habitat quality module of the InVEST model was used to evaluate the biodiversity conservation function of the YRD. The specific calculation formula is as follows:
where Qxj is the habitat quality of raster x in land use type j; Dxj is the habitat stress level of raster x in land use type j; z, k is a constant; and Hj is the habitat suitability of land use and land cover j.
3.1.2. Ecosystem service demand measurement
In this study, the ecosystem service demand index was chosen to represent the demand for ecosystem services in the study area. Based on the study by J. Wang et al. (Citation2019), the demand for ecosystem services was calculated in terms of land use, population density and GDP per land. The calculation formula is as follows.
where Li denotes the demand for ecosystem services in administrative unit i; Ci denotes the proportion of built-up land in administrative unit i, %; pi denotes the population density in administrative unit i, person-km−2; and Gdpi denotes the average land GDP in administrative unit i, (million yuan·km−2).
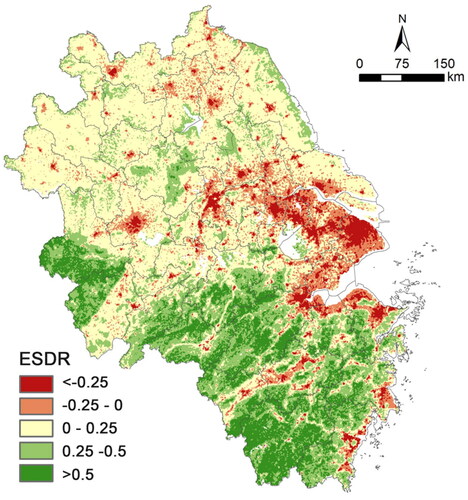
3.1.3. Ecological supply-demand ratio measurement
The ESDR (ecological supply-demand ratio) reflects the matching relationship between the supply and demand for ecosystem services, including undersupply, oversupply and equilibrium. The formula is as follows:
where Emax and Dmax are the maximum values of the supply and demand indices, respectively. Emax and Dmax are the maximum values of the supply and demand indices, respectively. ESDR > 0 means that the supply exceeds the demand, ESDR < 0 means that supply is less than the demand, and ESDR = 0 means that the supply and demand are in balance.
3.2. Identification of ecological security pattern
3.2.1. Identification of ecological sources and demand sites
Ecological security patterns are the overall health and sustainability of ecosystems and the sound ecological functions they provide. The supply and demand of ecosystem services can reflect the sustainability of regional social development to a certain extent. Therefore, we characterise the quality of the ecosystem as a whole through the supply of ecosystem services, which combined with the ESDR to determine the ecological sources, it can reveal the level of sustainability of regional ecosystem services. To do this, we selected the top 20% of areas ranked for ecosystem services as priority areas for each service (for water production services, we selected the 20% of areas with the lowest water production, i.e. those with the highest water storage). This allowed us to assess the combined level of ecosystem service supply (Peng et al. Citation2018). Next, areas with high levels of integrated supply and supply-demand ratio were overlaid. Based on relevant research results (PT Zhang et al. Citation2021) we identified ecological sources in the YRD by selecting ecological patches with an area greater than 100 km2. Similarly, we identified ecological demand areas by overlaying areas with high levels of demand for ecosystem services and integrated supply/demand ratios. We set a minimum area threshold of 60% of the total patch area and excluded patches below this threshold (Wei et al. Citation2022). The remainder represents the distribution pattern of selected ecological demand areas in the YRD.
3.2.2. Identification of ecological resistance surface
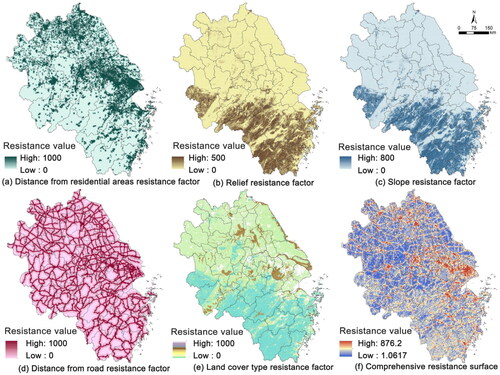
The ecological resistance surface is the basis for calculating the dispersal paths of species in the presence of overcoming resistance and was first proposed by Knaapen et al. (Citation1992). The better the ecological function of the landscape is, the less resistance there is to species migration, and vice versa. Different ecological backgrounds and topographic features have different degrees of influence on the exchange of material energy and information. Higher slope gradients and topographic relief increase the degree of obstruction to the energy flow of plants and animals in the ecosystem, thus corresponding to increased resistance. The closer the proximity to roads and settlements is, the more susceptible the ecological chain is to disturbance by human activity, thus corresponding to an increase in resistance. In this study, we chose five resistance factors, land-use type, slope, topographic relief, distance from roads and distance from settlements, to construct a comprehensive ecological resistance surface. The weights and resistance values of each resistance factor were calculated using the hierarchical analysis method and were set with reference to the literature and research result (Fang et al. Citation2020; Liu et al. Citation2020) taking into account the actual situation of the region. The results of the hierarchy of resistance factors are shown in and were tested for consistency with a test coefficient CR of 0.004 < 0.1, indicating that they passed the consistency test.
Table 2. Classification of resistance factors for ecological sources expansion.
3.2.3. Identification of ecological corridors and demand corridors
Methods for identifying ecological corridors are relatively well established, with each method based on the characteristics of the ecological corridor and using the least costly path identified as the ecological corridor. The main methods include two: one is based on the minimum cumulative resistance model (MCR) (Peng et al. Citation2019), and the other is based on the circuit theory model (McRae et al. Citation2008) using the Linkage Mapper tool in Circuitscape software for the identification of least-cost paths. The MCR model quantifies the sum of all resistances overcome by a species to reach the end point B from the ‘source’ A, and can calculate the minimum cost distance between the sources. However, the ecological corridor constructed by circuit theory is the least-cost pathway for identifying ecological sources, and there is no centroid. Circuit theory can predict the extent of ecological corridors, and can also be used to estimate the relative importance of ecological patches and corridors using current strength between sources. In this study, the Cost Path tool in ArcGIS software was used to calculate the demand corridors between each demand point A (source) and ecological source B (sink). For the inter-source corridors, the Linkage Mapper tool in the Circuitscape software eliminates the need to calculate centroid and can be used directly to predict ecological corridors.
4. Result
4.1. Spatial characteristics of supply and demand for ecosystem services in the YRD
4.1.1. Spatial characteristics of ecosystem service provision
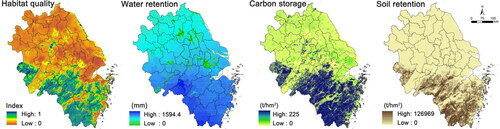
The spatial distribution of ecosystem services in the YRD in 2020 is illustrated in . The regions exhibiting high value for habitat quality services were predominantly situated in the southern and western mountainous hills of the YRD, as well as in the waters of the Yangtze River and Taihu Lake. Forestland accounted for 89.41% of the high-value areas for habitat quality in terms of land use. The relative proportion of high habitat quality areas across different land types was as follows: forestland > grassland > arable land > water bodies > unused land > construction land. Regarding water yield, the areas with high values were primarily located in southern Anhui and southwest Zhejiang. Conversely, water yield was lower in the valleys of the study area due to their flat terrain, which hampers water catchment capacity compared to the mountainous and hilly areas. Carbon sequestration services generally aligned with the distribution of woodlands in the study area, predominantly found in the southern and western hilly areas. Low-value areas were predominantly observed in built-up land and unused land regions. The average amount of carbon sequestered in the study area was 77.79 t/hm². The maximum value for soil conservation services was estimated to be 126,969 t/hm², whereas the average value was 14,681.98 t/hm², suggesting an overall low level of soil conservation services in the study area. In terms of spatial distribution, the high-value areas were primarily concentrated in Huangshan, Anhui, Lishui, Wenzhou, and Zhejiang.
Figure 2. Spatial distribution of ecosystem service provision in the Yangtze River Delta.
4.1.2. Spatial characteristics of ecosystem service demand
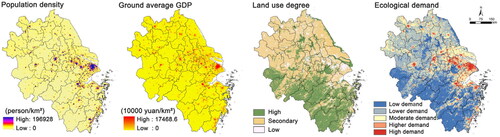
As shown in , the population density and GDP per capita in the YRD showed similar spatial distribution characteristics. The Shanghai, southern Jiangsu and northern Zhejiang regions had higher population and economic densities, with a relatively dense distribution of high-value areas. The highest average value of population density was 32,935 persons/km², while the highest value of GDP per land was 68,999,800 yuan/km², both of which were located in Hongkou District, Shanghai. The southern Anhui and Zhejiang regions, as well as the Yangtze River basin and lake areas, had a lower level of land use, consisting mainly of woodlands, grasslands and waters. Overall, the demand for ecosystem services in the YRD showed a clear clustered characteristic. The total area of high- and higher-demand areas was 31,641 km², accounting for 9.01% of the total area. These areas were mainly located in the eastern and central parts of the YRD and were dominated by construction land. From an administrative division perspective, the high-demand patches were mainly located in the cities of Shanghai, Wuxi, Suzhou, Nanjing, Hangzhou and Changzhou. Due to the high population density, high land use and better economic development in these areas, the demand for ecosystem services was correspondingly high. The low-demand areas, on the other hand, were mainly located in the southwestern and southern parts of the YRD and consisted mainly of woodlands and watersheds, concentrated in cities such as Chizhou, Huangshan, Lishui, Quzhou and Taizhou. The distribution pattern of ecological demand was basically consistent with the spatial distribution of population and built-up areas.
Figure 3. Spatial distribution of ecosystem service demand in the Yangtze River Delta.
4.2. Building ecological security patterns in the YRD
4.2.1. Identification of ecological sources and demand sites
As shown in , the total area of ecological sources in the YRD was 113,451.19 km², accounting for 32.34% of the total area of the whole region. These areas were mainly concentrated in the southwestern part of the YRD, including the mountainous hills of southern Anhui, the Dabie Mountains of western Anhui, the mountainous hills of southern Zhejiang and the hilly basin of central Zhejiang. Second, due to the numerous rivers and lakes in Jiangsu and Anhui, there were also widely distributed water-based ecological sources, such as Taihu Lake, Hongze Lake and Chaohu Lake. In addition, there were scattered patches of sourceland in the coastal wetlands of northern Jiangsu and Chuzhou in Anhui. From the perspective of administrative divisions, ecological sources were mainly located in cities such as Anqing, Chizhou, Xuancheng, Huzhou, Hangzhou, Jinhua, Shaoxing and Taizhou. From the perspective of land-use types, ecological sources were mainly forest and water areas, followed by arable land and grassland. These areas have good ecological infrastructure, can provide high-value ecosystem services, are highly sustainable, and are distributed in a concentrated manner. As ecological sources, these areas can effectively play a radiating role in promoting the flow of ecosystem services.
Figure 4. Spatial distribution of ecological source and demand sites in the Yangtze River Delta region in 2020.
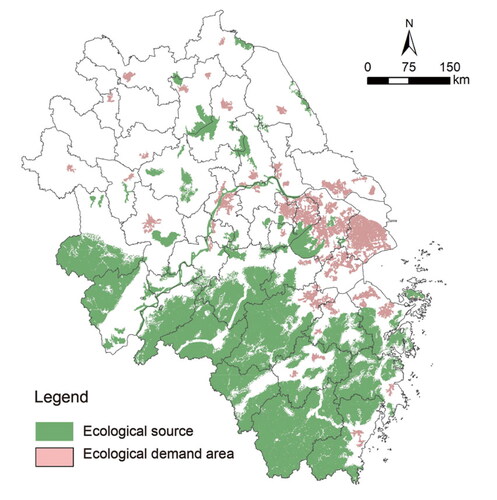
Based on the results of ecosystem service demand evaluation, combined with ESDR. We identified ecological demand sites with a total area of 18927.08 km², accounting for 5.39% of the total area of the YRD. There were 48 ecological demand sites, of which 24 were distributed in Jiangsu Province, accounting for 50% of the total. Among them, the demand patches were most densely distributed in southern Jiangsu.
4.2.2. Ecological resistance surface construction
Using ArcGIS 10.7, we weighted and superimposed the different single-factor resistance surfaces, thus calculating the integrated resistance surface of the study area. According to , the integrated resistance values in the YRD differed significantly in space, showing an overall network distribution. The areas with high resistance values were mainly located in the central urban areas of Shanghai, Suzhou and Nanjing, as well as on the main lines of the transportation network, and were far from the sources and relatively flat topography. These areas were dominated by arable land and construction land, with frequent human activities on the surface, which hinder the energy flow and species migration of various ecosystem organisms between ecological sources. Low-resistance areas, however, were mainly located in the northern part of the study area, where the population is less distributed and the terrain is flatter, such as Chuzhou and Bengbu in northern Anhui Province.
Figure 5. Single-factor resistance surface and combined resistance surface in the Yangtze River Delta.
4.2.3. Ecological corridor identification
According to , we applied circuit theory to identify a total of 57 inter-source ecological corridors in the YRD, spanning a combined length of 2179.72 km. These corridors had an average length of 38.24 km, with the longest corridor stretching 151.63 km and the shortest measuring 1.03 km. To assess the importance of these pathways, we conducted centrality analysis using the Centrality Mapper module, quantifying their contribution to landscape connectivity. The corridors were categorized into two groups: important ecological corridors and general ecological corridors. Based on quantitative characteristics, we discovered 21 important ecological corridors totalling 506.91 km, accounting for 23.64% of the overall corridor length. These corridors were characterized by shorter lengths but exhibited prominent central connectivity. Furthermore, we identified 37 general ecological corridors spanning a total length of 1672.81 km. Spatially, these corridors demonstrated a radial distribution among sources, with their density closely associated with the distribution of ecological sources. The primary ecological corridors were concentrated in the southern regions of Anhui and Jiangsu Provinces, where numerous, relatively small ecological sources existed. As a result, the corridors between these sources were densely interconnected, while corridor connectivity was lacking in the north-western and eastern regions.
Figure 6. ESP in the Yangtze River Delta region in 2020.
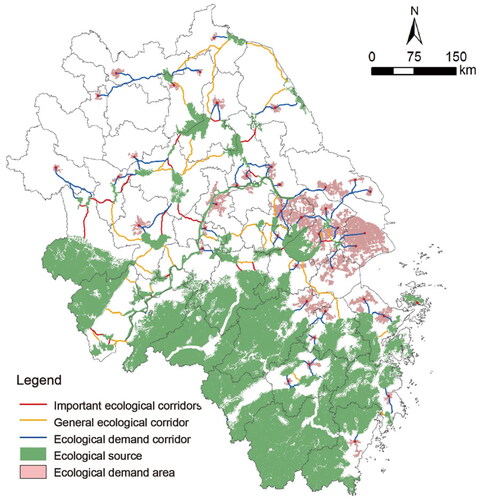
Based on the MCR model, we identified a total of 76 demand ecological corridors in the YRD, spanning a combined length of 2,148.67 km and averaging 28.27 km in length. Spatially, the demand corridors in the YRD displayed a branching pattern, and their density correlated closely with the distribution of ecological sources and demand areas. The demand corridors in the southern Jiangsu region and Shanghai exhibited higher density due to their economic development, dense population, and concentrated demand patches. Conversely, the southwestern regions of Anhui and Zhejiang had lower ecological demand, resulting in a sparser distribution of demand corridors. Demand corridors effectively connected high-demand sites with ecological sources, building a link between natural ecological space and urban demand space, thus expanding the spatial scope of ecological sources services. Inter-source corridors, serving as conduits for species migration and energy transmission, should be subject to restrictive protection policies. Furthermore, demand corridors serve as a link between town space and ecological space and should be implemented for ecological greening to ease the pressure of socioeconomic development on ecosystem needs.
4.3. Scenario projections of ecological security patterns in the YRD
4.3.1. Ecosystem services supply scenario projections
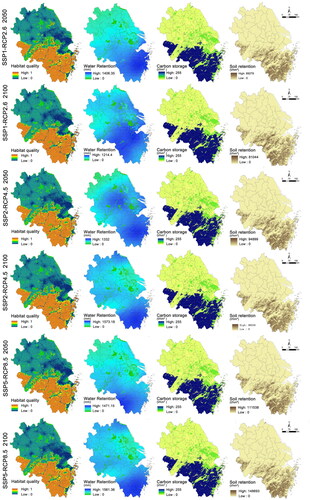
Habitat quality, water production services, carbon sequestration services and soil conservation services under the SSP1-2.6, SSP2-4.5 and SSP5-8.5 scenarios were assessed based on acquired multisource data for three different climate scenarios for 2050 and 2100 using the InVEST model. Based on , habitat quality exhibited spatial distribution patterns similar to the baseline year across diverse climate scenarios, with degraded areas primarily concentrated at the urban periphery. Notably, the SSP5-8.5 scenario demonstrated a greater extent of urban expansion than did SSP1-2.6 and SSP2-4.5, consequently leading to more pronounced habitat degradation. Furthermore, by 2100, habitat quality degradation was most apparent in the SSP1-2.6 scenario, primarily due to the substantial conversion of forests and grasslands into agricultural land during the 2050–2100 period, thus accelerating habitat quality decline. The provision of water yield exhibited significant spatial variations across different climate scenarios, and these were attributed to the influence of meteorological factors such as precipitation and evapotranspiration on water supply. Annual water yield showed notable disparities among climate scenarios, generally adhering to a spatial distribution pattern characterized by higher values in the southern regions and lower values in the northern regions. Notably, the SSP5-8.5 scenario presented the highest mean water yield in 2100. Both carbon sequestration services and soil retention services displayed spatial distribution patterns similar to the baseline year across various climate scenarios. Moreover, during the 2050–2100 timeframe, the mean values of carbon sequestration and oxygen release exhibited an upwards trend within the SSP1-2.6 and SSP2-4.5 scenarios.
Figure 7. Projected ecosystem service supply scenarios for the Yangtze River Delta region in 2050 and 2100.
4.3.2. Ecosystem services demand scenario projections
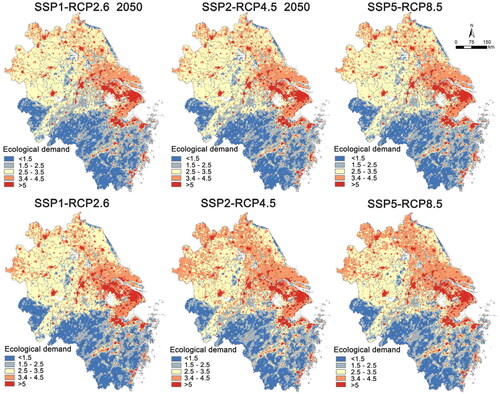
The ecological demand for the YRD in 2050 and 2100 was assessed by utilizing projected future data on population, economy, and land use under different climate scenarios (). The findings reveal a consistent increase in ecological demand across various scenarios between 2050 and 2100, expanding from the central areas of major cities towards peri-urban regions, ultimately forming contiguous zones. The peri-urban areas surrounding major cities experienced a substantial surge in ecological demand, strongly linked to the progress of urbanization and changes in land-use patterns. Notably, the SSP1-2.6 scenario exhibited the smallest average rise in the ecological demand index, with a mere 23.79% increase, while the SSP5-8.5 scenario demonstrated a higher increase of 30.40%. These results emphasize the controlling effect of the SSP1-2.6 scenario, which promotes environmentally sustainable development, on the growth of ecological demand. In terms of spatial distribution, by 2100, high-value regions with elevated ecological demand significantly expanded in northern Jiangsu and northern Anhui under all three scenarios. Additionally, in Shanghai and southern Jiangsu, the ecological demand gradually transitioned from a dispersed distribution to a contiguous one. Conversely, the hilly areas of southwestern Anhui and southern Zhejiang remained within the low-value range, experiencing a comparatively smaller increase.
Figure 8. Projected demand scenarios for ecosystem services in the Yangtze River Delta region in 2050 and 2100.
4.3.3. Scenario projections of ecological security patterns
By employing various ecological resistance factors in different scenarios, we constructed an ecological resistance surface. Subsequently, we employed circuit theory and the least-cost path model once again, incorporating the supply and demand of ecosystem services, to delineate ecological corridors and ecological demand corridors. These corridors were used to predict the ESP in the YRD under different scenarios. Analysis of reveals notable observations for the year 2100. Specifically, under the SSP1-2.6 and SSP2-4.5 climate scenarios, the area of ecological sources surpassed that of the baseline year. In contrast, the area of ecological sources continued to decline with each passing year under the SSP5-8.5 climate scenario. These findings indicate that rapid urbanization in high-pressure scenarios leads to significant shrinkage and fragmentation of vital ecological spaces within the region. Despite fluctuations in the area of ecological sources over the study period, the number of ecological corridors remained unchanged under the SSP1-2.6 and SSP2-4.5 scenarios. However, as resistance values in the ecological resistance surface increased, the number of important corridors decreased with time, directly impacting the connectivity of the ecological network. Each year, the area of low ecological demand and the number of ecological demand corridors experienced annual increases, with the most substantial increase observed under the SSP5-8.5 climate scenario. Notably, the spatial concentration of this increase in ecological demand corridor density primarily occurred in the southern Jiangsu region (). As land development approached saturation in Shanghai, Suzhou, Wuxi, and other areas, ecological demand gradually expanded towards the central and northern parts of Jiangsu. Consequently, this expansion leads to a significant enlargement in the area and number of ecological demand sites and corridors in Nantong, Bozhou, Yangzhou, and the surrounding regions.
Figure 9. Scenario projections of ESPs in the Yangtze River Delta region in 2050 and 2100.
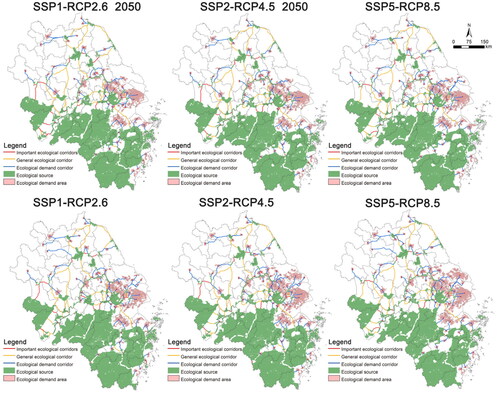
Table 3. Comparison of ESP components in the YRD under different scenarios.
5. Discussion
5.1. An approach to constructing ecological security patterns based on the supply and demand of ecosystem services
The balance between the supply and demand of ecosystem services is crucial for promoting and maintaining ecological security, serving as the foundation for achieving these goals (Zhang et al. Citation2017). The coupling and coordination of the supply and demand of ecosystem services provide a method to measure the consistency and positive interaction between the two systems. This approach reflects the transition of ecosystem services from disorder to order and indicates their sustainability (Cheng et al. Citation2019). Most previous studies focusing on ESPs or ecological networks considering the supply and demand of ecosystem services constructed supply and demand patterns separately (Hu and Chen Citation2021). For instance, Hu et al. identified supply sources by considering the most significant regions for ecosystem services and the boundaries of ecological redlines. They then constructed demand patterns by integrating various factors, including natural and economic elements. These studies utilized the theoretical framework of ‘supply-flow-demand’ to investigate the spatial optimization of ecological networks in the Xiamen-Zhangzhou-Quanzhou region. However, limited research has been conducted on the construction of the coupled supply and demand of ecosystem services using the ESP (Jiang et al. Citation2021). To address this research gap, our study integrated ecological supply services and ecological demands and incorporated the ESDR to propose a new method for identifying ecological sources (). By analysing the calculated results of ecosystem service supply and demand, we characterized the quality and sustainability of ecosystem services based on the supply of ecosystem services and the ESDR. We extracted the highest-ranking patches as preliminary identification results of ecological sources. In addition, for the identification of ecological demand places, our research identifies ecological demand areas from two perspectives. Firstly, we identify areas with high ecological demand indices, and then combine them with areas with low ESDR indices to identify ecological demand areas. This is because regions where supply does not meet demand cannot sustain stable ecological processes, even if they provide a large supply of ecosystem services. For example, we selected certain agricultural lands in the southern Jiangsu region and water areas in the Taihu Lake basin as ecological demand areas due to their proximity to urban built-up areas and high population density, which leads to a relatively high demand for ecosystem services. The rationale behind choosing the coupled supply and demand of ecosystem services to construct an ESP lies in its potential to effectively alleviate the conflicts between the supply and demand of ecosystem services, maintain regional ecological security, and ensure sustainable development.
Figure 10. Supply and demand pattern in the Yangtze River Delta region in 2020.
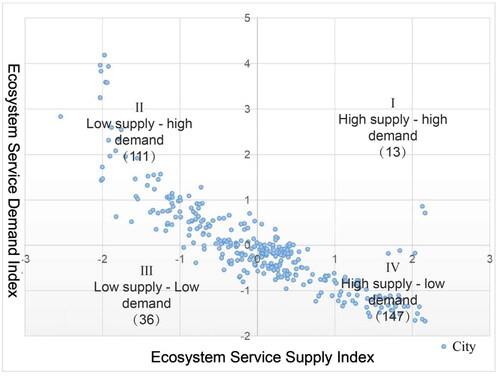
Optimal management zoning that integrates the supply and demand for ecosystem services is essential for sustainable ecosystem management and decision-making. Therefore, we standardized the Z scores of the ecosystem service supply and demand indices and illustrated the distribution of supply-demand quadrants in the YRD (). Subsequently, the urban agglomeration of the YRD was classified into four ecological zones. The findings indicated that the majority of counties (84.03% of the total) in the region fell into either high supply-low demand or low supply-high demand categories, encompassing 147 and 111 counties, respectively. Cities in the high supply-low demand category were primarily situated in the southern and western regions of the YRD urban agglomerations. These cities boasted abundant natural resources, forestry resources, and higher agricultural productivity, but their urbanization levels were relatively low. The influence of the siphonage and significant population outmigration were potential factors contributing to the reduced demand in these cities. In the low supply-high demand areas, cities such as Huaian and Suqian did not exhibit high levels of economic development or urbanization. This implies that the scarcity of ecosystem services in these areas stems not only from rapid economic growth but also from the poor ecological resource base and the mismatch between the existing population and ecological resources in the region. Consequently, even economically less-developed regions face a severe scarcity of ecosystem services. In regional planning, it is imperative to prioritize the protection of remaining ecological spaces and carefully consider the coordination between the ecosystem and socioeconomic systems. Timely resolution of the existing conflicts between ecology, population, and economic development is crucial for mitigating the scarcity of ecosystem services and gradually transitioning the region towards ecologically sustainable development.
Figure 11. Ecosystem services supply and demand quadrant by Yangtze River Delta regions and counties in 2020.
5.2. Ecological spatial pattern and optimal management strategies in the YRD
The Yangtze River Delta Urban Agglomeration Development Plan proposes the concept of building an ecological barrier through external connectivity and internal integration. The plan also advocates for enhancing interprovincial coordination and promoting coordinated ecological construction within and beyond the urban agglomeration, as well as the development of the Yangtze River Ecological Corridor. To accomplish these objectives, the plan relies on the ecological resources provided by the Yangtze-Huai Hills, Dabie Mountains, Siming Mountains, and Yandang Mountains to establish a green ecological barrier. Currently, the identified ecological barriers, namely, Anhui South-Zhejiang West-Zhejiang South and Dabie Mountains, align with the core ecological space of the region. The identified ecological corridors connect the cities along the Yangtze River, forming a continuous ecological corridor. The plan also proposes the identification of the Huai River-Hongze Lake Ecological Corridor. However, based on the identified ecological sources and corridors, the existing ecological spaces along the routes are still relatively inadequate and mostly concentrated in densely developed urban areas. Uneven distribution of ecological sources makes it difficult for the ecological services provided by the existing ecological sources to effectively cover the demand area, while the ecological demand patches in the eastern and northern parts of the study area show the characteristics of clustering distribution. Therefore, it is a realistic need to balance the supply and demand of ecological services in the region by increasing the number of ecological sources. By strictly controlling the expansion of construction land, the fragmented ecological land around ecological sources will be consolidated to form concentrated ecological buffer zones. In addition, the ecological corridors between sources of high importance will be protected. The ecological corridors of Hongze Lake-Gaoyou Lake, the Dabie Mountainous Region-Huangshan Hills, and Lake Taihu and its surrounding lakes are under key protection. These ecological corridors are the most favourable pathways for the migration and dispersal of biological species, and the ecological effects of the corridors can be maximized by strengthening the ecological construction of corridor buffer zones and improving the ecological functions of the corridors.
Based on the spatial distribution of sources and ecological corridors in the YRD and the division of ecological supply and demand in each region, we propose a ‘two-belt-four-zone’ Ecological spatial pattern based on the ESP (). Moreover, to guide the differentiated construction of sub-regions at different stages of development and demand. Promoting Ecological Integration in the YRD.
Figure 12. Ecological spatial pattern of ecological security in the Yangtze River Delta region in 2020.
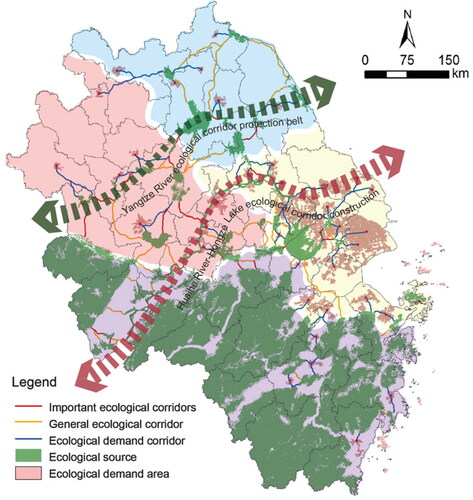
The ‘two belts’ consist of the Yangtze River ecological corridor protection belt and the Huaihe River-Hongze Lake ecological corridor construction belt. The Yangtze River ecological corridor protection belt stretches northeast from southern Anhui to northern Jiangsu, forming a significant ecological corridor along the river. The Huaihe River-Hongze Lake ecological corridor construction belt is an east-west ecological corridor axis that extends from the Dabie Mountains in western Anhui to Hongze Lake.
The ‘four zones’ are divided by the ecological supply-demand balance of the region. Sub-region 1 is located in the central and northern parts of Jiangsu and mainly includes counties with ‘high supply – high demand’. These counties possess favourable ecological conditions and a good level of economic development. From the perspective of ecological system services and demands, this region has achieved a relatively high level of balance and is suitable for human habitation. Therefore, in the subsequent development plan of the YRD, the leading development direction of the region should be to give equal emphasis to the enhancement of eco-industries and preventive management. This region can leverage its abundant ecological resources to develop ecotourism and explore new development opportunities by optimizing land use structure while ensuring environmental protection.
Sub-region 2 is situated in the economically developed coastal areas of the east and mainly encompasses counties with a ‘low supply-high demand’ profile. This region exhibits a higher level of socioeconomic development, frequent human activities, and an excessive reliance on land development, leading to the saturation of resource carrying capacity. Ecological system services and demands indicate a deficit. Therefore, in the subsequent development plan for the YRD, the direction of optimal management of the region should be to place equal emphasis on town development and ecological management. It is imperative to strictly control the scale of new construction land and development intensity, enhance ecological restoration and construction, and moderately expand ecological space to strike a balance between economic development and ecological supply.
Sub-region 3 is primarily distributed in the central and western parts of the YRD, comprising counties with a ‘low supply-low demand’ profile. These counties have flat terrain, average ecological conditions, lower levels of economic development, and relatively lower ecological system services and demands. Therefore, the optimal management of the region is orientated towards integrated ecological and economic upgrading. Key measures should include focusing on land consolidation, improving land-use patterns, relying on surrounding cities for effective development, and coordinating urban-rural development to promote optimization and upgrading of regional industries, enhancing land-use efficiency, optimizing spatial pattern, and driving sustainable regional economic development.
Sub-region 4 is mainly situated in the southwestern part of the YRD, encompassing counties with a ‘high supply-low demand’ profile. These areas boast abundant forestland ecological resources and serve as core distribution areas of source regions, with great potential for resource carrying capacity. However, the current level of land development is relatively low, and there is minimal population pressure, resulting in a surplus of ecological system services. In addition, the region possesses abundant ecological resources and ample room for further development and utilization. Therefore, the direction of optimal management of the region should be to give equal importance to the protection of ecological functions and the development of special features. Speciality industries should be developed on the basis of ecological resources. The enhancement of ecosystem service provisioning capacity should be transformed into economic benefits and industrial transformation and upgrading should be promoted.
5.3. Impacts and implications of different SSP-RCP scenarios on ecological security patterns
The SSP-RCP scenario matrix encompassed a range of future scenario combinations, each characterized by distinct climate and socioeconomic factors, resulting in diverse supply and demand of ecosystem services. Specifically, the SSP1-2.6 scenario represents a sustainable and environmentally conscious development path aimed at preventing environmental degradation. Its objective is to maintain a low level of atmospheric radiative forcing by 2100, thus exemplifying an ecologically friendly and sustainable scenario. The SSP2-4.5 scenario, however, represents a moderate trajectory with moderate social vulnerability and radiative forcing. Conversely, the SSP5-8.5 scenario embodies a conventional development trajectory characterized by rapid global economic growth and extensive urban expansion. It is considered a high-emission scenario that confronts significant challenges in mitigating climate change. The disparity in precipitation and evapotranspiration across scenarios leads to notable disparities in the impact of climate change on water provisioning services, aligning with the findings of Underwood et al. (Citation2019). Among the various climate scenarios, SSP5-8.5 exhibits the most substantial changes in ecosystem services in future simulations, while SSP1-2.6 and SSP2-4.5 demonstrate relatively smaller alterations, consistent with Lu et al.’s findings regarding ecosystem service supply and demand projections in the southwestern region under SSP-RCP scenarios (Lu et al. Citation2023). This result underscores the substantial influence of high-emission scenarios on ecosystem services in different urban agglomeration research areas. Notably, the demand for ecosystem services is highest in the YRD under high-emission scenarios, resulting in a significant decline in habitat quality and elevated precipitation levels. When simulating the future ESP of the YRD urban agglomeration under the three scenarios from 2020 to 2050, spatial changes in ecological sources are minimal across different scenarios, but there are significant variations in their quantities. Under the SSP1-2.6 scenario, the growth rate of ecological sources reaches 2.26%, while the SSP5-8.5 scenario exhibits a reduction rate of ecological sources as high as −3.07%. The SSP2-4.5 scenario, characterized by moderate radiative forcing, remains relatively stable, displaying a growth rate of merely 0.155%. However, between 2050 and 2100, the SSP1-2.6 climate scenario has a 1.80% decrease in ecological sources compared to 2050. Conversely, the area increases by 19.2% under the SSP2-4.5 scenario, while it decreases in the SSP5-8.5 scenario with a reduction rate of −1.61%. These changes are attributed to significant fluctuations in land use under the low-forcing scenario. Although the forest area expands by 2100 compared to 2050, extensive grassland conversion to cropland ultimately results in a relative reduction in the ecological sources. Consequently, the ESP trend of the YRD urban agglomeration is more pronounced under the SSP5-8.5 scenario than under the other two scenarios, especially with a rapid increase in ecological demand areas and a substantial reduction in cropland. However, with the increase in precipitation due to climate change, the shortage of resources in some areas is expected to be alleviated to some extent.
Considering the different scenarios, both SSP1-2.6 and SSP2-4.5 play roles in ecological protection and sustainable resource utilization. Under the SSP2-4.5 scenario, future ecological sources exhibit continuous growth with a higher growth rate. However, ecological demand also experiences a rapid increase, representing an 11.05% increment compared to the SSP1-2.6 scenario. Conversely, the SSP5-8.5 pathway emphasizes rapid economic development while neglecting ecological sustainability. This leads to an imbalance in the supply and demand of ecosystem services, increased fragmentation of ecological sources, and heightened regional ecological risks. The relationship between ecological sources and demands under different scenarios also suggests that ecological and economic development factors must be considered in an integrated manner as the climate and society change in the future. Therefore, it is necessary to strictly control the ecologically sustainable development and utilisation of the YRD from the following two aspects, so as to achieve an optimal balance between the high-speed socio-economic development and ecological environmental protection.
Firstly, the extensive urban development should be strictly controlled, and the diversified ecological elements such as rivers, hills and mountains can be effectively protected. As an important source of carbon emissions, the industrial sector must focus on energy conservation and emission reduction, thereby adjusting the imbalance between supply and demand. The low-carbonisation of the industrial structure can be promoted by using green technologies and industrial transformation and upgrading.
Secondly, governments need to co-ordinate the management of ecological and environmental quality in urban agglomerations. It should explore a new model of multi-urban joint cross-regional environmental management, establish a compensation mechanism for environmental pollution, formulate specific compensation methods, explore the establishment of a regional incentive mechanism for ecological construction inputs, strengthen the construction of green infrastructure in cities, and actively coordinate with neighbouring regions with strong ecosystem supply capacity to promote ecosystem flow.
5.4. Research limitations and future research directions
In the context of ecosystem service supply and demand forecasting, it is crucial to acknowledge the inherent uncertainties associated with the original predictive data, particularly in relation to climate change projections. For example, the data used in this study predominantly originated from global datasets characterized by relatively low spatial resolutions. Additionally, variations in the accuracy of land-use data for the base year exist. The spatial resolution of the base year land use data is 100 m, while the spatial resolution of the future land use simulation data for different climates is 1000 m. Consequently, the precision limitations of the data sources unavoidably introduce certain errors, resulting in a reduction in the projected number of ecological sources in future forecasts. Furthermore, during the calculation of resistance surfaces for different scenarios, the consideration of data availability and future stability led us to utilize topographic relief and road factors from the base year. These factors also influence the accuracy of the prediction results. With the support of more refined future prediction data, the research results are expected to gain greater precision. Moreover, it is important to highlight that this study primarily focuses on unveiling the evolutionary patterns of ESPs under different scenarios based on supply and demand forecasting. Future studies could explore strategies to optimize ESPs under diverse scenarios. For instance, incorporating expanded radiating zones of ecological sources, introducing stepping stones, or identifying ecological breakpoints would facilitate a more effective ecological risk assessment for ESPs under various climatic scenarios.
6. Conclusion
By evaluating ecosystem service supply, demand, and the supply-demand relationship (ESDR), we proposed a new method for identifying ecological supply and demand areas based on the ratio of ecosystem service supply and demand. Following the research paradigm of ‘ecological sources – ecological resistance surfaces – ecological corridors’, we constructed a framework for identifying ESP that connects supply and demand spaces. By considering current risks and future risks, we established an ecological spatial pattern that is named as ‘two belts and four zones’ based on the ESP. In addition, using the IPCC’s proposed joint socioeconomic development and climate change scenario framework (SSP-RCP scenario), the supply and demand of ecosystem services in 2050 and 2100 under three different climate scenarios were simulated, and the future ESPs under different climate scenarios were further predicted. Through the comparative analysis of the ESPs under different scenarios, our research can provide a support for ecological management and sustainable development in the Yangtze River Delta region. The results show that there are regional differences in landscape patterns under different climate scenarios. Both SSP1-2.6 scenario and SSP2-4.5 scenario play an important role in ecological conservation and sustainable use of resources. The SSP2-4.5 scenario is characterized by a higher growth in ecological demand. The SSP5-8.5 scenario is characterized by the imbalance between the supply and demand of ecosystem services, the fragmentation of ecological sources, as well as the increasing regional ecological risk. Accordingly, the results suggest that a new model of joint cross-regional environmental governance by multiple cities should be explored, in addition to strict protection of green ecological space.
Author contribution
All authors contributed to the study conception and design. Methodology was performed by Cheng Li and Jie Zhao. Data collection and analysis were performed by Minghui Gao, Hu Zhao and Cheng Li. The first draft of the manuscript was written by Minghui Gao and all authors commented on previous versions of the manuscript. All authors read and approved the final manuscript.
Data availability statement
Not applicable.
Disclosure statement
No potential conflict of interest was reported by the authors.
Additional information
Funding
References
- Ahmad M, Jiang P, Majeed A, Umar M, Khan Z, Muhammad S. 2020. The dynamic impact of natural resources, technological innovations and economic growth on ecological footprint: an advanced panel data estimation. Resour Policy. 69:101817. doi: 10.1016/j.resourpol.2020.101817.
- Burkhard B, Kroll F, Nedkov S, Müller F. 2012. Mapping ecosystem service supply, demand and budgets. Ecol Indic. 21:17–29. doi: 10.1016/j.ecolind.2011.06.019.
- Castillo-Eguskitza N, Martín-López B, Onaindia M. 2018. A comprehensive assessment of ecosystem services: integrating supply, demand and interest in the Urdaibai Biosphere Reserve. Ecol Indic. 93(OCT):1176–1189. doi: 10.1016/j.ecolind.2018.06.004.
- Cheng X, Long RY, Chen H, Li QW. 2019. Coupling coordination degree and spatial dynamic evolution of a regional green competitiveness system – a case study from China. Ecol Indic. 104(SEP):489–500. doi: 10.1016/j.ecolind.2019.04.003.
- Chetkiewicz CLB, Clair CCS, Boyce MS. 2006. Corridors for conservation: integrating pattern and process. Annu Rev Ecol Evol Syst. 37(1):317–342. doi: 10.1146/annurev.ecolsys.37.091305.110050.
- Cook BI, Mankin JS, Marvel K, Williams AP, Smerdon JE, Anchukaitis KJ. 2020. Twenty-first century drought projections in the CMIP6 forcing scenarios. Earth’s Future. 8(6):e2019EF001461. doi: 10.1029/2019EF001461.
- Cueva J, Yakouchenkova IA, Fröhlich K, Dermann AF, Dermann F, Köhler M, Grossmann J, Meier W, Bauhus J, Schröder D, et al. 2022. Synergies and trade-offs in ecosystem services from urban and peri-urban forests and their implication to sustainable city design and planning. Sustain Cities Soc. 82:103903. doi: 10.1016/j.scs.2022.103903.
- Cumming GS, Buerkert A, Hoffmann EM, Schlecht E, von Cramon-Taubadel S, Tscharntke T. 2014. Implications of agricultural transitions and urbanization for ecosystem services. Nature. 515(7525):50–57. doi: 10.1038/nature13945.
- Fang Y, Wang J, Huang LY, Zhai TL. 2020. Determining and identifying key areas of ecosystem preservation and restoration for territorial spatial planning based on ecological security patterns: a case study of Yantai city. J Nat Res. 35(1):190–203.
- Fick S, Hijmans R. 2017. WorldClim 2: new 1-km spatial resolution climate surfaces for global land areas. Int J Climatol. 37(12):4302–4315. doi: 10.1002/joc.5086.
- Gao JB, Du FJ, Zuo LY, Jiang Y. 2021. Integrating ecosystem services and rocky desertification into identification of karst ecological security pattern. Landscape Ecol. 36(7):2113–2133. doi: 10.1007/s10980-020-01100-x.
- Gomez-Baggethun E, Barton DN. 2013. Classifying and valuing ecosystem services for urban planning. Ecol Econ. 86:235–245. doi: 10.1016/j.ecolecon.2012.08.019.
- Gou M, Li L, Ouyang S, Shu C, Xiao W, Wang N, Hu J, Liu C. 2022. Integrating ecosystem service trade-offs and rocky desertification into ecological security pattern construction in the Daning river basin of southwest China. Ecol Indic. 138:108845. doi: 10.1016/j.ecolind.2022.108845.
- Hamlet AF, Lee SY, Mickelson KEB, Elsner MM. 2010. Effects of projected climate change on energy supply and demand in the Pacific Northwest and Washington State. Clim Change. 102(1–2):103–128. doi: 10.1007/s10584-010-9857-y.
- Han YN, Peng J, Meersmans J, Liu YX, Zhao ZQ, Mao Q. 2018. Integrating spatial continuous wavelet transform and normalized difference vegetation index to map the agro-pastoral transitional zone in Northern China. Remote Sens. 10(12):1928. doi: 10.3390/rs10121928.
- He Q, Dai XA, Chen SQ. 2020. Assessing the effects of vegetation and precipitation on soil erosion in the three-river headwaters region of the Qinghai-Tibet Plateau, China. J Arid Land. 12(5):865–886. doi: 10.1007/s40333-020-0075-9.
- Hu QY, Chen SL. 2021. Optimizing the ecological networks based on the supply and demand of ecosystem services in Xiamen-Zhangzhou-Quanzhou region. J Nat Res. 36(2):342–355. doi: 10.31497/zrzyxb.20210206.
- Huang JM, Hu YC, Zheng FY. 2020. Research on recognition and protection of ecological security patterns based on circuit theory: a case study of Jinan City. Environ Sci Pollut Res Int. 27(11):12414–12427. doi: 10.1007/s11356-020-07764-x.
- Jia Q, Jiao L, Lian X, Wang W. 2023. Linking supply-demand balance of ecosystem services to identify ecological security patterns in urban agglomerations. Sustain Cities Soc. 92:104497. doi: 10.1016/j.scs.2023.104497.
- Jiang H, Peng J, Dong JQ, Zhang ZM, Xu ZH, Meersmans J. 2021. Linking ecological background and demand to identify ecological security patterns across the Guangdong-Hong Kong-Macao Greater Bay Area in China. Landscape Ecol. 36(7):2135–2150. doi: 10.1007/s10980-021-01234-6.
- Kang J, Zhang X, Zhu X, Zhang B. 2021. Ecological security pattern: a new idea for balancing regional development and ecological protection. A case study of the Jiaodong Peninsula, China. Global Ecol Conserv. 26:e01472. doi: 10.1016/j.gecco.2021.e01472.
- Knaapen JP, Scheffer M, Harms B. 1992. Estimating habitat isolation in landscape planning. Landscape Urban Plann. 23(1):1–16. doi: 10.1016/0169-2046(92)90060-D.
- Kong F, Yin H, Nakagoshi N, Zong Y. 2010. Urban green space network development for biodiversity conservation: identification based on graph theory and gravity modeling. Landsc Urban Plann. 95(1–2):16–27. doi: 10.1016/j.landurbplan.2009.11.001.
- Kroll F, Müller F, Haase D, Fohrer N. 2012. Rural–urban gradient analysis of ecosystem services supply and demand dynamics. Land Use Policy. 29(3):521–535. doi: 10.1016/j.landusepol.2011.07.008.
- Lambin EF, Geist HJ, Lepers E. 2003. Dynamics of land-use and land-cover change in tropical regions. Annu Rev Environ Resour. 28(1):205–241. doi: 10.1146/annurev.energy.28.050302.105459.
- Liao WL, Liu XP, Xu XY, Chen GZ, Liang X, Zhang HH, Li X. 2020. Projections of land use changes under the plant functional type classification in different SSP-RCP scenarios in China. Sci Bull (Beijing). 65(22):1935–1947. doi: 10.1016/j.scib.2020.07.014.
- Li J, Jiang H, Bai Y, Alatalo JM, Li X, Jiang H, Liu G, Xu J. 2016. Indicators for spatial–temporal comparisons of ecosystem service status between regions: a case study of the Taihu River Basin, China. Ecol Indic. 60:1008–1016. doi: 10.1016/j.ecolind.2015.09.002.
- Li J, Li L, Guo L, Du S. 2016. Assessment on the ecological suitability in Zhuhai City, Guangdong, China, based on minimum cumulative resistance model. Chin J Appl Ecol. 27(1):8.
- Liu XY, Zeng J, Jia MY, Zhang S. 2020. Construction of ecological security pattern and simulation of urban sprawl in the Urban Agglomeration of Min Delta. Acta Ecol Sinica. 40(21):7873–7885.
- Lu HT, Stringer LC, Yan Y, Wang CX, Zhao CL, Rong YJ, Zhu JY, Wu G, Dallmer M. 2023. Mapping ecosystem service supply and demand:historical changes and projections under SSP-RCP scenarios. Acta Ecol Sinica. 43(04):1309–1325.
- McRae BH, Dickson BG, Keitt TH, Shah VB. 2008. Using circuit theory to model connectivity in ecology, evolution, and conservation. Ecology. 89(10):2712–2724. doi: 10.1890/07-1861.1.
- Meng ST, Huang QX, Zhang L, He CY, Inostroza L, Bai YS, Yin D. 2020. Matches and mismatches between the supply of and demand for cultural ecosystem services in rapidly urbanizing watersheds: a case study in the Guanting Reservoir basin, China. Ecosyst Serv. 45:101156. doi: 10.1016/j.ecoser.2020.101156.
- Mouratiadou I, Biewald A, Pehl M, Bonsch M, Baumstark L, Klein D, Popp A, Luderer G, Kriegler E. 2016. The impact of climate change mitigation on water demand for energy and food: an integrated analysis based on the shared socioeconomic pathways. Environ Sci Policy. 64:48–58. doi: 10.1016/j.envsci.2016.06.007.
- Musyoki KG, Ko JH. 2020. Climate change on agriculture in 2050: a CGE approach. J Int Trade Commerce. 16(4):1–19.
- Peng J, Li HL, Liu YX, Hu YN, Yang Y. 2018. Identification and optimization of ecological security pattern in Xiong’an New Area. Acta Geograph Sinica. 73(4):701–710.
- Peng J, Zhao SQ, Dong JQ, Liu YX, Meersmans J, Li HL, Wu JS. 2019. Applying ant colony algorithm to identify ecological security patterns in megacities. Environ Model Softw. 117:214–222. doi: 10.1016/j.envsoft.2019.03.017.
- Peng J, Zhao HJ, Liu YX, Wu JS. 2017. Research progress and prospect on regional ecological security pattern construction. Geograph Res. 36(3):407–419.
- Pham HV, Sperotto A, Torresan S, Acuña V, Jorda-Capdevila D, Rianna G, Marcomini A, Critto A. 2019. Coupling scenarios of climate and land-use change with assessments of potential ecosystem services at the river basin scale. Ecosyst Serv. 40:101045. doi: 10.1016/j.ecoser.2019.101045.
- Pierik ME, Dell’Acqua M, Confalonieri R, Bocchi S, Gomarasca S. 2016. Designing ecological corridors in a fragmented landscape: a fuzzy approach to circuit connectivity analysis. Ecol Indic. 67:807–820. doi: 10.1016/j.ecolind.2016.03.032.
- Rao S, Klimont Z, Smith SJ, Van Dingenen R, Dentener F, Bouwman L, Riahi K, Amann M, Bodirsky BL, van Vuuren DP, et al. 2017. Future air pollution in the shared socio-economic pathways. Global Environ Change Human Policy Dimens. 42:346–358. doi: 10.1016/j.gloenvcha.2016.05.012.
- Rogelj J, Popp A, Calvin KV, Luderer G, Emmerling J, Gernaat D, Fujimori S, Strefler J, Hasegawa T, Marangoni G, et al. 2018. Scenarios towards limiting global mean temperature increase below 1.5 °C. Nature Clim Change. 8(4):325–332. doi: 10.1038/s41558-018-0091-3.
- Salimi S, Scholz M. 2021. Impact of future climate scenarios on peatland and constructed wetland water quality: a mesocosm experiment within climate chambers. J Environ Manage. 289:112459. eng. doi: 10.1016/j.jenvman.2021.112459.
- Schröter M, Remme R, Hein L. 2012. How and where to map supply and demand of ecosystem services for policy-relevant outcomes? Letter to the Editor. Ecol Indic. 23:220–221. doi: 10.1016/j.ecolind.2012.03.025.
- Su Y, Chen X, Liao J, Zhang H, Wang C, Ye Y, Wang Y. 2016. Modeling the optimal ecological security pattern for guiding the urban constructed land expansions. Urban for. Urban Greening. 19:35–46. doi: 10.1016/j.ufug.2016.06.013.
- Sun YY, Liu DF, Wang P. 2022. Urban simulation incorporating coordination relationships of multiple ecosystem services. Sustain Cities Soc. 76:103432. doi: 10.1016/j.scs.2021.103432.
- Tong H-l, Shi P-j 2020. Using ecosystem service supply and ecosystem sensitivity to identify landscape ecology security patterns in the Lanzhou-Xining urban agglomeration, China. J Mt Sci. 17(11):2758–2773. doi: 10.1007/s11629-020-6283-0.
- Underwood EC, Hollander AD, Safford HD, Kim JB, Srivastava L, Drapek RJ. 2019. The impacts of climate change on ecosystem services in southern California. Ecosyst Serv. 39:101008. doi: 10.1016/j.ecoser.2019.101008.
- Vergnes A, Kerbiriou C, Clergeau P. 2013. Ecological corridors also operate in an urban matrix: a test case with garden shrews. Urban Ecosyst. 16(3):511–525. doi: 10.1007/s11252-013-0289-0.
- Wang Z, Li X, Mao Y, Li L, Wang X, Lin Q. 2022. Dynamic simulation of land use change and assessment of carbon storage based on climate change scenarios at the city level: A case study of Bortala, China. Ecol. Indic. 134:108499. doi: 10.1016/j.ecolind.2021.108499.
- Wang Y, Pan J. 2019. Building ecological security patterns based on ecosystem services value reconstruction in an arid inland basin: A case study in Ganzhou District, NW China. J. Cleaner Prod. 241:118337 doi: 10.1016/j.jclepro.2019.118337.
- Wang T, Li HB, Huang Y. 2021. The complex ecological network’s resilience of the Wuhan metropolitan area. Ecol Indic. 130:108101. doi: 10.1016/j.ecolind.2021.108101.
- Wang J, Zhai TL, Lin YF, Kong XS, He T. 2019. Spatial imbalance and changes in supply and demand of ecosystem services in China. Sci Total Environ. 657:781–791. doi: 10.1016/j.scitotenv.2018.12.080.
- Wei JX, Zhang YZ, Lian ZX, Yin M, Ou WX. 2022. Research on regional ecological security pattern construction based on ecological supply and demand space: a case study of Southern Jiangsu urban agglomeration. Res Environ Yangtze Basin. 31(2):387–397.
- Wickham JD, Riitters KH, Wade TG, Vogt P. 2010. A national assessment of green infrastructure and change for the conterminous United States using morphological image processing. Landscape Urban Plann. 94(3-4):186–195. doi: 10.1016/j.landurbplan.2009.10.003.
- Yi L, Sun Y, Yin SH, Wei X. 2022. Construction of ecological security pattern: concept, framework and prospect. Ecol Environ Sci. 31(04):845–856.
- Zhang M, Liu JP, Zhao DD. 2021. Construction of ecological security pattern in western Jilin Province. Arid Land Geograph. 44(06):1676–1685.
- Zhang PT, Liu SJ, Zhou Z, Liu CJ, Xu L, Gao X. 2021. Supply and demand measurement and spatio-temporal evolution of ecosystem services in Beijing-Tianjin-Hebei Region. Acta Ecol Sinica. 41(09):3354–3367.
- Zhang LQ, Peng J, Liu YX, Wu JS. 2017. Coupling ecosystem services supply and human ecological demand to identify landscape ecological security pattern: a case study in Beijing-Tianjin-Hebei region, China. Urban Ecosyst. 20(3):701–714. doi: 10.1007/s11252-016-0629-y.