
 ?Mathematical formulae have been encoded as MathML and are displayed in this HTML version using MathJax in order to improve their display. Uncheck the box to turn MathJax off. This feature requires Javascript. Click on a formula to zoom.
Abstract
This study, which aims to make predictions using a previously unused deep hybrid Convolutional Neural Network-Support Vector Regression approach for hydropower generation, was carried out using a unique meteorological data set as input data. The unique dataset was collected from Kaman Meteorology Directorate and Hirfanlı HEPP in Turkey, from 2007 to 2021, to estimate the HEPP's Net Head and Hydroelectric Power Generation on a daily basis. The performances of the prediction models were benchmarked in addition to the used CNN-SVR model with Machine Learning (ML) models (Boosting Random Forest Regression (BRFR) and Weighted K-Nearest Neighbor Regression (WKNNR)) and Deep Learning (DL) models (Long-Short Term Memory (LSTM) and Deep Belief Network (DBN)). The comparison results of the used CNN-SVR model with other alternative models showed that CNN-SVR performed effectively with the highest correlation coefficient of 0.971 for NH and 0.968 for PP.
Introduction
In recent years, studies on renewable energy sources have increased in order to use the limited resources effectively and benefit from renewable energy sources as much as possible. Owing to electricity being an essential input in industrial production, energy consumption and the diversity of energy resources are the most important factors that determine the development of a country. Because, especially for developing countries, the increase in energy consumption means an increase in industrialization. From this point of view, energy consumption is an indicator of economic development for countries (Rosenzweig et al. Citation2011; Izquierdo-Monge et al. Citation2021). However, the efficiency of many energy sources, especially renewable ones in electricity generation is under the influence of environmental factors such as meteorological and geographical effects that differ from one country to another. Therefore, each country has to define a policy of energy, taking into account its own particular conditions such as supply-demand balance, foreign dependency in the field of energy, environmental factors, and population changes (Rosenzweig et al. Citation2011; Gallardo-Saavedra et al. Citation2022).
Hydropower production prediction models play a crucial role in preventing energy shortages during droughts. In the literature. Various models have been developed by researchers to forecast hydropower production, which uses error correction-grounded prediction (Zhang et al. Citation2018), the algorithms of ensemble based (Plucinski et al. Citation2019) or time series processing (Karri et al. Citation2014), empirical orthogonal functions (Pan and Lv Citation2019) and multivariate strategies (Shaw et al. Citation2017). Additionally, ML algorithms have been correctly implemented in similar studies. Despite the important previous research which is developed for the estimation of especially water level of the reservoir, there are slight studies still devoted to the prediction of hydropower generation.
Machine learning models have gained significant popularity in predicting hydropower production and energy demand due to their ability to uncover complex relationships within input and output data. These models offer advantages such as fast computation, easy implementation, and high precision. The reveals of ANN and ML have created a way to predict the hydroelectric generation for an estimate for different periodic times such as for a day, a month, a year, or average energy from hydropower. In (Hammid et al. Citation2018), they reported ANN-based models that agglomerating a feedforward network together with the backpropagation method to predict the hydroelectric power generation of the Himreen Lake dam station, by using water’s flow rate and the turbine head as input data, and they obtained 0.96 r value. At 2017 (Shaw et al. Citation2017), researchers used hi-fi models further as improvement strategies associated with surrogate modeling techniques for an hourly electrical power generation theme that was imitated by genetic algorithms and ANN approaches. Cobaner et al. (Citation2008), were presented a multi-layer perceptron (MLP) with one hidden layer together with the Levenberg–Marquardt (LM) algorithm to produce an accurate estimation of annual hydropower output from irrigation dams. They used the turbine’s working time, irrigation water, evaporation ratio, and water inflows as input in the LM algorithm with the feed-forward network to forecasting hydropower production. Lopes et al. (Citation2019), were used also MLP with a backpropagation algorithm to predict the monthly hydroelectric production by using daily rainfall as input data. In (Condemi et al. Citation2021a) prediction of hydroelectric production capacity in Northern Italy has been observed by using ML techniques implemented to the ungrouped and grouped input features and a variety of correlations was obtained between the prediction of generation capacity and its actual value. Guo et al. (Citation2018) utilized support vector machine models (SVMs) to successfully predict power production, while Dehghani et al. (Citation2019) developed a neuro-fuzzy adaptive system (ANFIS) using the grey wolf optimization (GWO) algorithm, outperforming the traditional ANFIS model. Gao et al. (Citation2020) proposed an artificial neural network (ANN) model with long short-term memory (LSTM) to predict one-day-ahead power, effectively overcoming the limitations of conventional recurrent neural networks (RNNs) through the use of memory cells. Rahman et al. (Citation2021) demonstrated the successful prediction of power energy using various ANN models, with the combination of adaptive wavelet transforms (WT) and LSTM outperforming the standalone LSTM model. Zolfaghari and Golabi (Citation2021) reported that the wavelet-ANN and wavelet-LSTM models achieved high r2 values and lower root mean square error (RMSE) compared to the LSTM model. Barzola-Monteses et al. (Citation2022) utilized artificial neural networks (ANNs) with grid search algorithm parameters to predict hydropower production, proving the reliability of their developed model for energy management. They considered one-step and multi-step prediction scenarios, with the models demonstrating efficient execution times and competitive RMSE values. Hanoon et al. (Citation2023) focused on predicting the power production of a reservoir in China using ANN, SVM, and ARIMA models. Their results demonstrated the successful prediction capabilities of the ANN and SVM models, with correlation coefficients ranging from 0.8761 to 0.8779 for the MLP model and 0.8480 to 0.8710 for the radial basis function neural network model. Finally, Ehtearm et al. (Citation2023) reported a 0.95 index of agreement at the 1-day prediction horizon by using Convolutional Neural Network-Multilayer Perceptron-Gaussian Process Regression (CNNE-MUPE-GPRE).
This study aims to address research gaps by developing ANN models that utilize new techniques. In recent years, deep learning models have gained popularity in analyzing complex data, making them a preferred alternative to traditional machine learning models for hydropower generation prediction. Deep learning models excel in capturing intricate relationships between input parameters, leading to enhanced accuracy compared to traditional models. Furthermore, studies have shown that hybridizing ANNs with deep learning models can further enhance their performance (Sharifzadeh et al. Citation2019).
However, feature selection algorithms can improve prediction performance, particularly for problems with many input variables. Meta-heuristic (MH) and deep learning (DL) algorithms can be combined to improve application performance. This study predicts hydroelectric energy production (PP) by using meteorological changes. For this, a DL hybrid application is presented to help designers and engineers to optimize hydroelectric, a renewable energy source. To our knowledge, the model which is a hybrid CNN-SVR model, has not been used to predict hydroelectric power production (PP) and/or NH. First, a DL model and MH method were united to improve feature selection for hydroelectric parameter prediction. For the final prediction, ML was used. The deep hybrid CNN-SVR model finally made a relatively correct prediction. Hirfanlı HEPP on Kızılırmak River which is in Kaman in Kırşehir was chosen as the sampling plane in this study and PP and NH estimation has been made by using a vigorous feature selection method which consists of a combined MH algorithm and CNN approach was applied and finally, this method was assembled with a Support Vector Regression (SVR) to acquire a predictive model for the capacity of the PP and NH of HEPP.
Addressing the limitations of machine learning (ML) forecasters in predicting abrupt changes, a promising solution emerged in the form of deep learning (DL) power production (PP) forecasters, which are classified as statistical forecasters. DL forecasters have the ability to overcome the shortcomings of ML forecasters by either integrating with ML techniques or functioning as standalone forecasters. They aim to replicate the learning capabilities of the human brain, using mathematical approximations to generate predictions based on unseen data points from the past (Rodriguez et al. Citation2022).
This paper utilizes a model for predicting power production one day ahead, based on deep learning, mathematical probability density functions, and meteorological parameters. In this section, the proposed deep hybrid CNN-SVR forecaster’s accuracy is examined. Our model predicts power generation of Hirfanlı HEPP through meteorological parameters, for one day ahead. The selected original dataset has a one-day resolution.
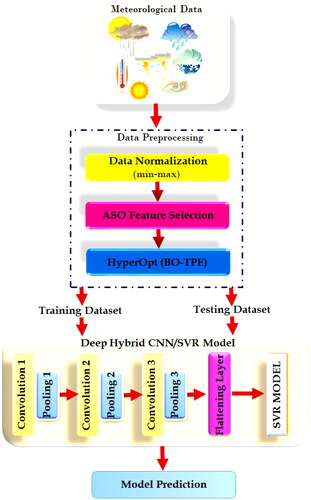
Hybrid CNN-SVR DL Model: The proposed hybrid model combines the strengths of Convolutional Neural Networks (CNN) and Support Vector Regression (SVR) for predicting the Power Production (PP) and net head (NH) of Hirfanlı HEPP. This novel approach leverages the feature extraction capabilities of CNN and the regression power of SVR, leading to improved prediction accuracy.
Integration of Meteorological and Power Production Data: The study utilized meteorological variables obtained from the Kırşehir/Kaman Weather Directorate along with power production data from Hirfanlı HEPP. By integrating these two types of data, the model can capture the influence of weather conditions on the PP and NH, enabling more accurate predictions.
Atom Search Optimization (ASO) Feature Selection: The study employed the ASO technique for feature selection, aiming to identify the most relevant meteorological variables from the dataset. By utilizing ASO, the model ensures that only the most crucial features are considered, which can enhance prediction accuracy and reduce computational complexity.
Hyperparameter Optimization: HyperOpt was utilized to optimize the hyperparameters of all the models used in the study. This ensures that the models are fine-tuned for optimal performance, improving their ability to capture the underlying patterns in the data and make accurate predictions.
Comprehensive Evaluation: The study not only focuses on the hybrid CNN-SVR model but also develops and evaluates four additional forecasting models based on LSTM, DBN, BRFR, and WKNNR. Hereby, the study conducts a comprehensive benchmarking analysis, comparing the performance of the hybrid CNN-SVR model with other DL methods (LSTM and DBN) and ML methods (BRFR and WKNNR). This comprehensive evaluation allows for a thorough comparison of different modelling approaches, providing insights into the most suitable technique for estimating PP and NH one day ahead in Hirfanlı HEPP.
The remainder of the article is arranged as:
The next section defines general information about hydroelectric power plants and power generation, the sample plane, and the dataset used to apply to the problem of PP and NH estimations. Additionally, it has ensured detailed information on the utilized models and deep learning techniques to which these inputs were applied. In Results section, the experimental outcomes of adjusting of applied algorithms about the Hirfanlı HEPP case study are submitted. The conclusion section was dedicated to the argumentation of the outcomes, while the Discussion section concludes this article with some eventual consequences and descriptions of this work achieved and contribution to literature and future goals.
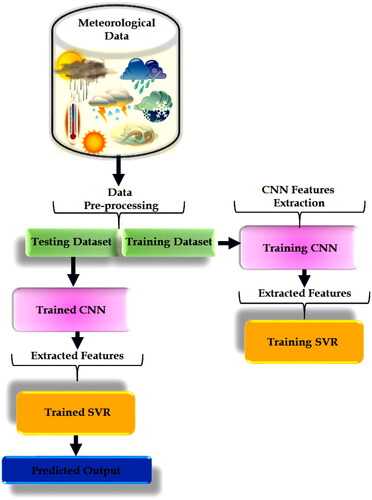
An overview of the study is given in .
Figure 1. An overview of study.
Materials and method
Sample plane and dataset
A region’s hydropower capacity is generally related to water scarcity, which is naturally influenced by precipitation and/or snowmelt, temperature, and solar radiation. Therefore, meteorological events dominate the HEPP's electrical generation. HEPP capacity is not directly related to meteorological variations. This means that precipitation takes time to become HEPP-usable water (Condemi et al. Citation2021b). Additionally, meteorological events may not have a lasting impact.
Snowpack melting increases hydropower plant water accessibility due to micro-regional conditions (Fugazza et al. Citation2021). With all these regional specifications, the parameters that affect the water level in HEPP dam, such as water for drinking and use, leakage, and other water consumptions, make the model complex and difficult to generalize. For flood control, energy, and irrigation, this study used Hirfanlı Dam-HEPP, a 1953–1959 dam on the Kızılırmak River in Kaman/Kırşehir, Turkey. The lake volume is 5980 hm3 and the area is 263 km2. At normal water level, the dam is 78 m from the riverbed. Hirfanlı, Turkey’s 43rd, and Kırşehir’s second largest HEPP, generates 400 GWh of energy annually with an installed capacity of 128 MWe ().
Figure 2. Map of Kaman in Kırşehir/Turkey (in top) and a photo of Hirfanlı HEPP (in bottom) (Sorgula Citation2023).
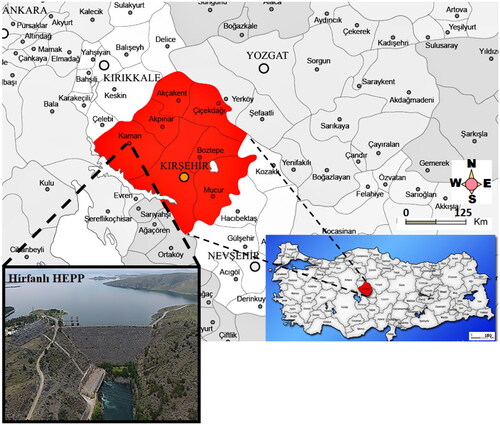
Hirfanlı HEPP with a power capacity of 128 MW provides approximately 185 GWh of electricity generation per year and it generates enough electricity to power 61.910 homes (Atlası Citation2023).
A HEPP's total electrical power generation capacity is based on the amount of water available, its net head, and the amount of natural water inlet. Consequently, the final determinant of a region’s hydropower potential is typically related to water scarcity, which is in turn affected by precipitation and/or snowmelt, temperature, and solar radiation. Therefore, it is evident that meteorological events have the greatest impact on electrical generation at hydroelectric power production (HEPP). However, there is no direct correlation between these variations in meteorological conditions and HEPP capacity. This indicates that it takes some time for precipitation to turn into water that can be used in the HEPP after it occurs (Condemi et al. Citation2021a). Furthermore, the impact of meteorological events over time might not be consistent.
Starting from this perspective, Kaman/Kırşehir Weather Directorate and Hirfanlı Hydropower Station collected meteorological data and data on power production over a 15-year period, from 1 January 2007 to 31 December 2021, and the author organized the data to produce an original dataset. There are many different working variables because all meteorological and electrical generation data are determined daily. Two government organizations (Kaman/Kırşehir Weather Directorate and Hirfanlı Hydropower Station) have provided and verified these historical data. These public institutions are pertinent areas together; these data are therefore dependable as it has been checked from two specific targets. The dataset used in this study comprises valuable information from , encompassing essential meteorological features such as the highest, lowest, and average air temperatures, as well as details regarding precipitation type, amount, and intensity, spanning 15 years (365 days each year). In total, there are 41 variables captured daily over the entire period. This extensive dataset allows for a comprehensive analysis of factors influencing changes in water availability and electricity production in the region. By analyzing such a vast amount of data (344 925 data points in total), researchers gain a deeper understanding of the intricate relationships between meteorological variables and their impact on water resources and energy generation. Additionally, shows the frequency of some features as histogram plots of the dataset.
Figure 3. The frequency of specific features for the input dataset as histogram plots; sunshine duration (x-axis = VALUEx100) (a), snow thickness (x-axis = VALUEx100) (b), open surface evaporation amount (x-axis = VALUEx100) (c), average humidity (d), type of precipitation (e).
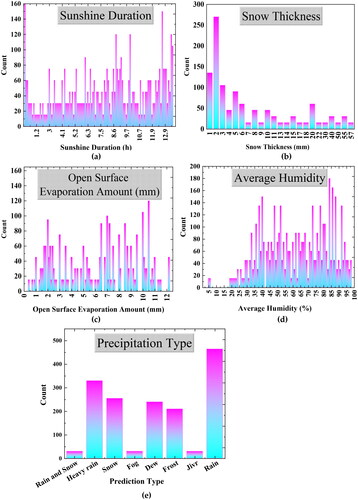
Table 1. Descriptive information of daily meteorological and power production parameters for Hirfanlı HEPP.
In the same time period, the data related to the net head and electrical power production (in – line 42, 43) are achieved from the Hirfanlı HEPP. 80% of the dataset was used for training and 20% was used for testing. To ensure homogeneity in the testing and validation phases, the years 2011, 2016, and 2021 (1 year after every 4 years) were specifically selected. The experimental studies are started for the meteorological and power production data by using MH/CNN hybrid algorithms. Then SVR technique is performed with the output of the MH/CNN algorithms for the prediction of the NH and PP. In this work, to evaluate the performance, the prediction parameters of the suggested deep learning hybrid CNN-SVR model is compared with Long-Short Term Memory (LSTM), Deep Belief Network (DBN) which are two alternative deep learning approaches, and also with two alternative ML models as Boosting Random Forest Regression (BRFR) and Weighted K-Nearest Neighbor Regression (WKNNR). The selected machine learning (ML) techniques (CNN-SVR, DBN, LSTM, BRFR, and WKNNR) in the study are chosen based on their suitability for the prediction task of hydroelectric power production (PP) and net head (NH) of HEPP using meteorological data. Each technique has its strengths and advantages, making them valuable candidates for this specific regression problem.
Preprocessing of data and atom search optimization (ASO)
Meteorological and power generation variables and similarly past observations of Net Head (m) and Power Production (GWh) variables were extracted for Hirfanlı HEPP for the time range from 2007 to 2021. One-dimensional analyses were extracted and matched with daily series of meteorological data for setting one-dimensional required outputs from the models.
Before the training process of the models, to decrease the effect of excessive values in measures of the various models, all of the data were normalized by applying the min–max (between the range of 0 and 1) normalization technique for accelerating the training process of the ML method (Cihan et al. Citation2017).The min-max normalization technique can be described as:
(1)
(1)
where
is the scaled value vector,
is the normalized
values,
and
are the minimum and the maximum vector values respectively.
On the other hand, for effective pre-processing, the FS model was used to determine the best subset of crucial features by removing the features that are unnecessary and uninformative (García-Hinde et al. Citation2018; Salcedo-Sanz et al. Citation2018). This process greatly affects the performance of the ML model. Due to the presence of unnecessary features, the model’s training time may increase. However, while the model is desired to be simple and explainable, too few features can reduce the interpretability of the model. At the same time, it can cause model success to be high in the training dataset due to overfitting, but low in the test dataset. If the records in the test data set are not similar to the records in the training data set, the error rate in the model will be high. For this reason, the most important and first step in model design should be data cleaning and feature selection (García-Hinde et al. Citation2018; Chen et al. Citation2020; Castangia et al. Citation2021).
Moreover, a meta-heuristic algorithm the ASO model for FS was performed to choose the most important variables of the predictor by extracting insignificant variables from the obtained 41 meteorological and power generation variables. The algorithm of ASO is progressed by normalization of all meteorological variables and processing with the configurations of; the weight of depth, α = 60, the weight of multiplier β = 0.5, the atom number of the population, N ∈{5, 20, 50, 100, 150, 250, 400, 550, 700, 800, 900, 1000} and the maximum iteration number, T = 40.
Firstly, ASO's global search capability enables it to find precise and optimal models, leading to improved forecasting precision and effectively modeling complex interactions between meteorological data and power generation due to its ability to capture non-linear relationships. On the other hand, ASO's robustness allows it to handle noisy and inconsistent meteorological data, ensuring reliable predictions even in uncertain conditions and its quick convergence speed is valuable for real-time and short-term forecasting, crucial for efficient power plant operation and energy management. Besides ASO's structure allows for faster computation and training, advantageous for dealing with large datasets and complex models. In terms of feature selection and dimensionality reduction, ASO aids in identifying relevant meteorological variables, making the model more efficient and interpretable and it can handle large datasets, utilizing historical weather patterns for improved long-term forecasting.
The atom number of the population was changed from 5 to 1000 to determine the optimum value that will deliver the minimum value of the root mean square error that was expressed by the fitness value in .
Figure 4. The curve of convergence for the ASO for the atom numbers (N) from 5 to 1000.
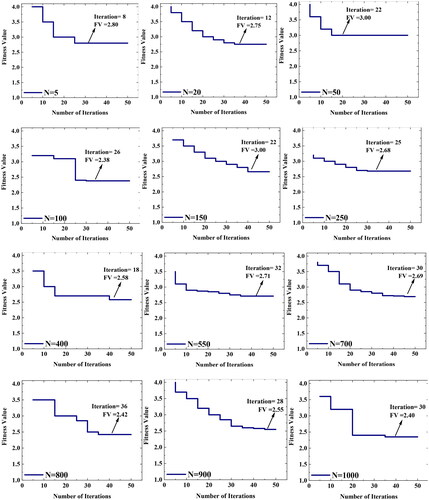
As given in , the fitness value FV was obtained from the convergence curve of ASO, and when the atom number of the population was 100, 26 iterations later, the fitness value became the relatively minimum value of 2.38 while compared to the other value of the atom numbers. When the atom numbers rise, the FV converged more quickly but at this point, the FV was still high. Also, the cost of the computation has been found as increasing directly proportional to the value of N, at the same time the time of the commutation process varied from 12 min to 430 min for N = 5 and 1000 respectively. Hence the N value for the FS process was selected as 100 and with this ASO process 16 variables (16x365x15) were selected and given in .
Table 2. Input variables selected for PP and NH by using ASO feature selection process.
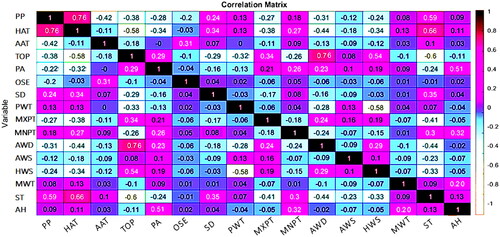
After FS process of ASO, demonstrates the results of the predictors to predict the PP and NH of HEPP. Furthermore, the correlation matrix of predictand and predictors for PP was given in .
Figure 5. The correlation coefficient matrices of the PP predictor parameters for the daily meteorological data (the abbreviations of the parameter names were outlined in ).
Hybrid CNN-SVR model
In this study a unified DL model was suggested which was created by assembling the CNN and SVR methods to ensure a data driven, DL model to forecasting of the Net Head and the Power Production of a HEPP. CNN-SVR model was used and succeeded on different alternative energy studies, although to the best of our knowledge, this application was not used before about hydroelectric energy production or net head prediction, by using meteorological data. For this purpose, a hybrid approach was constructed in which a SVR training system that containing stacked convolutional and pooling layers platform was embedded to the top layer of CNN. The integration of Convolutional Neural Network (CNN) and Support Vector Regression (SVR) for power production and net head predictions of a hydroelectric power plant from meteorological data offers several advantages over using a single CNN for the same task.
CNN is exceptional at extracting relevant spatial features from input data. By integrating CNN with SVR, the CNN part of the model can effectively capture complex spatial patterns in the meteorological data which are crucial for accurate power production and net head prediction. Because SVR is a powerful regression algorithm that can capture non-linear relationships between input features and power production. Integrating SVR with CNN allows the model to learn more intricate relationships between meteorological factors and predicted power generation and net head, as hydroelectric power production and net head are influenced by a multitude of non-linear factors. Additionally, CNN tends to over fit when dealing with limited data. By integrating SVR, which generalizes well to new data points, the model can achieve better performance with smaller training datasets, making it more applicable in real-world scenarios where obtaining extensive training data might be challenging. Therewithal meteorological data can often be noisy, with various environmental factors leading to fluctuations in the data. CNN-SVR integration can handle such noise better compared to a single CNN model, ensuring more robust and stable predictions. Consequently, by combining CNN and SVR, the model is thought that can effectively leverage historical data patterns learned by the CNN component, enhancing the prediction accuracy and reliability for long-term forecasting. The fundamental steps of the approach are demonstrated in .
Figure 6. The application procedure of the hybrid CNN-SVR model.
The prime method of feature extraction in this study is CNN which is a network of deep learning that is based on MLP. In the CNN model, the neurons are not attached to the previous layer and the weights are shared therefore the CNN algorithms can performed with a larger datasets more effectively than a MLP algorithm (Gao et al. Citation2020; Özbay and Özbay Citation2023). When the input of the convolutional layer is supposed as: X∈RAxB, where A and B are the input dataset dimensions and accordingly the computational layer output can be computed as (2):
(2)
(2)
where, the operation of convolution is indicated by *, cn is the filter number, Ccn is the convolutional layer’s cnth feature map, X is the matrix of the input dataset, Wcn is the cnth filter’s weight matrix of current layer, and bcn is the cnth bias value. And at last the activation function f is implemented to the outcomes.
On the other hand generally the SVR is based on ML methods that structured on a theory of statistical learning and extensively utilized for the solutions of the high dimensional regression problems, and performs efficiently for having less training variables or limited sources of computing (Salcedo‐Sanz et al. Citation2014; Piri et al. Citation2015). The fundamental theory of the SVR model is mapping the raw data from the space of input into a feature space that is more than one or even infinite dimension, where a structured ideally separated hyperplane. The developed convolutional layer’s goal is extracting the patterns on the short term in time-series to comprehend better the addiction between predictors to generate a homogeneous feature map. The convolutional layers are occurred by multiple filters that have w (width) and h (height) parameters are equal to the variable number of the sequence. To prevent the over fitting by decreasing the size of output in the model, the pooling layer was supplemented to the convolutional layer. The matrix of input was swept the kth filter to generate (Ghimire et al. Citation2022):
(3)
(3)
where, the operation of convolution is indicated by *, H is the vector of output, the parameters of weight are Wck and bck and the activation function is f. In the final convolutional layer, the filter number dc which is denoted by dc.h.kc is the matrix of output that computed by the convolution component. Accordingly the convolution operation’s output is
For prediction of PP and NH of HEPP, CNN layer’s output was flattened as one dimensional arrays and then was applied to the SVR input as a time sequence. One of the fundamental problem of the CNN method is the over fitting probability in the training procedure (Şahin et al. Citation2021). Because of this situation, during the training process, the model operates efficiently but its generalization is worse for the test dataset.
Generally, this situation appears if the training dataset has outlier or noise in large quantity which does not indicate the actual features of the ordered patterns. There is suggested several methods to overcome from this situation, but the foremost remedy is obtaining further data for training to reduce the over fitting. Because regularization have been better usually by training with larger quantity of dataset. Other resolutions, as well as diminishing the complexity of the structure, they are containing stopping earlier, arranging with decayed weight or dropout, normalization of the stack.
Optimization of hyper parameters
Hyperparameter optimization (HPO) is a method that discovers the best hyperparameter value combination for reaching an optimum output from the dataset in a plausible rate of time. HPO has great importance for the accuracy of the prediction of an ML algorithm. Within this study, HyperOpt (Bergstra et al. Citation2013; Komer et al. Citation2014) was used for hyperparameter optimization of all five prediction models. HyperOpt which is a hyperparameter optimization platform uses a Bayesian Optimization-Tree-based Parzen Estimator (BO-TPE) based optimization algorithm in order to adjust the machine learning model to produce a fine accuracy of prediction. When apart from HyperOpt, some algorithms of hyperparameter optimization are supporting only one model, conversely, HyperOpt can process hierarchical hyperparameters by using more than one model. Till arrived at a criterion of stopping, the TPE algorithm keeps going proposing and evaluating novel configurations of hyperparameters. All probable variations of the values are considered by HyperOpt before the determination of the best value.
The hyper parameters for the searching space that considered for the deep hybrid CNN-SVR model and the benchmarked models, were given in .
Table 3. The structures of the CNN-SVR, DBN, LSTM, BRFR and WKNNR models are improved for daily PP and NH prediction.
As shown in and , the approach consists of an Input Layer, three stratified convolutional and pooling layers that the HyperOpt hyperparameter optimization method was used for the filter size, one flattening layer that is attached to an SVR layer for the prediction of HEPP performance. The structure has max pooling of three pooling layers with 2 of Pool size and a flattening layer which generates the SVR input by creating an individual feature vector, by flattening the convolutional layers output. ReLU activation function which is applied in the convolutional layers is utilized to unravel the vanishing gradients problem, improve performance and speed up learning (Cavalli and Amoretti Citation2021). The optimization algorithm of Adam was chosen because of its computational efficiency, low memory necessity, and unchanged gradients’ diagonal rescaling and suitability for big data (Kingma and Ba Citation2014). The flattening layer is a critical component in the deep hybrid CNN-SVR model, connecting the outputs of the convolution layers and forming a flat structure. This flattened structure is then fed into the Support Vector Regression (SVR) component, which performs regression modeling to predict the target variable.
The weight update for the convolution layers is accomplished using the Adam backpropagation learning algorithm. Adam stands for Adaptive Moment Estimation and is a popular optimization algorithm commonly used in deep learning. It combines the benefits of both RMSprop and momentum-based optimization methods. The Adam algorithm utilizes various hyperparameters to control its update process. In this specific implementation; the learning rate (α) determines the step size in weight updates during training. A higher learning rate allows for larger steps but may lead to overshooting and instability, while a lower learning rate provides smaller steps but may result in slow convergence. Here, a learning rate of 0.001 is used. Adam maintains two decay rates, β1, and β2 (by equations in Ghimire et al. Citation2022), which control the exponential decay rates for the first and second moments of the gradients, respectively. These moments are estimates of the mean and uncentered variance of the gradients. Commonly, β1 has been set to 0.9 and β2 to 0.999. The epsilon (ε) is a small constant added to the denominator to prevent division by zero and numerical instability. It is set to 1 × 10⁻⁵ to ensure stable computations. As the kernel of the SVR algorithm, the Radial Basis function was utilized. The cost function of the regression model and the kernel width which have a crucial role in the accuracy and the performance of the model were deduced by HyperOpt. The Adam algorithm, with the specified hyperparameters, efficiently updates the weights of the convolutional layers during training, allowing the deep hybrid CNN-SVR model to learn and optimize its performance based on the training data. The adaptive nature of the Adam algorithm, along with the advantages of CNN's spatial feature extraction and SVR's regression modeling, enables the model to capture intricate patterns in the data and make accurate predictions for power generation in the context of Hirfanlı HEPP. Also, the possibility of getting away from the local optimum is superior because of arranging the learning speed of parameters dynamically. The epoch number and size of the batch are chosen by HyperOpt. The epoch (update of weights) indicates how many times the learning algorithm will go back and forth through the entire training dataset. In an epoch, a data string in the data set goes to the end, then waits there, after the data as much as the batch size reaches the end, the error rate is calculated and the optimization process is performed (the weights are updated). Batch size is the range of samples operated before the update of the model.
To comprehensively appraise the optimum CNN-SVR model for the prediction of the Net Head and the Power Production of HEPP, four other prediction models based on LSTM, DBN, BRFR and WKNNR models were examined. The processes of all training models were governed by using MATLAB R2020 on an Intel®Core™ i7 processor with 32 GB RAM, DL models were developed in Python 3.6 and Hyperopt-sklearn library was applicated for hyperparameter optimization.
Several approaches are used to appraise the effectiveness of the models. The metrics have own prepotency and feebleness, so the statistical metrics such as Correlation Coefficient (r), Root Mean Square Error (RMSE), Mean Absolute Error (MAE), Relative Root Mean Square Error (RRMSE) and Relative Mean Absolute Error (RMAE) were determined to benchmark the prediction models. These metrics can be computed by the EquationEquations (4)–(8) represented as below (Ghimire et al. Citation2022).
(4)
(4)
(5)
(5)
(6)
(6)
(7)
(7)
(8)
(8)
where
and
are the monitored and predicted value of Power Production, m(
) and m(
) are the monitored and predicted mean of Power Production.
For the evaluation of the performance of the model, MAE and the RMSE may be in the range of 0 when perfect value and ∞ when the worst value and r ranges from −1 to +1. Additionally RRMSE and RMAE may be in the range of 0% and 100%, if RRMSE < 10%, the level of precision is perfect, if 10% < RRMSE < 20%, it is well, if 20% < RRMSE < 30%, it is fair and if RRMSE > 30%, it is worst (Pan et al. Citation2013).
Cross-validation
Cross-validation is a statistical technique used to assess the performance and generalization capability of a machine-learning model (Ulutaş and Aslantaş Citation2023). It involves dividing the available data into multiple subsets, or ‘folds’, and using these folds for training and testing the model in a rotation. The basic idea behind cross-validation is to ensure that the model’s performance is evaluated on different subsets of data to obtain a more reliable estimate of its effectiveness. In our study, classification is carried out using the 10-fold cross-validation technique, and the results are reported.
Results
In this section, the benchmarked algorithms and the recommended hybrid CNN-SVR DL model which is constructed for the predictions of NH and PP of Hirfanlı HEPP are discussed. During the testing procedure CNN-SVR model was benchmarked with two of DL methods as LSTM and DBN also two of ML methods as BRFR and WKNNR. The numerous meteorological variables that were obtained from Kırşehir/Kaman Weather Directorate and power production data from Hirfanlı HEPP was used as input. And these meteorological variables were firstly extracted to determine the most important features by Atom Search Optimization (ASO) technique which is a MH feature selection model. Then, the selected crucial features by the ASO technique were committed in the CNN model additionally, and finally this outputs of the CNN method were applied to SVR model as input data in order to predict the net head and the power production of Hirfanlı HEPP. The selection of hyper parameter for all of the five model that were performed in the scope of this study were carried out by means of HyperOpt.
The used CNN-SVR model offers a rapid and precise method for the prediction of PP and NH of HEPP by extracting the meteorological and power generation features which are effective for PP and NH.
The deep hybrid CNN-SVR model’s performance results was given in and for training and testing, in terms of the performance metrics as r, RMSE, and MAE utilized in assessment of the prediction performance of daily NH and PP models for HEPP in and respectively. On the other hand, to discuss more particularly the suggested deep hybrid CNN-SVR model, RRMSE and RMAE parameters were also benchmarked and for both NH and PP, comparative RRMSE and RMAE values were also given in and .
Table 4. The testing performance metrics of the deep hybrid CNN-SVR (RMSE as m for NH, RRMSE and RMAE as %).
Table 5. The testing performance metrics of the deep hybrid CNN-SVR (RMSE as MWh for PP, RRMSE and RMAE as %).
As shown in for NH prediction, the deep hybrid CNN-SVR model produced highest values for literature, with r as 0.971 and lower RMSE as 0.365 MWh and MAE as 0.962 MWh. The LSTM model was followed the CNN-SVR model with r; 0.926, RMSE; 2.482 MWh and MAE; 2.193 MWh. The deep DBN model indicated the relatively worst metrics and for further ML models, WKNNR model demonstrated a relatively better performance than BRFR. In this case it was clear that deep hybrid CNN-SVR model was markedly better than other DL model of LSTM and both the ML models.
Similarly, in for PP prediction, the deep hybrid CNN-SVR model produced again relatively higher and valid values for literature, with r as 0.968, lower RMSE as 0.378 MWh and MAE as 1.279 MWh. The LSTM model was followed the CNN-SVR model again with r; 0.915, RMSE; 2.667 MWh and MAE; 1.952 MWh.
However, in fact, the CNN-SVR model performs exceedingly fine in predicting the daily NH and PP. That demonstrates that the utilized CNN-SVR model performed with the best achievement for both NH and PP by exhibiting the lowest RMSE and RRMSE values. When the proposed deep learning model is used in the prediction process and the r, RMSE, and MAE values are obtained as 0.971, 0.365 and 0.962, for NH and 0.968, 0.378 and 1.279 for PP respectively, and they are the values with the best results. Below are some examples of literature studies. These studies are compared () to the evaluation of the parameters compared to the models that we proposed better results than other methods.
Table 6. The testing performance metrics of the used ML and hybrid deep learning techniques.
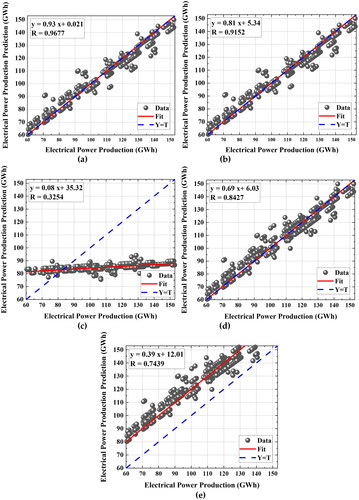
Therewithal for another performance evaluation for the CNN-SVR model was achieved by means of the scatter plot diagrams of NH vs NH prediction in , and PP vs PP prediction in . Inset given parameters were computed by using (9);
(9)
(9)
which is a linear regression equation, where y is the prediction and x is the real data. ‘r’ is the coefficient of the correlation (Ghimire et al. Citation2022). Additionally, the scatter plots revealed that the deep hybrid CNN-SVR model exhibits the best performance since the grouped scatter points were close to the regression line. Conversely, for the other models, the scatter points were far from this regression line. Harmoniously with and , and confirm that the CNN-SVR model exhibited relatively better and dependable prediction abilities for both NH and PP respectively.
Figure 7. Net head (m) vs net head prediction (m) graphs for (a) CNN-SVR, (b) LSTM, (c) DBN, (d) WKNNR, (e) BRFR (inset: red line indicates the least square regression (y = mx + c) where y is the prediction and x is the real data, additionally r is the coefficient of the correlation).
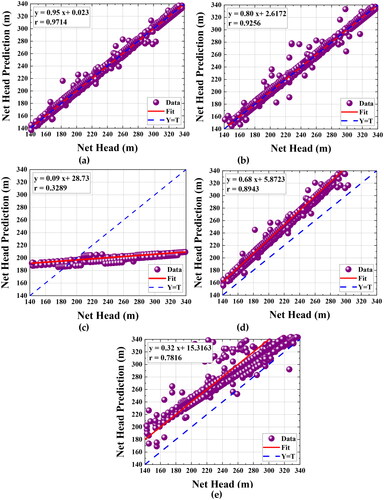
Figure 8. Power production (GWh) vs power production prediction(GWh) graphs for (a) CNN-SVR, (b) LSTM, (c) DBN, (d) WKNNR, (e) BRFR (inset: red line indicates the least square regression PP prediction = m. PP + c).
Therefore, it is clear that the CNN-SVR model could provide more accurate outcomes also for the prediction of daily PP and NH, benchmarked with two other DL and two conventional ML models. On the other hand, prediction models were benchmarked also by means of the frequency distributions of prediction errors (|PE|) as shown in and .
Figure 9. The cumulative frequency vs. prediction error (|PE|) graphs of the error for NH as of the forecast for (a) CNN-SVR, (b) LSTM, (c) DBN, (d) WKNNR and (e) BRFR.
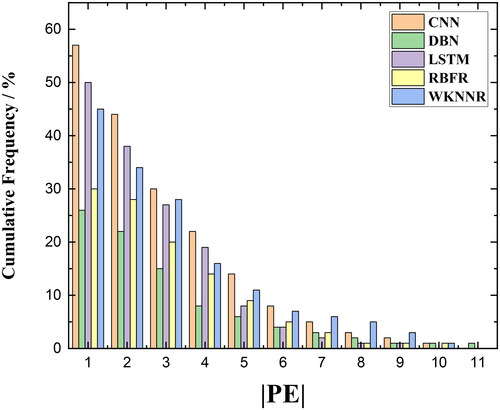
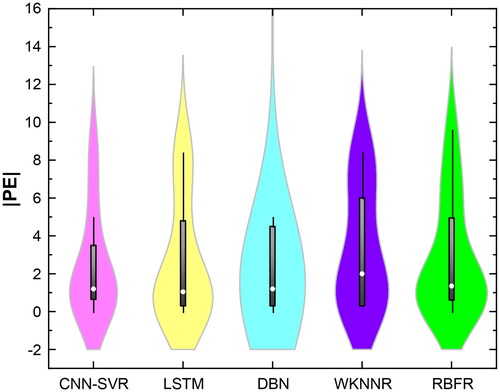
The predictions of NH by using the CNN-SVR model were determined to have the least error bracket, which compassed 57% of the testing dataset. On the other hand, LSTM, DBN, WKNNR, and BRFR compassed 50%, 26%, 45%, and 30% of the testing dataset respectively as given in . In addition to performance criteria, violin plots of the error of the NH prediction of the models |PE|, were created and given in . The distribution of the error of |PE| obtained by using the CNN-SVR hybrid model is observed clearly that it is relatively smaller than benchmarked the standalone alternative models that LSTM, DBN, WKNNR, and BRFR.
Figure 10. The violin plot for the Absolute error of the prediction of NH that produced by the used CNN-SVR model compared to the LSTM, DBN, WKNNR and BRFR models for the test process.
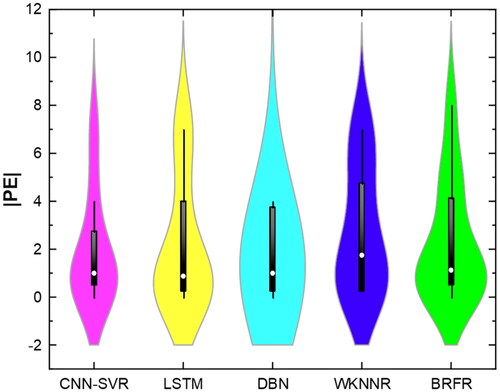
The predictions of PP by using the CNN-SVR model, were defined to have the least error bracket, which compassed 55% of the testing dataset. Nevertheless, LSTM, DBN, WKNNR, and BRFR compassed 48%, 25%, 43%, and 29% of the testing dataset respectively as shown in . In addition to performance criteria violin plots of the error of the PP prediction of the models |PE| were created and given in . The distribution of the error of |PE| obtained by using CNN-SVR hybrid model has observed clearly that it is relatively smaller than benchmarked the standalone alternative models that LSTM, DBN, WKNNR, and BRFR.
Figure 11. The cumulative frequency vs. prediction error (PE) graphs of the error for PP as of the forecast for (a) CNN-SVR, (b) LSTM, (c) DBN, (d) WKNNR and (e) BRFR.
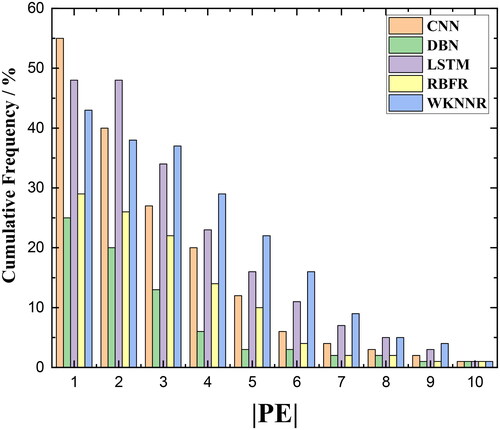
Figure 12. The violin plot for the Absolute forecast error of PP that produced by the used CNN-SVR model compared to the LSTM, DBN, WKNNR and BRFR models for the test process.
In accordance, with and , and , the deep hybrid CNN-SVR model not only accurately predicts the daily PP by providing error prediction within the band of the smallest magnitude, but also demonstrates the PP is closely related to the meteorological data.
Consequently, based on , the graphs clearly depicted that the CNN-SVR succeeded by the greatest prediction accuracy for PP. Consonant with previous evidence as given in , the CNN-SVR model performed the best. For this reason, the deep hybrid CNN-SVR method appears to have improved prediction abilities that authorize dependable prediction of PP.
In accordance, with and , and and , the deep hybrid CNN-SVR model not only accurately predicts the daily PP by providing error prediction within the band of the smallest magnitude, but also demonstrates the dependency of PP to the NH.
Consequently, based on , the graphs clearly depicted that the CNN-SVR succeeded by the greatest prediction accuracy for both NH and PP. Consonant with previous evidence as given in and , the CNN-SVR model performed relatively better. For this reason, the deep hybrid CNN-SVR method appears to have improved prediction abilities that authorize dependable prediction of NH and PP.
Conclusion
This research proposes a CNN-SVR model to predict the power production of Hirfanlı HEPP one day ahead using meteorological parameter information. These are the conclusions from this study:
An efficient deep hybrid CNN-SVR model has been performed in this research which was obtained by integrating CNN and SVR models for the prediction of NH and PP. As author’s knowledge, the hybrid model was not used for hydroelectric energy before. Kaman Meteorology Directorate and Hirfanl HEPP collected meteorological data and data on power production over a 15-year period, from 1 January 2007 to 31 December 2021, and the author organized the data to produce an original dataset.
To improve the models, the ASO algorithm which is a metaheuristic FS algorithm was performed to select the optimum features of the input data and obtained 16 features in instead of 41 variables in have been enough for the prediction of NH and PP. For the prediction, the performance of the utilized CNN-SVR model was compared to four other models which contained two machine learning as well as two deep learning models such as KNNR, RBFR LSTM, and DBN.
The results of the comparison of the used CNN-SVR model with other alternative models demonstrated the CNN-SVR model has performed effectively by means of the higher prediction accuracy and performance metrics and lower relative error. The CNN-SVR model proved the best performances, both among the other four models and of the literature with the highest amount of r as 0,971 and the lowest RMSE as 0.365 m with low values of MAE, RRMSE, and RMAE besides for NH, and r as 0.968 and RMSE as 378 kW for PP.
On the other hand, the benchmarking of the cumulative frequency values of the models indicated that the CNN-SVR model produced the best ratio with 57% for NH in the lowest range of error at 0.365 m. The best performances between the other four models were obtained for LSTM with 50% in DL methods, and also for WKNNR with 45% in ML methods respectively as shown in .
The best performances for PP prediction, between the other four models were obtained for LSTM with 48% in DL methods, and also for WKNNR with 43% in ML methods respectively as shown in . On the other hand, the CNN-SVR model produced the best ratio with 55% for PP in the lowest range of error in 20 kW.
The reliability of CNN-SVR is evident as it exhibits the lowest uncertainty compared to other models. By combining the strengths of the two models, CNN-SVR outperforms KNNR, RBFR LSTM, and DBN.
For this reason, it is clearly supported that the utilization of the deep hybrid CNN-SVR model is an efficient optional tool for the prediction of the power production parameters. As well as the tool may be accordingly explored for utilization as an artificial intelligence tool for advancing alternative/renewable energy research and planning.
In the future, the proposed model may be researched for the prediction of the electrical power production parameters of more than one grouped HEPPs for a local area or a HEPP at real-time solutions in respect to the worst-case by means of the rapidly changing situation, for instance, a squall or a flood. Nevertheless, it is thought that the tool may help energy producers by enabling better optimization of hydroelectric power production with the electrical power grids.
Discussion
Hydropower production is influenced by numerous factors, including geographical location, weather patterns, and the design of the hydropower plant. Precipitation directly impacts reservoir water levels, subsequently affecting hydropower production. Drought conditions and environmental factors that reduce water availability pose a significant threat to hydropower production.
Understanding the influence of meteorological variables on hydroelectric power plants is vital for enhancing their efficiency. Accurate prediction of power generation capacity is pivotal for the effective management of hydropower plants. It is significant that the hydroelectric energy industry has confidence in precise predictions of the meteorological variables that pay attention to environmental effects containing factors such as evaporation, temperature, snow thickness, rainfall, etc. that affect the water level of HEPP and therefore power production. Electrical energy received from HEPPs may be discontinuous owing to the environmental effects therefore, precise prediction models are required by the hydroelectric energy industry. When faced with a drought, a power company can compensate for reduced inflow by increasing electricity production from alternative sources. Additionally, the insights from our study can contribute to grid stability, enabling energy companies to better manage energy demand and supply by accurately predicting hydropower production.
In this study, a deep hybrid CNN-SVR model was trained by using an input dataset, that consisted of daily meteorological variables (i.e. humidity and temperature parameters, precipitation, etc.), and was enriched by the observed HEPP parameters (i.e. Lake or Pool Level, Leaving Water Level, Ratio of Water to Energy, Leakage and Other Water Losses, etc.). For this reason, the suggested trained deep hybrid CNN-SVR model can be utilized to follow the electrical power production of HEPP, for inter-daily or a certain scale since the accurate forecasting of NH and PP, additionally, the model may be helpful for the energy industry to make the decision to the reasonable way to interconnect the HEPP to the electricity grids.
The study highlights the benefits of series hybridization in enhancing the performance of standalone models. The hybrid structure facilitates information sharing between models, leading to improved overall performance.
Beyond the energy sector, the utilized model can also find application as early warning systems in various fields. It can be utilized for monitoring droughts and floods, contributing to the field of advanced engineering informatics. Effective handling of large datasets and accurate quantification of uncertainty are crucial aspects, and this paper introduces a deep learning model, CNN-SVR, capable of addressing these requirements. CNN-SVR model was obtained as the best model that indicates the minimum RMSE, MAE, RRMSE, and RMAE amounts and the highest r for both NH and PP.
The acceptable reasons why DL techniques are superior to traditional prediction models are the ability of more automatically extract the features of the dataset without knowing the details of the background of the dataset, their strong ability of generalization, and their capability the interaction with multiple big datasets. The represented outcomes so far demonstrate the excellent ability of the suggested CNN-SVR model for the predictions of NH and PP. Notably, this model demonstrates superior performance in quantifying uncertainty and handling large datasets, making it valuable for advanced engineering informatics systems.
This study makes a valuable contribution to the advancement of energy engineering systems. Specifically, it focuses on developing energy monitoring systems applicable to diverse settings such as buildings, factories, and hydropower plants. Energy managers are continuously seeking innovative technologies for monitoring energy resources, and our models provide the capability to create energy consumption sensors and predict patterns. This model offers practical solutions for optimizing energy consumption patterns.
| Abbreviation | ||
| HEPP | = | hydroelectric power plant |
| NH | = | the water level of HEPP (Net head) |
| PP | = | hydroelectric power production |
| CNN-SVR | = | deep hybrid convolutional neural network-support vector regression |
| CNN | = | convolutional neural network |
| SVR | = | support vector regression |
| ASO | = | atom search optimization |
| FS | = | feature selection |
| ML | = | machine learning |
| BRFR | = | boosting random forest regression |
| WKNNR | = | weighted K-nearest neighbor regression |
| DL | = | deep learning |
| LSTM | = | (long-short term memory) |
| DBN | = | deep belief network |
| r | = | correlation coefficient |
| ANN | = | artificial neural network |
| MLP | = | multi-layer perceptron |
| LM | = | Levenberg–Marquardt algorithm |
| SVM | = | support vector machine |
| ANFIS | = | neuro-fuzzy adaptive system |
| GWO | = | grey wolf optimization algorithm |
| RNN | = | recurrent neural network |
| WT | = | wavelet transforms |
| RMSE | = | root mean square error |
| MAE | = | mean absolute error |
| RRMSE | = | relative root mean square error |
| RMAE | = | relative mean absolute error |
| CNNE-MUPE-GPRE | = | convolutional neural network-multilayer perceptron-Gaussian process regression |
| MH | = | meta-heuristic |
| HyperOpt | = | hyperparameter optimization |
| BO-TPE | = | Bayesian optimization-tree-based Parzen estimator |
| ReLU | = | rectified linear units |
| Adam | = | adaptive moment estimation |
Acknowledgment
The author wants to thank to Kaman/Kırşehir Weather Directorate and Hirfanlı Hydropower Station for the provided data.
Data availability
The datasets generated during and/or analysed during the current study are available from Kaman/Kırşehir Weather Directorate and Hirfanlı Hydropower Station and from the corresponding author on reasonable request.
Disclosure statement
No potential conflict of interest was reported by the authors.
References
- Abdulkadir TS, Salami AW, Anwar AR, Kareem AG. 2013. Modelling of hydropower reservoir variables for energy generation: neural network approach. Ethiop J Env Stud Manag. 6(3):310–316. doi: 10.4314/ejesm.v6i3.12.
- Barzola-Monteses J, Gómez-Romero J, Espinoza-Andaluz M, Fajardo W. 2022. Hydropower production prediction using artificial neural networks: an Ecuadorian application case. Neural Comput Appl. 34(16):13253–13266. doi: 10.1007/s00521-021-06746-5.
- Bergstra J, Yamins D, Cox DD. 2013. Hyperopt: a python library for optimizing the hyperparameters of machine learning algorithms. In Proceedings of the 12th Python in science conference (13). doi: 10.25080/Majora-8b375195-003.
- Boadi SA, Owusu K. 2019. Impact of climate change and variability on hydropower in Ghana. Afr Geograph Rev. 38(1):19–31. doi: 10.1080/19376812.2017.1284598.
- Castangia M, Aliberti A, Bottaccioli L, Macii E, Patti E. 2021. A compound of feature selection techniques to improve solar radiation forecasting. Expert Syst Appl. 178:114979. doi: 10.1016/j.eswa.2021.114979.
- Cavalli S, Amoretti M. 2021. CNN-based multivariate data analysis for bitcoin trend prediction. Appl Soft Comput. 101:107065. doi: 10.1016/j.asoc.2020.107065.
- Chen CW, Tsai YH, Chang FR, Lin WC. 2020. Ensemble feature selection in medical datasets: combining filter wrapper and embedded feature selection results. Expert Syst. 37(5):12553. doi: 10.1111/exsy.12553.
- Cihan P, Kalipsiz O, Gökçe E. 2017. Hayvan Hastaliği Teşhisinde Normalizasyon Tekniklerinin 508 Yapay Sinir Aği Ve Özellik Seçim Performansina Etkisi. Electron Turkish Stud. 12(11): 59–70.
- Cobaner M, Haktanir T, Kisi O. 2008. Prediction of hydropower energy using ANN for the feasibility of hydropower plant installation to an existing irrigation dam. Water Resour Manage. 22(6):757–774. doi: 10.1007/s11269-007-9190-z.
- Condemi C, Casillas-Perez D, Mastroeni L, Jiménez-Fernández S, Salcedo-Sanz S. 2021a. Hydro-power production capacity prediction based on machine learning regression techniques. Knowl Based Syst. 222:107012. doi: 10.1016/j.knosys.2021.107012.
- Condemi C, Mastroeni L, Vellucci P. 2021b. The selection of predictive variables in aggregate hydroelectric generation models. JEM. 14(1). doi: 10.21314/JEM.2020.215.
- Dehghani M, Riahi-Madvar H, Hooshyaripor F, Mosavi A, Shamshirband S, Zavadskas EK, Chau KW. 2019. Prediction of hydropower generation using Grey Wolf optimization adaptive neuro-fuzzy inference system. Energies. 12(2):289. doi: 10.3390/en12020289.
- Drakaki KK, Sakki GK, Tsoukalas I, Kossieris P, Efstratiadis A. 2022. Day-ahead energy production in small hydropower plants: uncertainty-aware forecasts through effective coupling of knowledge and data. Adv Geosci. 56:155–162. doi: 10.5194/adgeo-56-155-2022.
- Ehtearm M, Ghayoumi Zadeh H, Seifi A, Fayazi A, Dehghani M. 2023. Predicting hydropower production using deep learning CNN-ANN hybridized with Gaussian process regression and Salp algorithm. Water Resour Manage. 37(9):3671–3697. doi: 10.1007/s11269-023-03521-0.
- Ekanayake P, Wickramasinghe L, Jayasinghe JJW, Rathnayake U. 2021. Regression-based prediction of power generation at samanalawewa hydropower plant in Sri Lanka using machine learning. Math Prob Eng. 2021:1–12. doi: 10.1155/2021/4913824.
- Atlası E. 2023. https://www.enerjiatlasi.com/elektrik-uretimi/. [accessed 2023 Feb 4].
- Fugazza D, Manara V, Senese A, Diolaiuti G, Maugeri M. 2021. Snow cover variability in the greater alpine region in the MODIS era (2000–2019). Remote Sens. 13(15):2945. doi: 10.3390/rs13152945.
- Gallardo-Saavedra S, Redondo-Plaza A, Fernández-Martínez D, Alonso-Gómez V, Morales-Aragonés J, I, Hernández-Callejo L. 2022. Integration of renewable energies in the urban environment of the city of Soria (Spain). World Develop Sustain. 1:100016. doi: 10.1016/j.wds.2022.100016.
- Gao B, Huang X, Shi J, Tai Y, Zhang J. 2020. Hourly forecasting of solar irradiance based on CEEMDAN and multi-strategy CNN-LSTM neural networks. Renew Energ. 162:1665–1683. doi: 10.1016/j.renene.2020.09.141.
- García-Hinde O, Terrén-Serrano G, Hombrados-Herrera MÁ, Gómez-Verdejo V, Jiménez-Fernández S, Casanova-Mateo C, Sanz-Justo J, Martínez-Ramón M, Salcedo-Sanz S. 2018. Evaluation of dimensionality reduction methods applied to numerical weather models for solar radiation forecasting. Eng Appl Artif Intell. 69:157–167. doi: 10.1016/j.engappai.2017.12.003.
- Ghimire S, Bhandari B, Casillas-Perez D, Deo RC, Salcedo-Sanz S. 2022. Hybrid deep CNN-SVR algorithm for solar radiation prediction problems in Queensland Australia. Eng Appl Artif Intell. 112:104860. doi: 10.1016/j.engappai.2022.104860.
- Guo L, Chen J, Wu F, Wang M. 2018. An electric power generation forecasting method using support vector machine. Syst Sci Control Eng. 6(3):191–199. doi: 10.1080/21642583.2018.1544947.
- Hammid AT, Sulaiman MH, Abdalla AN. 2018. Prediction of small hydropower plant power production in Himreen Lake dam (HLD) using artificial neural network. Alex Eng J. 57(1):211–221. doi: 10.1016/j.aej.2016.12.011.
- Hanoon MS, Najah Ahmed A, Razzaq A, Oudah AY, Alkhayyat A, Feng Huang Y, Kumar P, El-Shafie A. 2023. Prediction of hydropower generation via machine learning algorithms at three Gorges Dam, China. Ain Shams Eng J. 14(4):101919. doi: 10.1016/j.asej.2022.101919.
- Harvey A, Brown A, Hettiarachi P, Inversin A. 1993. Micro-hydro design manual. Intermediate Technology Publications, UK.
- Izquierdo-Monge O, Peña-Carro P, Villafafila-Robles R, Duque-Perez O, Zorita-Lamadrid A, Hernandez-Callejo L. 2021. Conversion of a network section with loads storage systems and renewable generation sources into a smart microgrid. Appl Sci. 11(11):5012. doi: 10.3390/app11115012.
- Jung J, Han H, Kim K, Kim HS. 2021. Machine learning-based small hydropower potential prediction under climate change. Energies. 14(12):3643. doi: 10.3390/en14123643.
- Kabo-Bah AT, Diji CJ, Nokoe K, Mulugetta Y, Obeng-Ofori D, Akpoti K. 2016. Multiyear rainfall and temperature trends in the Volta river basin and their potential impact on hydropower generation in Ghana. Climate. 4(4):49. doi: 10.3390/cli4040049.
- Karri RR, Wang X, Gerritsen H. 2014. Ensemble based prediction of water levels and residual currents in Singapore regional waters for operational forecasting. Environ Model Softw. 54:24–38. doi: 10.1016/j.envsoft.2013.12.006.
- Kingma DP, Ba J. 2014. Adam: a method for stochastic optimization. arXiv preprint arXiv:1412.6980.
- Komer B, Bergstra J, Eliasmith C. 2014. Hyperopt-sklearn: automatic hyperparameter configuration for scikit-learn. ICML workshop on AutoML. (9) Austin (TX): Citeseer. doi: 10.25080/Majora-14bd3278-006.
- Lopes MNG, da Rocha BRP, Vieira AC, de Sá JAS, Rolim PAM, da Silva AG. 2019. Artificial neural networks approaches for predicting the potential for hydropower generation: a case study for Amazon region. IFS. 36(6):5757–5772. doi: 10.3233/JIFS-181604.
- Özbay FA, Özbay E. 2023. An NCA-based hybrid cnn model for classification of Alzheimer’s disease on grad-cam-enhanced brain MRI images. Turkish J Sci Technol. 18(1):139–155. doi: 10.55525/tjst.1212513.
- Pan T, Wu S, Dai E, Liu Y. 2013. Estimating the daily global solar radiation spatial distribution from diurnal temperature ranges over the Tibetan Plateau in China. Appl Energy. 107:384–393. doi: 10.1016/j.apenergy.2013.02.053.
- Pan H, Lv X. 2019. Reconstruction of spatially continuous water levels in the Columbia river estuary: the method of empirical orthogonal function revisited. Estuar Coast Shelf Sci. 222:81–90. doi: 10.1016/j.ecss.2019.04.011.
- Perera A, Rathnayake U. 2020. Relationships between hydropower generation and rainfall-gauged and ungauged catchments from Sri Lanka. Math Prob Eng. 2020:1–8. doi: 10.1155/2020/9650251.
- Piri J, Shamshirband S, Petković D, Tong CW, Ur Rehman MH. 2015. Prediction of the solar radiation on the earth using support vector regression technique. Infrared Phys Technol. 68:179–185. doi: 10.1016/j.infrared.2014.12.006.
- Plucinski B, Sun Y, Wang SY, Gillies RR, Eklund J, Wang CC. 2019. Feasibility of multi-year forecast for the Colorado river water supply: time series modeling. Water. 11(12):2433. doi: 10.3390/w11122433.
- Rahman MM, Shakeri M, Tiong SK, Khatun F, Amin N, Pasupuleti J, Hasan MK. 2021. Prospective methodologies in hybrid renewable energy systems for energy prediction using artificial neural networks. Sustainability. 13(4):2393. doi: 10.3390/su13042393.
- Rodríguez F, Galarza A, Vasquez JC, Guerrero JM. 2022. Using deep learning and meteorological parameters to forecast the photovoltaic generators intra-hour output power interval for smart grid control. Energy. 239:122116. doi: 10.1016/j.energy.2021.122116.
- Rosenzweig C, Solecki WD, Hammer SA, Mehrotra S. 2011. Climate change and cities: first assessment report of the urban climate change research network. Cambridge, UK: Cambridge University Press.
- Salcedo‐Sanz S, Rojo‐Álvarez JL, Martínez‐Ramón M, Camps‐Valls G. 2014. Support vector machines in engineering: an overview. WIREs Data Mining Knowl Discov. 4(3):234–267. doi: 10.1002/widm.1125.
- Salcedo-Sanz S, Cornejo-Bueno L, Prieto L, Paredes D, García-Herrera R. 2018. Feature selection in machine learning prediction systems for renewable energy applications. Renew Sustain Energy Rev. 90:728–741. doi: 10.1016/j.rser.2018.04.008.
- Sessa V, Assoumou E, Bossy M, Simões SG. 2021. Analyzing the applicability of random forest-based models for the forecast of run-of-river hydropower generation. Clean Technol. 3(4):858–880. doi: 10.3390/cleantechnol3040050.
- Sharifzadeh F, Akbarizadeh G, Seifi Kavian Y. 2019. Ship classification in SAR images using a new hybrid CNN–MLP classifier. J Indian Soc Remote Sens. 47(4):551–562. doi: 10.1007/s12524-018-0891-y.
- Shaw AR, Smith Sawyer H, LeBoeuf EJ, McDonald MP, Hadjerioua B. 2017. Hydropower optimization using artificial neural network surrogate models of a high-fidelity hydrodynamics and water quality model. Water Resour Res. 53(11):9444–9461. doi: 10.1002/2017WR021039.
- Şahin ME, Ulutaş H, Yüce E. 2021. A deep learning approach for detecting pneumonia in chest X-rays. Eur J Sci Technol. 28:562–567. doi: 10.31590/ejosat.1009434.
- Sorgula Ş. 2023. Available online: https://sehirsorgula.com/kirsehir-yol-tarifi/. (accessed on 04.02
- Ulutaş H, Aslantaş V. 2023. Design of efficient methods for the detection of tomato leaf disease 522 utilizing proposed ensemble CNN model. Electronics. 12(4):827. doi: 10.3390/electronics12040827.
- Yildiz C, Açikgöz H. 2021. Forecasting diversion type hydropower plant generations using an artificial bee colony based extreme learning machine method. Energy Sources B: Econ Plan Policy. 16(2):216–234. doi: 10.1080/15567249.2021.1872119.
- Zhang X, Liu P, Zhao Y, Deng C, Li Z, Xiong M. 2018. Error correction-based forecasting of reservoir water levels: improving accuracy over multiple lead times. Environ Model Softw. 104:27–39. doi: 10.1016/j.envsoft.2018.02.017.
- Zolfaghari M, Golabi MR. 2021. Modeling and predicting the electricity production in hydropower using conjunction of wavelet transform, long short-term memory and random forest models. Renew Energy. 170:1367–1381. doi: 10.1016/j.renene.2021.02.017.