Abstract
Successful implementation of natural resource planning and land management systems requires understanding of how land use and land cover (LULC) have changed in the past and how they will change in the future, taking into account both space and time. The Yayo Coffee Forest Biosphere Reserve (YCFBR), in southwestern Ethiopia, is currently experiencing the consequences of different human actions such as wildfires and the expansion of coffee plantations. Although the Biosphere Reserve (BR) has undergone significant changes and efforts since it was registered by UNESCO in 2010 as a high biodiversity area of international importance, there is still a lack of information about the anticipated changes in LULC in the future. The primary aim of the study is to simulate the potential changes in LULC in the YCFBR area for the upcoming three decades. In this study, we utilized Landsat satellite imagery taken in 1992, 2007, and 2022 for analysis. The findings suggest that the agricultural area is expected to grow from 20.3% in 2022 to 24% in 2052, while the proportion of open forest is predicted to rise from 13.4% in 2022 to 18% in 2052. In addition, there is an anticipated decrease in both high forest and grazing lands. High forest is expected to decline from 50.1% in 2022 to 40% in 2052, while grazing lands are projected to decrease from 8.3% in 2022 to 6% in 2052. Thus, the study revealed a significant shift of grazing land to agriculture and high forest to more open forest types. We recommend a proper land use zoning to prevent further loss of the forest cover due to human activities and also restore the degraded parts of the area.
1. Introduction
Effective implementation of natural resource planning and land management systems requires analysis of existing and historical trends of LULC change at both spatial and temporal scales. Such studies are the main tool for decision support and land planning at the global, regional, or local level requiring an understanding of LULCC (Tian et al. Citation2018; Riddiford Citation2021). LULC modeling approaches consider historical patterns, population growth, topography, and elevation patterns (Sarkar and Chouhan Citation2019; Kafy et al. Citation2020). Dynamic Land Use (LU) Simulation provides spatial predictions and insights for land management and policy-making, guiding land cover (LC) management strategies and helping local authorities prepare for future landscape changes. It also improves our understanding of the human-environment interactions that lead to landscape changes (Terrado et al. Citation2016). Simulation approaches in particular can help to create effective LU management plans. Understanding the impact of future LULC and identifying key drivers is critical to decision-making. Simulation and prediction of LULC changes play an important role in understanding forest fragmentation, biodiversity loss and future management plans (Paz-Kagan et al. Citation2014; Dayamba et al. Citation2016).
Remote sensing (RS) techniques can help to identify possible future LU change (Mallupattu and Sreenivasula Reddy Citation2013). The use of spatial models is one of the starting points to understand the dynamics of many natural systems, to develop hypotheses, to make predictions and to assess LU histories (Zhang and Tang Citation2023). RS and geographic information systems (GIS) are widely used in studies of LU and land LC change (Mishra et al. Citation2016; Hua Citation2017). GIS provides a flexible foundation for collecting digital data for change detection and prediction, while RS discovers and monitors LUs of varying sizes. To study historical and current changes in LULC, researchers typically use the Land Change Modeler (LCM) included in the TerrSet model (Reddy et al. Citation2017; Leta et al. Citation2021; Tariq et al. Citation2022; Tariq and Mumtaz Citation2023).
The combination of RS, GIS and CA-Markov models has improved the evaluation of changes in LULC and facilitated predictions for the future (Khwarahm et al. Citation2021; Palmate et al. Citation2022). The Cellular Automata (CA) Markov model, which merges the advantages of Markov and CA models in predicting Spatio-temporal LULC dynamics, has proven its capability of generating precise outcomes in several investigations (Yuan et al. Citation2016; Yulianto et al. Citation2016). Due to its impressive capabilities in simulating changes in LU and accurately predicting long-term impacts, it has become a widely used indicator for assessing how human activities affect the land. A Markov model uses the preceding state to forecast the upcoming state. This is done by creating a matrix that shows the likelihood of LU change from one time period to another (Roy et al. Citation2015; Hyandye and Martz Citation2017; Zadbagher et al. Citation2018).
Ethiopia, like many other countries in sub-Saharan Africa, has been facing various challenges resulting from the fast and extensive changes in LULC since the early 1900s (Kindu et al. Citation2013; Lemenih et al., Citation2014). The country is being severely impacted by land degradation, with 85% of its land area suffering from moderate to very severe degradation. This is resulting in an estimated annual loss of US$4.3 billion (Nkonya et al. Citation2014). In contrast, the arid and semi-arid areas, including the swampy areas of the Central Rift Valley, are experiencing significant increases in farmland as a result of the clearing of forests and grasslands (Temesgen et al. Citation2013; Meshesha et al. Citation2014; Ariti et al. Citation2015).
Furthermore, there are several factors within the country that impact the genetic resources of its plants, resulting in genetic decline. Some of the issues identified were regular droughts in certain areas with a wide range of crops, the uncontrolled expansion of single foreign crop types that displaced the genetic variation of local crops, the decline of ecologically sustainable agricultural systems and the division of land into smaller fragmented plots. Clearing vegetation to enhance and extend agriculture, along with extensive logging for the purposes of construction and fuelwood, are the primary and easily identifiable causes (Fekensa et al. Citation2016). LULC changes are constantly occurring in rural areas, characterized by the prevalence of agriculture and human settlements in the country. Recent research indicates that there is a growing trend of LULC change. This change has manifested in various regions of Ethiopia, with agricultural land expanding while natural forests are being depleted. These observations have been documented by multiple studies (Kindu et al. Citation2016; Gashaw et al. Citation2018). Approximately 66.2% of the forested area in Munessa-Shashemene located in Oromia, Ethiopia, was transformed into agricultural land (Kindu et al. Citation2013). On the other hand, the reforestation and restoration efforts conducted by a community in Ethiopia’s Chemoga Blue Nile River Basin resulted in a nearly 27% growth in forest area (Munro et al. Citation2008).
The country also adopts and implements various environmental policies to reduce the impact of human activities, counteract land degradation and support land rehabilitation efforts. This includes the declaration and registration of BRs by UNESCO to protect areas of biodiversity hotspots in the country of Ethiopia (Mengist et al. Citation2021), but their impact is generally limited as they are less supported by tools to predict possible future LULC changes (Terrado et al. Citation2016). In addition, in the countryside, expansion in built-up areas has accelerated in recent years since the 1991 change of government and subsequent LU policy reforms (Meire et al. Citation2013). Thus, the LULCC and its ongoing impacts poses a serious threat to environmental resources, including biodiversity and/or habitats (Arai and Azri Citation2019). Land managers and policy makers are increasingly concerned about how to improve land management while minimizing impacts on biodiversity and associated ecosystems. However, major gaps exist in understanding the spatial and temporal ecology of biodiversity, ecosystem goods and services. This affects the ability to manage landscapes sustainably (Gonthier et al. Citation2014).
The YCFBR is a significant area within the eastern Afromontane known for its rich biodiversity, particularly in bird species and montane rainforest remains that contain wild coffee plants. It is recognized for having a wide range of plant species, which helps in preserving genetic resources (Fekensa et al. Citation2016; Dorresteijn et al. Citation2017). In recent times, however, the area has experienced the influence of different human activities that have had an impact on it. These activities include the occurrence of wildfires for the purpose of traditional wildlife hunting, the use of smoke to gather honey from beehives in a traditional way, and the deliberate burning of grasslands to stimulate the growth of fresh, new grass. Moreover, there is rapid encroachment into the BR areas due to the expansion of coffee plantations in the area (Buechley et al. Citation2015; Getahun and Keno Citation2019). Similarly, development projects such as the Geba hydropower dam, Yayo coal mining, and Yayo fertilizer industry, and wide-scale road construction, and electric transmission line projects in, and around YCFBR have threatened the biodiversity of the area (Huluka and Wondimagegnhu Citation2019; Daba and You Citation2022).
Despite the notable efforts, and positive contributions towards the YCFBR by different initiatives, particularly after its registration by UNESCO in 2010 as a high biodiversity area of international importance there is still a lack of adequate information regarding the LULC Change especially regarding the current, and upcoming changes in LULC. There has been no comprehensive analysis of past LULC changes in the BR using simulation and prediction methods. So, it is important to study past LULC changes, and predict future changes in order to effectively preserve biodiversity in a sustainable manner. This study sought to address the following questions: (1) What were the historical trends of LULC change in YCGBR over the past three decades? (2) Which specific LULC classes have changed into different classes during the same time period (1992–2022)? (3) What can be predicted about the future trends of LULC dynamics in the next 30 years? (4) Which LULC classes are expected to undergo change into other classes in the future by 2052? This study is crucial in providing empirical evidence for past, and potential future patterns of LULC dynamics in YCFBR, which will assist ecologists, and decision-makers in the field of biodiversity conservation to develop a LU plan that prioritizes sustainable biodiversity conservation efforts in the area. The aim of this research was to model, and predict the LULC changes expected to occur in the YCFBR over the next 30 years.
2. Materials and methods
2.1. The study area
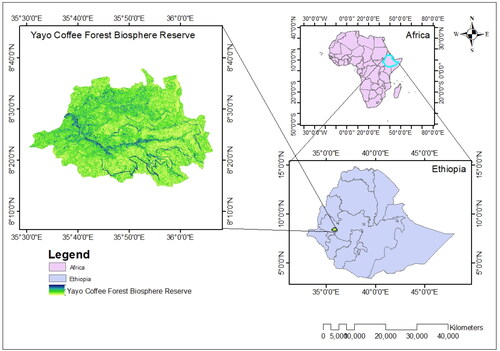
YCFBR is located in southwest Ethiopia in the Oromia National Regional State, in the Ilu Aba Bora, and Buno-Bedele zones, 510 km Southwest of Addis Ababa, Ethiopia. It is one of the five BRs in Ethiopia, and is part of the Eastern Afromontane Biodiversity Hotspot in the country. It is also one of the largest and most important forest areas with wild populations of Coffee arabica diversity. It was registered as a UNESCOBR in June 2010, and has three management zones: core (277.33 km2), buffer (215.52 km2), and transitional zones (1177.36 km2). The core zone is fully protected, while the buffer zone allows anthropogenic entrance if consistent with reserve objectives. The transitional zone includes agricultural land, wetlands, grasslands, settlements, and forest fragments (Gole et al., Citation2009). The geographical location of the area lies within 8° 0′ 10ʺ to 8° 40′ 0ʺ N and 35° 30′ 0ʺ to 36° 0′ 0ʺ E ().
Figure 1. Map of YCFBR, southwestern Ethiopia.
2.1.1. Geological settings of the study area
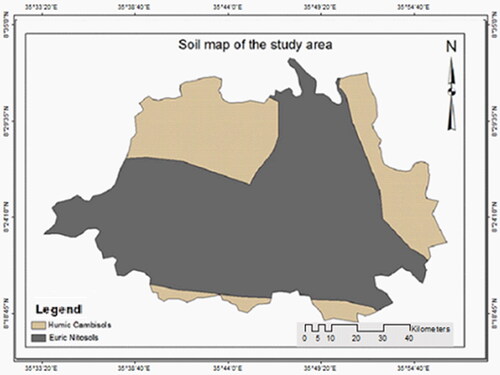
The YCFBR land spans from flat plateaus to steep slopes, with altitudes ranging from 1,100 m to 2,337 m. The area contains small streams, and tributaries of the Geba River. The area is characterized by three geologic resources: the Alghe Group, Nazret Series, and Mekonnen Basalt (Abiye Citation2008). The YCFBR area also has two common soil groups, namely humic Cambisols, and Eutric Nitosols (FAO 1974; Regassa et al. Citation2023) ().
Figure 2. Soil group of YCFBR.
2.1.2. Climate and rainfall
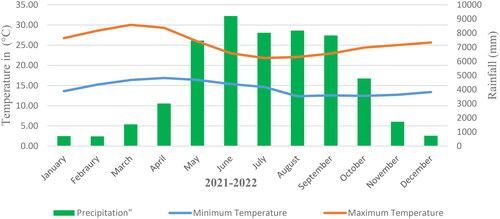
Based on the NASA Power Meteorological data sets for 2021–2022, YCFBR experiences annual rainfall ranging from 9210.74 mm to 686.58 mm, with high rainfall between June and August and low rainfall in January and February (). The area experiences the warmest temperatures from February to April and the coldest from August to October, with monthly maximum and minimum temperature ranging from 30.05 °C to 12.34 °C, respectively ().
Figure 3. Monthly temperature and rainfall of YCFBR.
Source: (NASA/POWER; http://power.larc.nasa.gov).
2.2. Data used
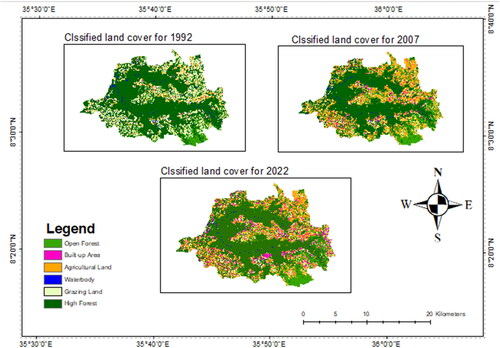
This study utilized remotely sensed Landsat images from 1992, 2007, and 2022 (Landsat 5 TM (1992 & 2007), and Landsat 8 OLI (2022), which are downloaded from the USGS (http://glovis.usgs.gov). The 15-year interval between images was considered to capture general patterns of all LULC changes over an adequate time interval, particularly following Ethiopia’s 1991 LU policy change. Images were preprocessed and classified using the supervised classification method in Erdas Imagine 2015 ( and Appendix B, supplementary file).
Table 1. Descriptions of Landsat images used for the study.
Furthermore, we considered spatial variables as constraints, and factors for LULCC in the BR based on the history, review of published literature, and policy reports (Fekensa et al. Citation2016). They include existing distances from road networks, distances to building areas or core residential areas, distances from rivers, slopes, etc. ( and ). These contributors to different LUs were normalized between 0 and 255 by fuzzification. 255 indicates the maximum probability of change, and 0 indicates no change, allowing qualitative assessments to be transformed into quantitative data by providing more logical, and concise results (Tayyebi et al. Citation2011).
Figure 4. Factor and constraints maps of YCFBR.
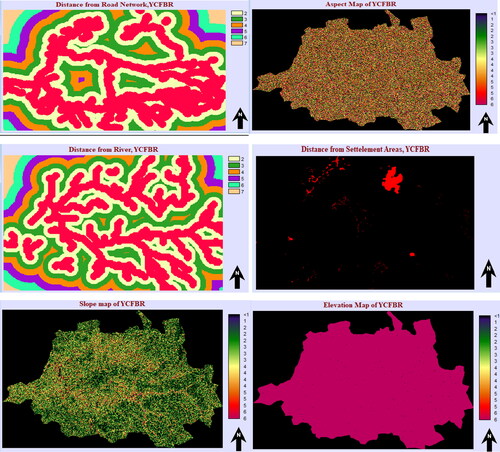
Table 2. Sources of factors and constraints of LULC changes.
2.3. Method
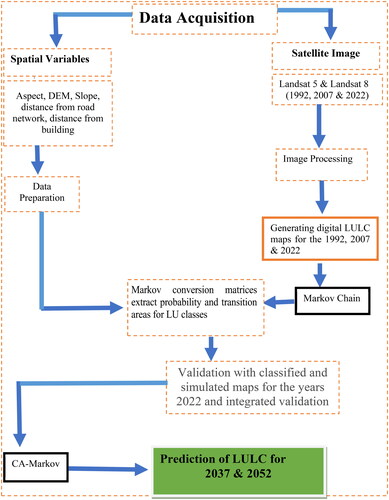
Simulations for possible LUC for the years 2022–2052 were performed with the CA Markov model using TerrSet 2020 v19.0.7. Markov models are widely used to simulate, and predict LULC and to account for future LU requirements (Tiejun et al. Citation2012). Traditional models struggle with spatial analysis, and mapping of projected land needs (Chen et al. Citation2015). CA Markov models provide powerful dynamic simulation capabilities, and long-term forecasting capabilities () (Li et al. Citation2023). TerrSet Software’s LCM uses two techniques to evaluate predicted LULC and predict future maps.
Figure 5. Flowchart of the methodology.
2.3.1. Historical change analysis
The study analyzed historical LULC changes between 1992 and 2022 using the LCM. It focused on noticeable changes, and identified the main contributors. Spatial trend maps were created for visualization, and used in the next step of the simulation. The map also included areas that remained unchanged between 1992 and 2022.
2.3.2. Transition potentials modeling
The study analyzed land potential transitions between 1992 and 2022 using LCM transition potential modeling. Six explanatory variables were selected, including distance from the road, distance from buildings, distance from rivers, slope, aspect, and elevation ( and ). To model the transition potential, a multi-layer perceptron (MLP) neural network was used, which was recommended by the LCM developer as the most robust (Verma and Kumar Citation2022). The model selection involved optimizing the number of hidden layers, and neurons per layer using training data (Verma and Kumar Citation2022).
2.3.3. Change prediction
Finally, based on the 1992 and 2007 rates of change and the transition probabilities for 2007 and 2022 (Appendix A, supplementary file and ), we simulated and predicted the LC in 2022, 2037 and 2052 using an MLP Markov chain model (Hua Citation2017). Finally, the LULC for the years 2037 and 2052 was projected using the transition probability images, the basemap (Appendix B, supplementary file), and the transition suitability image.
2.3.4. Model validation
The model was validated by comparing the simulated 2022 LC to the 2022 classified LC map in ERDAS Imagene 2015. The built-in TerrSet validation tool was used (Pontius and Batchu Citation2003; Subedi et al. Citation2013; Ngoy and Shebitz 2021) (Appendix C and Appendix D, supplementary file), and cross-tabulations were performed between the two LC maps following Ariza-Lopez et al. (Citation2018).
2.3.5. Forest land cover types
A high forest is a forest consisting of trees of various ages, primarily originating from natural seed dispersion. This refers to a forest area where the extent of canopy cover ranges from 40% to 70% or even higher (Perkins Citation2007; Van Bloem et al. Citation2007). However, open forests can be described as a fire-dependent bilayer ecosystem consisting dominant upper story filled with tree species that are tolerant to fires, and an herbaceous ground layer. Most of the time, these forests emphasize the presence of herbaceous plants in the undergrowth. In certain cases, they may also have short-lived stages of successional forests. Open forests typically have a sparse presence or even the absence of mid-story trees, and their understory layers have a moderate level of canopy cover, allowing for a dense, and diverse herbaceous understory (Fang et al. Citation2014; Hutchinson et al. Citation2016; Hanberry Citation2021). Based on this understanding, when it comes to the YCFBR, we classify high forests as dense forests that are mainly found in the buffer, and core zones of the BR. These areas have intact forests and exhibit higher genetic diversity compared to open forests, whereas, open forests, are a forest with sparse forest cover, especially in this study case, areas with coffee forests in the transition zone of BR ().
Table 3. LULC classification Scheme used in the study.
Table 4. (a,b) Markov chain matrix of LULCs transition probabilities for LULC 1992–2007. (a) and 2007–2022 (b).
3. Results
3.1. Model validation results
The model validation results indicated that the classified map of 2022 and the simulated map of 2022 showed high accuracy, i.e. M (m) is 0.8706 (Appendix D, supplementary file). The four agreement components: (i) agreement due to chance, and no information of quantity (0.08445), (ii) The agreement due to quantity (0.2864), (iii) stratification (0.0000), and iv) grid cell level location (0.5634) (Appendix D, supplementary file) confirms this high accuracy level of the model. Moreover, the various elements supported the concept of these maps accurately indicating the amount of each class within each layer, and the positioning of each category at the grid cell level within each layer. In general, the findings demonstrate a significant degree of precision between the two maps. The overall kappa indices, derived from MLP validation, indicate a high level of accuracy in comparing simulated, and classified LULC maps for 2022.The standard kappa (Kstandard) is 0.8471; Kappa for no information (Kno) is 0.8254, Kappa that indicates how well the grid cells are located on the landscape (Klocation) is 0.8136, and Kappa for stratum-level location (KlocationStrata) is 0.8688 (Appendix D, supplementary file).
3.2. Historical LULC change of YCFBR (1992–2022)
3.2.1. Gain, losses, net change and Contribution by LU classes
YCFBR's historical LULCC over the period 1992–2022 shows both gains and losses, although characterized by very contrasting changes between LU classes, as shown in , where the green color represents gains, and the wine color represents losses per LULC class in km2. The four LC types that experienced gains during the time series between 1992 and 2022 were agricultural land (261.98 km2), open forest (145.70 km2), built-up areas (i.e. 113 km2), and grazing land (40.31 km2) (). The model found that these LU classes (agriculture, open forest, and built-up areas) experienced minor losses, while the greatest loss over time was experienced by grazing land (285.36 km2), followed by high forest (217.70 km2), and water body (9.82 km2) LU classes ().
Figure 6. (a–c) Gains and losses, Net change, and contributors LULC changes. (a) Gains and losses. (b) Net change. (c) Contributors.
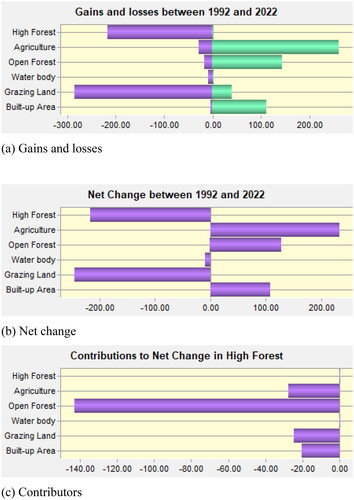
Additionally, the LCM model provides information on the net change, which is the difference between the gains, and losses of each class; accordingly, the greatest net change was observed on grazing land with 245.05 km2, and the smallest net change was on the water body with 9.08 km2 (). On the other hand, the most contributions towards the net change experienced by open forests were from the high forest (142.93 km2), followed by agriculture at 27.80 km2, grazing land (24.77 km2), and built-up area (20.34 km2) ().
3.2.2. Transition model
Using the six explanatory variables, and the 1992 and 2007 LULC maps, we trained an MLP neural network model for the transition submodel within LCM. The model achieved an 82% accuracy rate on all variables, where a skill value of 0.76 (Appendix E (a-c), supplementary file) is above the values suggested by the software developer (Elmes et al. Citation2020) with all variables, which is nearly comparable with the accuracy result of 83% achieved by Ngoy et al. (Citation2021). Additionally, it is nearly the same as the accuracy result of 83.52% achieved by Inne et al. (Citation2021), using the same model, CA-Markov. The skill measure is the difference between the measured accuracy, and the accuracy expected by chance. The accuracy and skill values indicated that the first variable, distance to the road, was the most influential in model performance. Accuracy and skill measures were even higher at 87.36 and 0.84 when the distance to building areas was held constant (Appendix E, supplementary file). However, if the skill of holding a variable constant is similar to the skill of modeling with all variables, the variable does not affect the model significantly, and can be removed (Shen et al. Citation2020). This was not the case in our model results. Appendix E (c) shows a LULC type with more likely to transition to another LULC type (supplementary file). Grazing land has the highest likelihood of transitioning to agricultural lands, and high forests are also likely to transition to open forest areas. Similarly, the likelihood of transitioning from high forest to open forest is 63%, with a 57% chance of remaining in high forest in 2007 (Appendix E (c), supplementary file).
The probability of one land-use class changing to another is cross-tabulated, and presented in . The matrix shows that the built-up area has a 65.1% chance of remaining built-up in 1992 and a 1% chance of changing compared to other land-use classes in 2007 (). Likewise, high forests and open forests have 71% and 83.1% chances of remaining the same in 1992, respectively. In the second round (2007–2022), 36.2% of the high forest area in 2022 has the opportunity to be converted into other LU classes, while 78% of grazing land has the potential to be converted to Other LU classes in the same year (). Furthermore, the probability of the high forest cover class remaining high forest in 2022 declined to 62% from 71% in 1992, and the probability of GL in 2007 remaining the same in 2022 has reduced to 6.1% from 10% in 1992. On the other hand, the probability of open forest, agricultural land, and Water bodies is observed to have the lowest potential to be converted to other LU classes with 0.1%, 0.1%, and 0.2% probabilities for 1992–2007 and 2007–2022, respectively ().
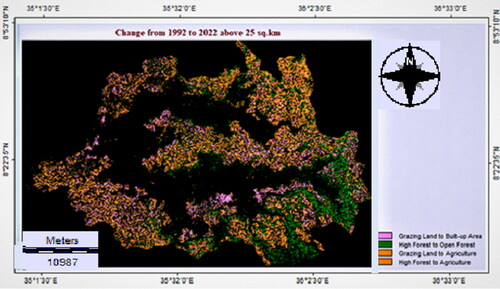
In mapping the transitions between LULC classes that occurred in the YCFBR area during 1992–2022, we considered transitions over 25 km2 to reduce them to the most common transitions. Therefore, at a threshold of 25 km2, only four transitions were mapped (). This result indicated that the expansion in the built-up areas was due to the conversion of grazing land to the built-up area, while the expansion in open forest areas was due to the degradation of high forest.
Figure 7. Prominent LULC changes above 25 km2 between 1992 and 2022.
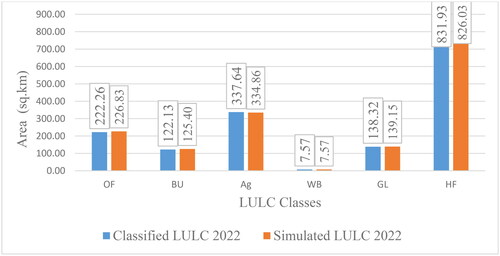
3.3. Actual and simulated LULC of YFBR for 2022
For the year 2022, actual and simulated LULC have been developed. Thus, the actual 2022 map and the simulated 2022 map showed clear similarities for the water bodies, while slight differences were observed for other LULC classes. The area coverage of the two maps showed that all LULC classes with a difference rate of less than 10% had the best agreement ( and ). Upon validation of the two classified, and simulated maps, as presented in Appendix D (supplementary file), the level of disagreement between the two maps was clearly explained. Accordingly, the overall disagreement percentage (1 m) is 0.05. A detailed analysis of the disagreements shows that the disagreement at the grid cell level, K(m)M(m), is 0.0276 (Appendix D, supplementary file). This is the extent of the disagreement related to the fact that the two maps being compared could not give the correct positions of the classes at the grid cell level within the strata (Appendix D, supplementary file). This difference in comparison is very small. The second type of disagreement occurs at the layer level: P(m) K(m). It is 0.0000 and represents the level of disagreement associated with the comparison not being able to provide the correct amount of each category within each stratum. This result shows that there are no disagreements between the simulated, and classified maps for 2022. The last disagreement is due to quantity, P(p) P(m) (Appendix C, supplementary file). Furthermore, the results from Appendix D (supplementary file), show that it is 0.0024, which corresponds to the disagreement related to the comparison process not being able to report the correct amount of each category according to the reference map. Ultimately, in this particular case, there is almost no disagreement between the two Maps.
Figure 8. Comparison between the classified and simulated LULC map of 2022.
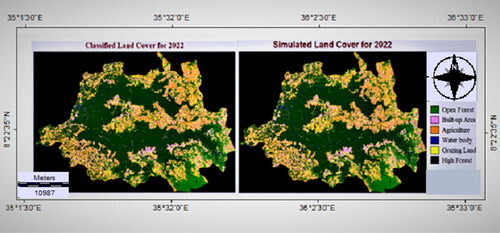
Figure 9. Statistics of simulated and classified LULC maps for 2020 in the YCFBR.
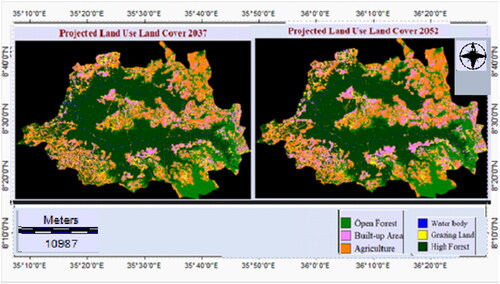
3.4. Prediction of LULC changes for 2037 and 2052
show the spatial distribution of LULC classes predicted for 2037 and 2052. The maps show a pattern similar to historical land-use change, showing that significant loss of high forest areas gradually gives way to open forest areas. The result indicates that the high forest is projected to be reduced from 50.1% in 2022 to 44.8% in 2037 and to about 40% in 2052. Similarly, the grazing land, and water body LULC classes will also show a decreasing trend over the next 30 years, and are expected to decrease from 8.3% and 0.5% in 2022 to 6% and 0.2% in 2052, respectively (Appendix A, supplementary file). Moreover, built-up area, and open forest LU classes will increase from 7.4% and 13.4% in 2022 to 12% and 18% in 2052, respectively. In addition, the statistics show an increase in the agricultural LU class from 20.3% in 2022 to 22.3% in 2037 and to about 24% in 2052, making the agricultural LU class the third among the three LU classes that are projected to increase over the next three decades following built-up, and open forest areas (Appendix A (supplementary file), and ).
Figure 10. Predicted YCFBR LC for 2037 and 2052.
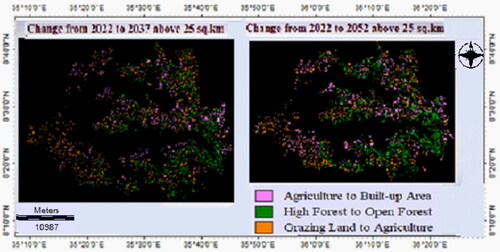
In mapping the future transitions between LULC classes that will likely occur in the YCFBR area in the near future, we considered transitions over 25 km2 to narrow down the most common transitions. Hence, at a threshold of 25 km2, only three transitions were mapped (). This predicted result indicated that most increases in open forest area will likely come from the degradation of high forest, whereas expansion in built-up area will likely come from the conversion of agricultural area, and eventually, expansion in agricultural land will likely come from the conversion of grazing land ().
Figure 11. Projected LC area for the years 2022, 2037 and 2052.
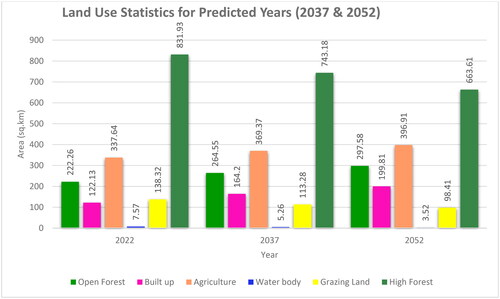
Figure 12. Transition from other classes to open Forest, built-up and agricultural land (2022–2052).
3.5. Discussion
The present study examined the historical LULC change over the last 30 years and simulated the next 30 years in YCFBR. Future LULC changes in 2037 and 2052 are projected using a 2022 LC basemap after successfully simulating changes in 2022. The result showed that the loss of the high forest cover class is the largest contributor to the expansion of the open forest class over the period 1992 to 2022. This is a clear indication of the deterioration of the high forest LULC class over time for the dispersal of forest coffee in the region. It was also found that grazing land, and water LULC classes show decreasing trends over the last 30 years. The result showed that the decline in the grazing land class is largely due to the increasing expansion of agricultural land in the area. Similarly, there has been continuous expansion of agricultural land over the last thirty years, leading to degradation of forest areas, and negatively impacting the quality of the area’s habitat. This trend is expected to persist in the future. This is supported with Hong et al. (Citation2022) rapid LULC change can easily lead to rapid decline of areas with important natural habitat functions such as high forest areas with more important habitat quality, resulting in habitat quality degradation. Lawrence et al. (Citation2019) discovered that landscape conversion from natural environments to agriculture, and grazing lands leads to a significant decline in biodiversity in the tropics. Similarly, Previous study in the area by Buechley et al. (Citation2015), that stated Conversion of forest land to agricultural land for subsistence crops, and improper semi coffee forest management. Abera et al. (Citation2021) who reported that the increase in agricultural area between 1996 and 2005 was at the expense of forest, and grassland areas in the YCFBR landscape. Furthermore, the results from the analysis of historical LULC change also revealed a significant decrease in grazing land, which has played a substantial role in the expansion of agriculture over time. The previous research supports the findings of this study, according to Berta Aneseyee et al. (Citation2020); Tsegaye (Citation2021), reporting the expansion of agricultural land, and over time declining of grazing land areas, with consequences on biodiversity.
Moreover, it provides a clear depiction of how built-up areas have grown, and expanded over time, probably due to population growth, which is the fundamental reason for the expansion of built-up areas particularly urban area expansion. Previous researches support this finding (Briggs, and Mainwaring Citation2017; Bai et al. Citation2020), the rapid expansion of built-up areas, and urbanization has led to a gradual imbalance in ecosystem functioning, accelerated biodiversity decline. Similarly, Yang et al. (Citation2020) reported that rapid urbanization as a major cause of increases environmental risks. This result is also supported by a study by Gedefaw et al. (Citation2020) in the northern region of Ethiopia shows that the increase in built-up area, and arable land is due to the current high demand for public facilities, schools, and clinics, and public land. population to accommodate the growing population, and thus contributes significantly to the expansion of the built-up area. Further study by Taye et al. (Citation2013), and Miheretu and Yimer (Citation2018) also confirm the inexorable, and rapid expansion of built-up areas in different regions of Ethiopia as a result of population growth, increase of rural settlements, and expansion of urban areas.
The simulated future LULC change in the YCFBR showed a significant loss of high forest, and an increase in open forest area over the next 30 years (2022–2052). This decline in high forests is attributed to the expansion of forest coffee areas, converting open forest areas into high forest areas. This could be due to the role of coffee production as the main source of livelihood for the surrounding community in the area. Additionally, loss of land productivity, and scarcity of arable land can prompt the community to clear new land for cultivation, contributing to forest degradation over time. In addition, the simulation results show a decreasing trend in the LULC classes of grazing land, and water bodies over the next 30 years, while the LULC classes of agricultural land, built-up land, and open forest land are projected to increase from 2022 to 2052. Most of the increase in the agricultural land class is likely to come from grazing land, whereas, that built-up area would come from agricultural land. These results are consistent with studies by Ethiopian researchers (Tesfaye Citation2010; Tadese et al. Citation2021), and Indonesian researchers (Supriatna Citation2017; Aliani et al.Citation2019) who found simulation results indicating declining trends in forest cover from 2014 to 2028. Furthermore, this result is consistent with the prediction of Khawaldah et al. (Citation2020) showing that the built-up area in Jordan’s Irbid governorate increases steadily from 2015 to 2050.
The study has limitations due to insufficient field data, limited transport options, and restricted access to the core areas of the BR. In spite of these limitations, the study provides a new perspective for conservation planning strategies in the southwestern part of the country, focusing on biodiversity management and sustainable LU targets. It also offers insights into the extent of conservation planning to match the expected changes in LULC. The results can guide policymakers in improving LU management tactics and potentially reduce pressure on high forests areas.
The study used CA-Markov to simulate LU change due to its dynamic capability, high efficiency, easy calibration, and ability to simulate multiple land covers and complex patterns. Compared to other LUCC models like GEOMOD and CLUE, CA-Markov offers a more comprehensive simulation. However, it has calibration limitations as it relies on a single time period operationally and makes simplified assumptions for simulating microscale LU change (Paegelow and Olmedo Citation2005).
3.6. Conclusion and future direction
This study has examined the dynamics of historical LULC changes, and simulated future potential changes in the YCFBR in south-western Ethiopia using CA Markov modeling techniques. We used this model as it is used to answer what-if questions, and simulated the LULC 2022 to validate our model, and it showed high accuracy. Multitemporal Landsat imagery from 1992, 2007 and 2022 were used to derive LULC maps, which were further used in the CA Markov process to successfully simulate the future spatial, and temporal changes of LULC. It was found that there was a significant expansion of agricultural areas, built-up areas, and sparse forests in the period under consideration. In addition, the study found declining trends in high forest areas, grazing lands, and water bodies over the period 1992 to 2022. Likewise, the expected FCs have indicated declining trends in the total area cover of high forests from 831 km2 in 2022 to 743 km2 in 2037 and 663 km2 in 2037 in 2052.
In addition, the study found that the expected decline in high forest over time is the largest contributor to the expansion of open forest in the region. Likewise, the reduction in grazing area during these periods is the most important contribution to the expansion of agricultural land. Therefore, the observed, and simulated LULC states showed significant expansion of agricultural land, built-up areas, and open forests without proper planning. Encroachment on forest areas, particularly by local landless societies, would pose a serious threat to natural resources in the BR. Taking into account the actual situation of local landless farmers in the region, appropriate natural resource conservation measures should be taken to minimize the expected negative impact of future LULC changes, and ensure successful conservation of natural resources in the area. Furthermore, the application of inclusive management measures such as participatory resource conservation, the introduction of intensive farming practices, and assistive technologies for local farmers, and the incorporation of potential LU changes into policy planning are required to make informed decisions for future efficiency in biodiversity conservation. In the future, therefore, it will be beneficial to focus on finding effective ways to manage the already existing biodiversity in the region. Further future studies are needed to utilize more detailed socio-ecological variables, and improve the efficiency of conservation efforts in such naturally endowed areas.
Author contribution statement
Mr. Gemeda Terfassa Fida: Conceived and designed the research; Performed the research; Analyzed and interpreted the data; Wrote the paper. Prof. Bernard Nuoleyeng Baatuuwie & Dr. Hamza Issifu: Conceived and designed the research; Contributed reagents and interpreted the data.
Acknowledgments
The authors gratefully acknowledge the valuable databases from United States Geological Survey (USGS). We would also like to thank West African Center for Water, Irrigation and Sustainable Agriculture (WACWISA) and the University for Development Studies; lecturers in Department of Environment and Sustainability Sciences, librarians, and others staff members for their help and support during the research.
Disclosure statement
The authors declare that they have no known competing financial interests or personal relationships that could have appeared to influence the work reported in this paper.
Data availability statement
The data that supports the write-up of this research are available from the corresponding author, upon reasonable request.
Additional information
Funding
References
- Abera W, Tamene L, Kassawmar T, Mulatu K, Kassa H, Verchot L, Quintero M. 2021. Impacts of land use and land cover dynamics on ecosystem services in the Yayo coffee forest biosphere reserve, southwestern Ethiopia. Ecosyst Serv. 50:101338. doi:10.1016/j.ecoser.2021.101338.
- Abiye TA. 2008. Urban groundwater pollution in Addis Ababa, Ethiopia. Applied groundwater studies in Africa. Boca Raton, FL: CRC; p. 261–276.
- Aliani H, Malmir M, Sourodi M, Kafaky SB. 2019. Change detection and prediction of urban land use changes by CA–Markov model (case study: Talesh County). Environ Earth Sci. 78(17):1–12. doi:10.1007/s12665-019-8557-9.
- Arai T, Azri A. 2019. Diversity, occurrence and conservation of sharks in the southern South China Sea. PLoS One. 14(3):e0213864. doi:10.1371/journal.pone.0213864.
- Ariti AT, van Vliet J, Verburg PH. 2015. Land-use and land-cover changes in the Central Rift Valley of Ethiopia: assessment of perception and adaptation of stakeholders. Appl Geogr. 65:28–37. doi:10.1016/j.apgeog.2015.10.002.
- Ariza-Lopez FJ, Rodriguez-Avi J, Alba-Fernandez MV. 2018. Complete control of an observed confusion matrix. In Proceedings of the IGARSS – 2018 IEEE International Geoscience and Remote Sensing SymposiumValencia, Spain, 22–27 July 2018; pp. 1222–1225.
- Bai Y, He G, Wang G, Yang G. 2020. WE-NDBI-A new index for mapping urban built-up areas from GF-1 WFV images. Remote Sens Lett. 11(5):407–415. doi:10.1080/2150704X.2020.1723171.
- Berta Aneseyee A, Noszczyk T, Soromessa T, Elias E. 2020. The InVEST habitat quality model associated with land use/cover changes: a qualitative case study of the Winike Watershed in the Omo-Gibe Basin, Southwest Ethiopia. Remote Sens. 12(7):1103. doi:10.3390/rs12071103.
- Briggs KB, Mainwaring MC. 2017. Habitat geology influences intraspecific variation in the speckling patterns of blue tit Cyanistes caeruleus and great tit Parus major eggs. Acta Ornithologica. 52(1):11–20. doi:10.3161/00016454AO2017.52.1.002.
- Buechley ER, Şekercioğlu ÇH, Atickem A, Gebremichael G, Ndungu JK, Mahamued BA, Beyene T, Mekonnen T, Lens L. 2015. Importance of Ethiopian shade coffee farms for forest bird conservation. Biol Conserv. 188:50–60. doi:10.1016/j.biocon.2015.01.011.
- Chen J, Chen J, Liao A, Cao X, Chen L, Chen X, He C, Han G, Peng S, Lu M, et al. 2015. Global land cover mapping at 30 m resolution: a POK-based operational approach. ISPRS J Photogramm Remote Sens. 103:7–27., doi:10.1016/j.isprsjprs.2014.09.002.
- Daba MH, You S. 2022. Quantitatively assessing the future land-use/land-cover changes and their driving factors in the upper stream of the Awash River based on the CA–markov model and their implications for water resources management. Sustainability. 14(3):1538. doi:10.3390/su14031538.
- Dayamba SD, Djoudi H, Zida M, Sawadogo L, Verchot L. 2016. Biodiversity and carbon stocks in different land use types in the Sudanian Zone of Burkina Faso, West Africa. Agric Ecosyst Environ. 216:61–72. doi:10.1016/j.agee.2015.09.023.
- Dorresteijn I, Schultner J, Collier NF, Hylander K, Senbeta F, Fischer J. 2017. Disaggregating ecosystem services and disservices in the cultural landscapes of southwestern Ethiopia: a study of rural perceptions. Landscape Ecol. 32(11):2151–2165. doi:10.1007/s10980-017-0552-5.
- Elmes A, Alemohammad H, Avery R, Caylor K, Eastman J, Fishgold L, Friedl M, Jain M, Kohli D, Laso Bayas J, et al. 2020. Accounting for training data error in machine learning applied to Earth observations. Remote Sens. 12(6):1034., doi:10.3390/rs12061034.
- Fang Z, Bao W, Yan X, Liu X. 2014. Understory structure and vascular plant diversity in naturally regenerated deciduous forests and spruce plantations on similar clear-cuts: implications for forest regeneration strategy selection. Forests. 5(4):715–743. doi:10.3390/f5040715.
- Fekensa T, Tesfahunegny W, Mekonnen A. 2016. Impact of human activities on biosphere reserve: a case study from Yayu Biosphere Reserve, Southwest Ethiopia. Int J Biodivers Conserv. 10:319–326.
- Gashaw T, Tulu T, Argaw M, Worqlul AW. 2018. Evaluation and prediction of land use/land cover changes in the Andassa watershed, Blue Nile Basin, Ethiopia. Environ Syst Res. 6(1):1–15. doi:10.1186/s40068-017-0094-5.
- Gedefaw AA, Atzberger C, Bauer T, Agegnehu SK, Mansberger R. 2020. Analysis of land cover change detection in Gozamin District, Ethiopia: from remote sensing and DPSIR perspectives. Sustainability. 12(11):4534. doi:10.3390/su12114534.
- Getahun D, Keno ET. 2019. Attitudes and perceptions of the local community towards Yayo coffee forest biosphere reserve, ilu abba bora zone of Oromia national regional state. Ethiop J Sci Sustain Devel. 6(1):79–90.
- Gole TW, Senbeta F, Tesfaye K, Getaneh F. 2009. Yayu coffee forest biosphere reserve nomination form. Addis Ababa: Government of the Federal Democratic Republic of Ethiopia.
- Gonthier DJ, Ennis KK, Farinas S, Hsieh HY, Iverson AL, Batáry P, Rudolphi J, Tscharntke T, Cardinale BJ, Perfecto I. 2014. Biodiversity conservation in agriculture requires a multi-scale approach. Proceedings of the Royal Society B: Biological Sciences, 281(1791); p. 20141358.
- Hanberry BB. 2021. Transition from fire-dependent open forests: alternative Ecosystem States in the Southeastern United States. Diversity. 13(9):411. doi:10.3390/d13090411.
- Hong W, Wang W, Guo R. 2022. Policies for optimizing land-use layouts in highly urbanized areas: an analysis framework based on construction land clearance. Habitat Int. 130:102697. doi:10.1016/j.habitatint.2022.102697.
- Hua AK. 2017. Application Of CA-Markov Model and land use/land cover changes in Malacca River Watershed, Malaysia. Appl Ecol Env Res. 15(4):605–622.
- Huluka AT, Wondimagegnhu BA. 2019. Determinants of household dietary diversity in the Yayo biosphere reserve of Ethiopia: an empirical analysis using sustainable livelihood framework. Cogent Food Agric. 5(1):1690829. doi:10.1080/23311932.2019.1690829.
- Hutchinson TF, Rebbeck J, Stout SL. 2016. The Devil is in the small dense saplings: a Midstory Herbicide treatment has limited effects on short-term regeneration outcomes in Oak Shelterwood Stands. For Ecol Manage. 372:189–198. doi:10.1016/j.foreco.2016.04.016.
- Hyandye C, Martz LW. 2017. A Markovian and cellular automata land-use change predictive model of the Usangu Catchment. Int J Remote Sens. 38(1):64–81. doi:10.1080/01431161.2016.1259675.
- Inne AIS, Supriatna MDM, Manessa, Y, Ristya. 2021. Prediction model of land cover changes using the Cellular Automata – Markov Chain affected by the BOCIMI Toll Road in Sukabumi Regency. In The 1st International Conference on Geodesy, Geomatics, and Land Administration KnE Engineeringpagesp; p. 247–256. doi:10.18502/keg.v4i3.5860
- Kafy A-A, Rahman MS, Faisal A-A, Hasan MM, Islam M., 2020. Modelling future land use land cover changes and their impacts on land surface temperatures in Rajshahi, Bangladesh. Remote Sens Appl. 18:100314. doi:10.1016/j.rsase.2020.100314.
- Khawaldah HA, Farhan I, Alzboun NM. 2020. Simulation and prediction of land use and land cover change using GIS, remote sensing and CA-Markov model. Glob J Environ Sci Manag. 6(2):215–232.
- Khwarahm NR, Qader S, Ararat K, Fadhil Al-Quraishi AM. 2021. Predicting and mapping land cover/land use changes in Erbil/Iraq using CA-Markov synergy model. Earth Sci Inform. 14(1):393–406. doi:10.1007/s12145-020-00541-x.
- Kindu M, Schneider T, Teketay D, Knoke T. 2013. Land use/land cover change analysis using object-based classification approach in Munessa-Shashemene landscape of the Ethiopian highlands. Remote Sens. 5(5):2411–2435. doi:10.3390/rs5052411.
- Kindu M, Schneider T, Teketay D, Knoke T. 2016. Changes of ecosystem service values in response to land use/land cover dynamics in Munessa–Shashemene landscape of the Ethiopian highlands. Sci Total Environ. 547:137–147. doi:10.1016/j.scitotenv.2015.12.127.
- Lawrence R, Whalley RDB, Reid N, Rader R. 2019. Short-duration rotational grazing leads to improvements in landscape functionality and increased perennial herbaceous plant cover. Agric Ecosyst Enviro. 281:134–144. doi:10.1016/j.agee.2019.04.031.
- Lemenih M,Kassa H,Kassie GT,Abebaw D,Teka W. 2014. Resettlement and woodland management problems and options: a case study from North-western Ethiopia. Land Degrad Develop. 25(4):305–318. doi:10.1002/ldr.2136.
- Leta MK, Demissie TA, Tränckner J. 2021. Modeling and prediction of land use land cover change dynamics based on modeling and prediction of land use land cover change dynamics based on Land Change Modeler (LCM) in Nashe Watershed, Upper Blue Nile Basin, Ethiopia. Sustainability. 13(7):3740. doi:10.3390/su13073740.
- Li Y, Lu X, Xiong H, Tang J, Su J, Jin B, Dou D. 2023. Towards long-term time-series forecasting: feature, pattern, and distribution. arXiv preprint arXiv:2301.02068.
- Mallupattu PK, Sreenivasula Reddy JR. 2013. Analysis of land use/land cover changes using remote sensing data and GIS at an Urban Area, Tirupati, India. Sci World J. 2013:1–6. doi:10.1155/2013/268623.
- Meire LKER, Soetaert KER, Meysman FJR. 2013. Impact of global change on coastal oxygen dynamics and risk of hypoxia. Biogeosciences. 10(4):2633–2653. doi:10.5194/bg-10-2633-2013.
- Mengist W, Soromessa T, Feyisa GL. 2021. Landscape change effects on habitat quality in a forest BR: implications for the conservation of native habitats. J. Clean. Prod. 329:129778.
- Meshesha DT, Tsunekawa A, Tsubo M, Ali SA, Haregeweyn N. 2014. Land-use change and its socio-environmental impact in Eastern Ethiopia’s highland. Reg Environ Change. 14(2):757–768. doi:10.1007/s10113-013-0535-2.
- Miheretu BA, Yimer AA. 2018. Land use/land cover changes and their environmental implications in the Gelana sub-watershed of Northern highlands of Ethiopia. Environ Syst Res. 6(1):12. doi:10.1186/s40068-017-0084-7.
- Mishra VN, Rai PK, Kumar P, Prasad R. 2016. Evaluation of land use/land cover classification accuracy using multi-resolution remote sensing images. FG. XV(1):45–53. doi:10.5775/fg.2016.137.i.
- Munro RN, Deckers J, Haile M, Grove AT, Poesen J, Nyssen J. 2008. Soil landscapes, land cover change and erosion features of the Central Plateau region of Tigrai, Ethiopia: photo-monitoring with an interval of 30 years. Catena. 75(1):55–64. doi:10.1016/j.catena.2008.04.009.
- Ngoy KI, Qi F, Shebitz DJ. 2021. Analyzing and predicting land use and land cover changes in New Jersey using multi-layer perceptron–Markov chain model. Earth. 2(4):845–870. doi:10.3390/earth2040050.
- Nkonya E, Anderson W, Kato E, Koo J, Mirzabaev A, von Braun J, Meyer S. 2014. Global cost of land degradation. In: Nkonya E, Mirzabaev A, von Braun J, editors. Economics of land degradation and improvement. Netherlands: Springer.
- Paegelow M, Olmedo MTC. 2005. Possibilities and limits of prospective GIS land cover modelling – a compared case study: garrotxes (France) and Alta Alpujarra Granadina (Spain). Int J Geogr Inf Sci. 19(6):697–722. doi:10.1080/13658810500076443.
- Palmate SS, Wagner PD, Fohrer N, Pandey A. 2022. Assessment of uncertainties in modelling land use change with an integrated cellular automaton–Markov chain model. Environ Model Assess. 27(2):275–293. doi:10.1007/s10666-021-09804-3.
- Paz-Kagan T, Shachak M, Zaady E, Karnieli A. 2014. Evaluation of ecosystem responses to land-use change using soil quality and primary productivity in a semi-arid area, Israel. Agric Ecosyst Environ. 193:9–24. doi:10.1016/j.agee.2014.04.024.
- Perkins S. 2007. Forest primeval: the oldest known trees finally gain a crown. Sci News. 171(16):243–244. doi:10.1002/scin.2007.5591711603.
- Pontius RG, Jr, Batchu K. 2003. Using the relative operating characteristic to quantify certainty in prediction of location of land cover change in India. Trans GIS. 7(4):467–484.
- Reddy CS, Singh S, Dadhwal VK, Jha CS. 2017. Predictive modelling of the spatial pattern of past and future forest cover changes in India. J Earth Syst Sci. 126:8. doi:10.1007/s12040-.016-0786-7
- Regassa A, Ali A, Taye G. 2023. Soil classification. In: The Soils of Ethiopia. Cham: Springer International Publishing; p. 71–75.
- Riddiford J. 2021. Current integrated catchment management policy and management settings in the Murray–Darling Basin. Australia: Murray-Darling Basin; p. 185–201.
- Roy K, Farzana M, Papia, M, Hasan. 2015. Monitoring and prediction of land use/land cover change using the integration of Markov chain model and cellular automation in the southeastern tertiary hilly area of Bangladesh. Int J Sci. 24:125–148.
- Sarkar A, Chouhan P. 2019. Dynamic simulation of urban expansion based on Cellular Automata and Markov Chain Model: a case study in Siliguri Metropolitan Area, West Bengal. Model Earth Syst Environ. 5(4):1723–1732. doi:10.1007/s40808-019-00626-7.
- Shen L, Li JB, Wheate R, Yin J, Paul SS. 2020. Multi-layer perceptron neural network and Markov chain based geospatial analysis of land use and land cover change. J Environ Inform Lett. 3:29–39.
- Subedi P, Subedi K, Thapa B. 2013. Application of a hybrid cellular automaton – Markov (CA-Markov) Model in land-use change prediction: a case study of Saddle Creek Drainage Basin, Florida. AEES. 1(6):126–132. doi:10.12691/aees-1-6-5.
- Supriatna. 2017. Modelling land use/cover changes with Markov – Cellular Automata in Komering Watershed, South Sumatera. IOP Science Series: Earth and Environmental Science. 54:e012103. doi:10.1088/1755-1315/54/1/012103.
- Tadese S, Soromessa T, Bekele T. 2021. Analysis of the current and future prediction of land use/land cover change using remote sensing and the CA-markov model in Majang forest biosphere reserves of Gambella, southwestern Ethiopia. Scient World J. 2021:1–18. doi:10.1155/2021/6685045.
- Tariq A, Mumtaz F. 2023. A series of spatio-temporal analyses and predicting modeling of land use and land cover changes using an integrated Markov chain and cellular automata models. Environ Sci Pollut Res Int. 30(16):47470–47484. doi:10.1007/s11356-023-25722-1.
- Tariq A, Mumtaz F, Majeed M, Zeng X. 2022. Spatio-temporal assessment of land use land cover based on trajectories and cellular automata Markov modelling and its impact on land surface temperature of Lahore district Pakistan. Environ Monit Assess. 195(1):114. doi:10.1007/s10661-022-10738-w.
- Taye G, Poesen J, Wesemael BV, Vanmaercke M, Teka D, Deckers J, Goosse T, Maetens W, Nyssen J, Hallet V, et al. 2013. Effects of land use, slope gradient, and soil and water conservation structures on runoff and soil loss in semi-arid Northern Ethiopia. Phys Geography. 34(3):236–259. doi:10.1080/02723646.2013.832098.
- Tayyebi A, Pijanowski BC, Tayyebi AH. 2011. An urban growth boundary model using neural networks, GIS, and radial parameterization: An application to Tehran, Iran. Landscape Urban Plann. 100(1–2):35–44. doi:10.1016/j.landurbplan.2010.10.007.
- Temesgen H, Nyssen J, Zenebe A, Haregeweyn N, Kindu M, Lemenih M, Haile M. 2013. Ecological succession and land use changes in a lake retreat area (Main Ethiopian Rift Valley). J Arid Environ. 91:53–60. doi:10.1016/j.jaridenv.2012.12.001.
- Terrado M, Sabater S, Chaplin-Kramer B, Mandle L, Ziv G, Acuña V. 2016. Model development for the assessment of terrestrial and aquatic habitat quality in conservation planning. Sci Total Environ. 540:63–70. doi:10.1016/j.scitotenv.2015.03.064.
- Tesfaye G, Teketay D, Fetene M, Beck E. 2010. Regeneration of seven indigenous tree species in a dry Afromontane Forest, southern Ethiopia. Flora-Morphol Distri Funct Ecol Plants. 205(2):135–143. doi:10.1016/j.flora.2008.12.006.
- Tian Y,Zheng Y,Han F,Zheng C,Li X. 2018. A comprehensive graphical modeling platform designed for integrated hydrological simulation. Environ Model Softw. 108:154–173. doi:10.1016/j.envsoft.2018.08.011.
- Tiejun W, Kinchi L, Cunwang C, Huili H, Jiansheng Q. 2012. Ecological civilization, indigenous culture, and rural reconstruction in China. Mon Rev. 63(9):29. doi:10.14452/MR-063-09-2012-02_2.
- Tsegaye NT. 2021. Land use and land cover change analysis using gis and remote sensing in the case of Kersa District. Ethiopia: Jimma Zone, Oromia Region.
- Van Bloem SJ, Murphy PG, Lugo AE. 2007. A link between hurricane-induced tree sprouting, high stem density and short canopy in tropical dry forest. Tree Physiol. 27(3):475–480. doi:10.1093/treephys/27.3.475.
- Verma G, Kumar B. 2022. Multi-layer perceptron (MLP) neural network for predicting the modified compaction parameters of coarse-grained and fine-grained soils. Innov Infrastruct Solut. 7(1):78. doi:10.1007/s41062-021-00679-7.
- Yang C, Zhang C, Li Q, Liu H, Gao W, Shi T, Liu X, Wu G. 2020. Rapid urbanization and policy variation greatly drive ecological quality evolution in Guangdong-Hong Kong-Macau Greater Bay Area of China: a remote sensing perspective. Ecol Indic. 115:106373. doi:10.1016/j.ecolind.2020.106373.
- Yuan Y, Xu H, Wang B, Yao X. 2016. A new dominance relation-based evolutionary algorithm for many-objective optimization. IEEE Trans Evol Computat. 20(1):16–37. doi:10.1109/TEVC.2015.2420112.
- Yulianto, Fajar, Prasasti, Indah, Pasaribu, Junita Monika, Fitriana, Hana Listi, Haryani, Nanik Suryo, Sofan, Parwati, Zylshal, 2016. The dynamics of land use/land cover change modeling and their implication for the flood damage assessment in the Tondano watershed, North Sulawesi, Indonesia. Model. Earth Syst. Environ. 2:1–20. doi:10.1007/s40808-016-0100-3.
- Zadbagher E, Becek K, Berberoglu S. 2018. Modeling land use/land cover change using remote sensing and geographic information systems: case study of the Seyhan Basin, Turkey. Environ Monit Assess. 190(8):494. doi:10.1007/s10661-018-6877-y.
- Zhang Z, Tang W. 2023. Mixed landform with high-rise buildings: a spatial analysis integrating horizon-vertical dimension in natural-human Urban Systems. Land Use Policy. 132:106806. doi:10.1016/j.landusepol.2023.106806.
Appendix A.
CA-Markov predicted LULC area change
Appendix B.
LULC 1992, 2007 and 2022 of YCFBR