
Abstract
The current research aimed to monitor and assess the heavy metal contamination in the surface water of 53 sampling sites along the selected rivers using principal component analysis and cluster analysis. For this purpose, both physiochemical parameters such as the temperature (T), the potential of hydrogen (pH), total dissolved solids (TDS) and electroconductivity (EC), and heavy metals such as iron (Fe), chromium (Cr), nickel (Ni), cadmium (Cd), lead (Pb) and arsenic (As) are analyzed as potential water contaminants. The average values of pH, TDS, EC and T are found at 7.75, 70.89 mg/L, 139.11 µs/cm and 20.29 °C, respectively, and heavy metals including Cr, Ni, Cd, Pb, As and Fe are observed at 0.04, 0.04, 0.04, 0.03, 0.001 and 0.04 mg/L, respectively. Moreover, it is found that in both rivers hazardous metals, including Cr (100%), Cd (92.30%), Pb (100%), Ni (100%) and Fe (91%), exceed the permissible limits of the WHO.
1. Introduction
Water is vital for both plant and animal life, due to its importance for various physiological processes and maintaining overall biological functioning (Kormoker et al. Citation2022; Sunjida et al. Citation2016a). Merely 2.5% of the global water supply constitutes freshwater sources, and there is a growing global apprehension regarding the potential scarcity of high-quality water resources in the imminent future. Surface water is currently under the stress of getting various pollutants from various point and non-point sources, which are the leading causes of water contamination. The swift modifications in surface waters’ physical and chemical parameters disrupt the ecological equilibrium within aquatic environments, leading to environmental deterioration. These alterations instigate a decline in water quality, contributing to the contamination of the water resources (Khan et al. Citation2022). The environmental importance of river water is undeniable, and contamination is an issue that affects us all. Rivers serve as significant resources for communities, particularly in relation to the fishing industry and as a water source for nearby populations. Any form of river contamination, whether direct or indirect, poses potential risks to human health as the ultimate consumers. Contaminated water can lead to various types of diseases in the human body, as water is essential for cellular metabolism and proper functioning (Alam et al. Citation2017). River water receives toxic waste effluents that cause serious problems globally due to their deleterious impacts on aquatic biota (Khanna and Ishaq Citation2013). Aquatic ecosystems act as sinks and endpoints of various pollutants (Edward et al. 2012). Since an adequate amount of clean and safe drinking water is required to maintain a better life (Sunjida et al. Citation2016b).
Growing apprehension surrounds the issue of heavy metal pollution in river ecosystems due to their significant societal and ecological implications. While certain heavy metals are essential as micronutrients, their presence in concentrations exceeding minimum requirements can induce toxicity (Dasar et al. Citation2009). Due to the bioaccumulation, biomagnifications, and toxicity of heavy metals in the food chain, heavy metal contamination causes serious problems (Shams et al. Citation2013; Sfakianakis et al. Citation2015). Heavy metals represent the predominant environmental contaminants, and their occurrence in water signifies the existence of natural or anthropogenic origins. Heavy metals are commonly released into river systems from various sources, both natural (such as weathering, soil erosion, volcanism, precipitation, etc.) and anthropogenic (such as smelting, factory discharges, mineral processing, domestic waste, agricultural practices, etc.) (Krishna et al. Citation2009). The exponential growth in population coupled with the expanding industrial, agricultural and forestry practices have substantial impacts on the quantity, quality and utilization of water resources (Kurnaz et al. Citation2016). These metals have the potential to contaminate river water, which is extensively utilized for domestic, agricultural and industrial purposes. The bioaccumulation and biomagnification of heavy metals contribute to their toxic effects, making them a significant concern in terms of environmental impact. Aquatic ecosystems often serve as the ultimate recipients of various pollutants, with urbanization, population growth, and unregulated waste disposal being key contributing factors. Consequently, the presence of heavy metal pollution in aquatic environments raises significant concerns regarding its direct impact on biota and its indirect implications for human health. Moreover, certain heavy metals, including Cd, Cr, Ni, As, Pb and Fe (in high concentrations), exhibit high toxicity (Zhang et al. Citation2017). The accumulation of heavy metals in the adipose tissue and livers of both humans and animals can have detrimental effects on the nervous, circulatory, and immune systems. Additionally, prolonged storage of certain heavy metals like Cd and Cr has been found to possess carcinogenic properties (Bonsignore et al. Citation2016). Hence, it is imperative to accurately quantify the concentrations of heavy metals and diligently monitor potential alterations in their levels (Lawson Citation2011). Regular analysis of the physicochemical properties and heavy metal concentrations in freshwater resources is of paramount importance for monitoring fluctuations. The scientific literature contains numerous studies focusing on the contamination of water sources by heavy metals (Osman and Kloas Citation2010; Ikem and Adisa Citation2011; Lu et al. Citation2013; Khan et al. Citation2022). These researchers collectively concluded that regular monitoring of water quality is necessary. This is since rise concentrations of heavy metals in river water pose an augmented risk to both human health and agricultural activities.
Notably, Pakistan faces a prominent pollution challenge, with waste frequently being directly dumped into water bodies and land, exacerbating the issue (Mulk et al. Citation2016). The presence of profound water pollution and the scarcity of resources pose significant challenges, necessitating the implementation of water quality-focused monitoring systems and intelligent water resources management approaches (Khan et al. 2013). Regular analysis of the physicochemical properties and heavy metal concentrations in freshwater resources is of paramount importance for monitoring fluctuations. Consequently, the presence of heavy metal pollution in aquatic environments raises significant concerns regarding its direct impact on biota and its indirect implications for human health (Khan et al. Citation2023). In this study, heavy metals are assessed and spatially distributed using multivariate statistical methods and ArcGIS environment on 53 samples from the rivers Swat and Panjkora. A comprehensive analysis is conducted on a total of ten parameters, comprising four physiochemical factors and six heavy metals, to evaluate their potential as water contaminants and stressors.
Multivariate data analysis approaches can be readily employed to interpret complex physicochemical and biochemical measurements involving multiple components. These approaches help to simplify environmental data and facilitate its comprehension (Bilgin and Konanç Citation2016). Statistical methodologies, specifically multivariate techniques, exhibit expertise in addressing the limitations associated with the Water Quality Index (WQI) and offer substantial value in the reduction of environmental data and interpretation of multiple parameters. Principal Components Analysis (PCA) and Cluster Analysis (CA) have gained recognition as dependable approaches for extracting information from data matrices in the context of environmental quality assessments. Notably, PCA and CA are extensively applied in the field of water quality and heavy metal assessments (Astel et al. Citation2007). In recent years, multivariate statistical analysis has emerged as one of the foremost and extensively employed methodologies for analyzing water contamination. PCA has been employed by researchers to streamline water quality assessment by reducing the number of parameters involved. Giri and Singh (Citation2014) conducted a study in the Subarnarekha River, while Mokarram et al. (Citation2022) focused on the Kor River water, Iran. Both studies utilized PCA to effectively condense the parameter set for water quality evaluation. Their findings demonstrated that employing PCA to decrease the number of parameters enhanced the robustness of statistical analyses in heavy metal assessment.
The existing contamination by heavy metals in surface water is a major environmental issue all over the world. Therefore, in the current research, we aimed to monitor and assess the heavy metal contamination in the surface water of 53 sampling sites along the selected rivers (Swat and Panjkora). Water resources in the northern mountainous region of Pakistan were once famous however, contemporary anthropogenic endeavors have caused a decline in their quality and overall ecological state. For this purpose, four physiochemical parameters, such as the temperature (T), the potential of hydrogen (pH), total dissolved solids (TDS), and electroconductivity (EC), and six heavy metals, such as iron (Fe), chromium (Cr), nickel (Ni), cadmium (Cd), lead (Pb), and arsenic (As), are examined as potential water contaminants and stressors, since both of these parameters are used for water quality in various literature (Ustaoğlu et al. Citation2017; Yüksel et al. Citation2022; Topaldemir et al. Citation2023). Moreover, it is found that in both the rivers the potentially hazardous metals, including Cr (100%), Cd (92.30%), Pb (100%), Ni (100%) and Fe (91%), are exceeding the permissible limits of the World Health Organization (WHO).
2. Materials and methods
2.1. Data and study area
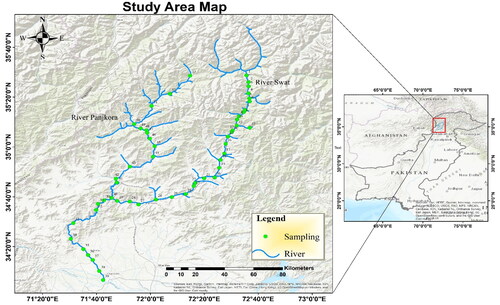
The study is carried out in the rivers Swat and Panjkora, which are located in the eastern Hindukush region of Pakistan, with the geographical extent of 34°20′0″ N to 35°40′0″ N latitudes and 71°20′0″ E to 73°0′0″ E longitudes (). The catchment areas of both rivers originate from Alpine Glaciers, where snowmelt contributes to their water flow. The rivers under consideration play a pivotal role in the provincial economy as they serve multiple purposes such as irrigation, domestic use and power generation (Khan et al. Citation2022). Furthermore, they provide a habitat for diverse fish species. However, pollution in the study regions has led to the depletion of clean water resources. Regrettably, the water in these rivers is presently facing significant contamination issues originating from various sources, including hotel waste, marble factories, gas stations, vehicle workshops, inadequate sanitation practices, agricultural fertilizer, pesticides, etc. In the present study, the quality of water is assessed based on both the physiochemical and heavy metals analysis using multivariate statistical analysis (Khan et al. Citation2022). The River Swat, is a major flood prone basin located in the eastern Hindukush region of Pakistan, spanning a length of 288 kilometers, originates from the Seri Kalam Valley and ends at Sardaryab Charsadda (Nasir et al. Citation2023). In a similar vein, the river Panjkora extends 150 kilometers, commencing its journey from Kumrat Valley and eventually converging with the Swat River at the Bosaq Bridge (Ullah and Zhang Citation2020). These rivers traverse through the regions of Swat, Lower Dir, Upper Dir, Malakand and Mohmand districts, ultimately merging with the River Kabul at Charsadda district. At the northern origin, the river’s altitude is approximately 5800 m, decreasing gradually up to 500 m downstream (Nasir et al. Citation2020). Both of these rivers are fed by snow-covered mountain and glaciers in the northern counterpart, as well as the comprehensive drainage of their respective catchment areas (Khan et al. Citation2023).
Figure 1. Study area map.
2.2. Water sample collection, preparation, and physiochemical analysis
provides detailed descriptions and geographical positions of all the sampling sites located along both rivers. These visual aids offer valuable insights into the terrestrial locations and characteristics of the sites under consideration. Triplicate water samples are collected for both physiochemical and heavy metals analysis, and temporarily stored at 4 °C in a refrigerator before being transferred to the centralized resource laboratory at the University of Peshawar, Pakistan, for further analysis of heavy metals. A total of fifty-three samples (n = 53) are collected in replicates from fifty-three different sites from both the rivers following an approximately equal distance difference between the samples. To ascertain the spatial distribution of physiochemical parameters and heavy metals across the river, a Global Positioning System (GPS) is employed to record the precise geographical coordinates of each sampling point. Precleaned polythene bottles are used for sampling collection, and a total of 250 ml of water from each sampling site are collected for heavy metals analysis. In the field, portable instruments are utilized for conducting on-site analyses of pH, electrical conductivity (EC), total dissolved solids (TDS) and temperature. Acetylene flame atomic absorption spectrophotometer (Perkin Elmer AAS 700, USA) were used for heavy metals analysis using duplicates for control and quality assurance using certified reference materials (CRM 700) (Yuksel and Arica Citation2018; Yüksel et al. Citation2021), with each batch of water samples and reagent blanks (Alam et al. Citation2017).
Table 1. Sampling location points names and coordinates.
2.3. Cluster analysis (CA)
The primary purpose of cluster analysis is to assemble objects based on their characteristics by applying the Euclidean distance, which represents the difference between the analytical values of samples, frequently implies the similarity between each two samples (Pejman et al. Citation2009). Among various clustering methods, Ward’s approach is the most widely applied cluster method. In this work, the normalized data set is subjected to hierarchical agglomerative CA using Ward’s approach, in which the mean of the case is used to replace for missing data. (Hajigholizadeh and Melesse Citation2017), since CA is one of the powerful techniques to group the cases for hierarchical agglomerative clustering (Willett Citation1987). Additionally, squared Euclidean distance is used in CA processes as a measure of similarity between two separate parameters. It is more frequently utilized than a standard Euclidean distance because it can change the significance of big distances and diminish the significance of short distances (Hajigholizadeh and Melesse Citation2017). Then, using a relative linkage distance of Dlink/Dmax, where Dlink is the linkage distance between each two samples and Dmax is the maximum linkage distance, it is possible to determine the spatial variability of water quality over the entire network of rivers. The connectivity distance is then normalized by multiplying the quotient by 100 (Alberto et al. Citation2001).
2.4. Principal component analysis (PCA)
Principle component analysis (PCA) can minimize the dimensionality of the data set without significantly reducing the amount of information by explaining the link among multiple random uncorrelated environmental variables in terms of a limited number of underlying elements or principle components (Vega et al. Citation1998). The PCs are uncorrelated with one another, and each PC has a strong correlation with particular variables that each represent a particular dimension of the water quality (Zhao et al. Citation2011). Additionally, PC recommends data on the most important factors, which characterize an entire data collection and allow for data reduction with the minimum loss of original information (Helena et al. Citation2000). In this study, PCA is carried out using XLSTAT 2019.2.2, which by default uses the appropriate matrix of variables. Since the correlation coefficient is a standardized statistic, the PCA procedure incorporates a standardized procedure.
2.5. Statistical analysis and geospatial mapping
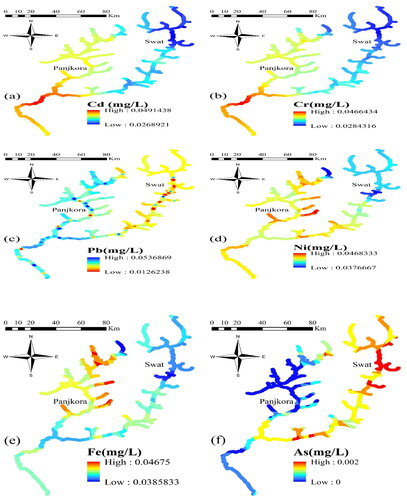
Based on obtained statistical analyzed data of both rivers, the characteristic of physiochemical and heavy metals is spatially distributed with the help of the kriging tool in the ArcMap 10.8 environment ( and ). The interpolated values of factors are symbolized with a stretch (Low to High) along a color ramp for the better visualization. The spatial distribution of suspended and dissolved factors in the Swat and Panjkora rivers exhibits substantial variability across different sites.
Figure 2. Distribution of physiochemical characteristics of rivers. (a) Potential of hydrogen, (b) Electroconductivity, (c) Total dissolved solids, and (d) Temperature.
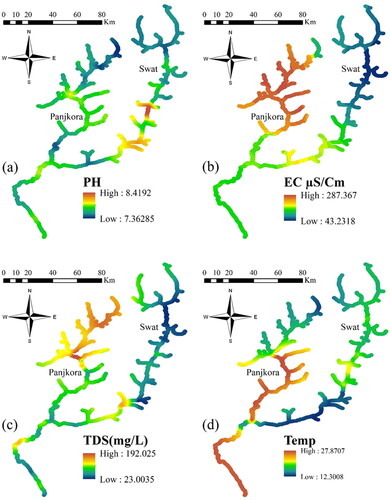
Figure 3. Heavy metal distribution. (a) Cd, (b) Cr, (c) Pb, (d) Ni, (e) Fe, and (f) As.
3. Results and discussion
3.1. Water quality classification
Water quality is vital for both the environment and humans health since polluted water have deleterious impacts on aquatic ecosystems (Carbajal-Hernández et al. Citation2013; Xu et al. Citation2017). Due to its importance, Khan et al. (Citation2022) recently conducted a study of water contamination in varying locations. However, the selected locations did not present the overall water contamination of the selected revisers. Therefore, it was needed to enhance the sample size to address the problem of water contamination. Hence, the current study is conducted to overcome the problem and highlight the clarity of water contamination on varying places. Two vital rivers of Khyber-Pakhtunkhwa are analyzed for heavy metals analysis and compare their pollution states. Overall, both the rivers are contaminated with heavy metals due to illicit digging for construction purposes, vehicle dust, hoteling, dumping of waste, agriculture runoff, industrial and hospital wastes, etc. Comparison of rivers water quality is rarely evaluated, and hence, to our best knowledge, this study is done for the first time to compared both the selected rivers water quality covering whole rivers through maximize the sample size (53 samples). The present study variates from previous studies as spatial interpolation were applied for few samples in previous studies to analyse the contamination status. Based on spatial interpolation both the selected rivers are thoroughly analyzed maximizing the sample size. In River Swat water samples, Cd, Cr, Pb, As Fe and Ni were reported in the range of 0.011–0.075, 0.012–0.073, 0.012–0.054, 0.00–0.002, 0.027-0.057 and 0.023-0.054 mg/L, respectively. It is observed that sewage site, hoteling, populated and industrialized sites were mostly polluted, whereas the minimum values were found at the non populates, non-congested areas. All the metals analyzed were significantly higher at every site, indicating the pollution status of river Swat. Besides the heavy metals analysis, physiochemical parameters were also analyzed such as pH, EC, TDS and temperature. The pH ranges from 7.4 to 8.6, the EC range from 40 to 309 µs/cm, and the TDS range from 23 to 193 mg/L.
In River Panjkora water samples, Cd, Cr, Pb, As Fe and Ni were reported in the range of 0.021–0.056, 0.025–0.048, 0.024–0.048, 0.00–0.002, 0.032–0.053, and 0.034-0.048 mg/L, respectively. The pollutions at sewage site, hoteling, populated and industrialized sites, whereas the minimum values are found at the non populates non-congested areas. In all the water samples, all the metals analyzed are significantly higher at every sites. This indicates the extreme pollution of heavy metals in River Panjkora. Besides the heavy metals analysis some of the physiochemical analysis is also performed, such as pH, EC, TDS and temperature. The pH ranges from 7.4 to 8.3, the EC range from 56 to 193 µs/cm, the TDS range from 23 to 133 mg/L. Overall, in our study, the concentration of metals observed are higher than the world health organization guidelines represent in , indicating the pollution in both the rivers is due to agriculture, municipal sewage and direct dumping from the adjacent cities and villages but variation in metals concentration occurred due to seasons (Aktan and Tekin-Özan Citation2012; Mulk et al. Citation2015). A higher concentration of Cd is observed in both the studied rivers 37.33 and 37.78 μg/L, respectively; previously, a higher concentration of Cd (61.74 μg/L) was observed in Hui River China (Wang et al. Citation2017). Other heavy metals such as Cr, Pb, and Ni are also observed at higher concentrations in this study, which closely resemble a previous reported study (Wang et al. Citation2017). The concentration of Fe detected in this study is higher from previous studies (Warnken and Santschi Citation2009; Li and Zhang Citation2010a; Citation2010b), similar to Xiao et al. (Citation2019) and lower than (Markich and Brown Citation1998; Wang et al. Citation2011; Varol and Şen Citation2012; Wang et al. Citation2017).
3.2. Multi-statistical analysis
3.2.1. Principal component analysis (PCA)
The relationship between heavy metals and physiochemical factors can be used to anticipate key details like the pathways for these pollutants’ emissions and their origin. The correlation matrix for the heavy metals and physiochemical parameters is determined using Pearson’s correlation coefficients and is displayed in . The correlation constant (r) value reveals how usefully and significantly the water samples are grouped in a straightforward line (). Since we are working in remote Alpine Glacial Lakes, the main sources of these heavy metals in the water may have come from long-range atmospheric transport, local rock weathering, local grazing of cows and sheep and nearby wildfires. However, because Swat and Dir are both agricultural areas and because agricultural runoff directly enters river water, it is possible that the use of inorganic, nitrogenous, and phosphate fertilizers as well as animal manures are the sources of the contamination of rivers. One of the main causes of the release of heavy metals into the ambient environment is the burning of coal and other fuels, including wood, rubber, tires, and other plastic debris in brick kilns (Khanoranga and Khalid Citation2019). To determine the sources of heavy metals in water samples, the PCA was used (Yüksel et al. Citation2023). A multivariate dataset’s dimensionality was intended to be reduced using PCA into a smaller number of components that describe and explain most of the data’s information. The PCA was effective and the nonidentity matrix for the research, as indicated by the Kaiser-Meyer-Olkin KMO test value for water of 0.470 and the high significance of Bartlett’s sphericity test of p < 0.0001 (Varol Citation2011). A maximum of four (4) components with eigenvalues (λ) > 1.0 from the PCA of the entire dataset accounted for 78.10% of the variance overall (). Varimax rotation is used to maximize the sum of variances of the factor coefficients, which better describes the potential influences on heavy metals. On the basis of the Kaiser criterion having an eigenvalue greater than 1, the number of prominent main components was taken into consideration (Kaiser Citation1960).
Table 2. Pearson correlation values in River Swat and River Panjkora, Pakistan.
Table 3. Principal component analysis results of surface water (n = 53) collected from Swat and Dir, Pakistan.
Table 4. Comparison of heavy metals concentrations (μg/L) in river water in River Swat and River Panjkora with other rivers in the world.
The number of PCs is determined using the scree plot (). The component plot in the circulates form of principal component analysis is displayed in . The factor loadings, cumulative percentage and percentage of variance are explained by each factor as given in with the component plot. A loading of greater than 0.70 correlates that Cr, Ni, Pb and Fe are linked with the first component (varifactor) of the PCA, which accounts for 30.70% of the total variance. The first varifactor VF1 shows the strength of the hydrochemical parameters, which indicates that heavy metals dominate the factor loading contribution. The second varifactor (VF2) is strongly correlated with high loadings (>0.90) which is mainly participated by EC, and TDS, since 21.44% of total variance is explained by the second varifactor (VF2). It was noteworthy that anthropogenic activities such industrial operations, the use of agrofertilizers, and the commercial and electroplating sectors could be linked to the high levels of certain physiochemical parameters (Gao et al. Citation2019). The third varifactor (VF3), which measures the impact of pH, showed that its loading value is larger than 0.60, indicating that the research area’s water quality is influenced by both natural and anthropogenic sources. Significant loading for as (>0.60) is seen in the fourth varifactor (VF4). This element may facilitate as dissolution in the water aquifers under study. In order to understand the underlying data structure, the Scree plot is utilized to determine how many PCs could be kept appropriately (Vega et al. Citation1998). The Scree plot in the present study displayed a noticeable shift in slope after the fourth Eigenvalue. Through FA on the PCs, equal numbers of VFs were produced for two sites. displays the corresponding VFs, variable loadings, and the variance explained. The factor loadings are categorized by Liu et al. (Citation2003) (Liu et al. Citation2003) as ‘strong’, ‘moderate’, and ‘weak’, respectively, with absolute loading values of >0.8, 0.8–0.50, and 0.50–0.30 since the majority of the hydrochemical factors specially heavy metals showed similar behaviour. Ion exchange, water-rock interaction, and anthropogenic sources are the sources of these variables. Fluorite, mica, biotite, and muscovite are some of the minerals that weather in rock and become the source of Fe in surface water. While other heavy metals come from anthropogenic causes and weathering, they are pollutants in the nearby agriculture along the river. Therefore, factor F1 reflects the contaminant’s anthropogenic and geogenic sources.
Figure 4. (a) Loading factor. (b) First initial factors F1, and F2.
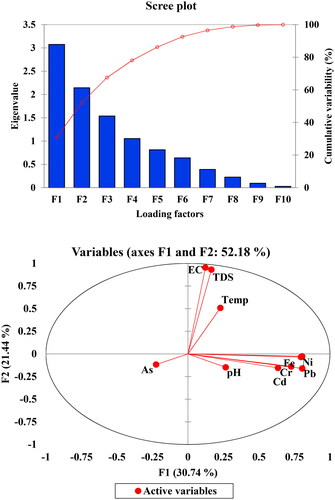
Figure 5. Dendrogram showing clustering of sampling stations River Swat and River Panjkora water quality features.
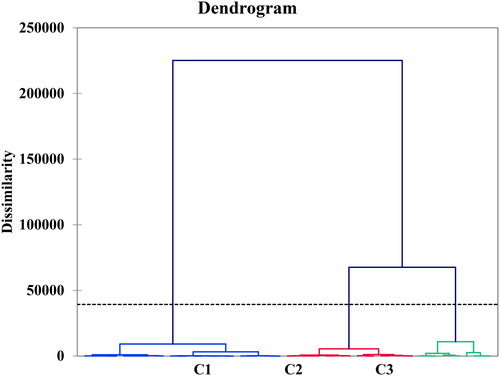
3.2.2. Cluster analysis
To group the sampling stations with similar water quality physiognomies, spatial cluster analysis (CA) is used. The eight (53) sampling locations are divided into three (3) clusters according to a dendrogram created by CA and grouped based on statistically significant clusters in a distant connection (Dlink/Dmax) × 100. A squared Euclidian distance and hierarchical clustering in accordance with Ward’s approach were both achieved (Varol et al. Citation2012; Hamil et al. Citation2017; Fathi et al. Citation2018). Based on CA results which are significant due to the clusters that are formed shared similar identifying characteristics as well as patterns of land use and reducing the clustering error in the freshwater data using hierarchical agglomerative clustering derived by factor scores. As a result, less polluted, polluted, and seriously polluted cluster classifications are created using cluster analysis on the freshwater data since between the classes variability is 22.85% and within class variability is 77.15%. The distance between the class centroid for the least polluted class in cluster C1 is (0, 81.499, 108.787). For the moderately polluted cluster C2, the distance between the class centroid is (81.499, 0, 28.242) and for cluster C3's severe polluted are (108.787, 28.242 and 0). River Swat water samples are represented by clusters C1 (11), C2(22) and C3(20). A total of 11 and 22 water samples are present in C1 and C2, from Swat and Panjkora river, respectively, and twenty samples from the rivers Swat and Panjkora are included in class C3. Observation 10, 37 and 24 represent water data centralized objects for three cluster analysis such as C1, C2 and C3 respectively. The average concentrations values observed in the present study for class C1 for pH, EC, TDS, temperature, Fe, Cd, Cr, Ni, Pb, As were (7.7, 72.0, 39.0, 17.0, 0.06, 0.02, 0.05, 0.05, 0.05 and 0.002 mg/L, respectively) as well as for C2 the concentrations values are (7.9, 151.0, 66.0, 27.0. 0.037, 0.038, 0.039, 0.039, 0.036 and 000 mg/L, respectively) in the water samples. The average concentrations values for C3 were (7.9, 172, 101, 12.5, 0.043, 0.043, 0.043, 0.043,0.046 and 0.002 mg/L, respectively) in the present study. Overall, both the rivers water is categorized as severely polluted, polluted and less polluted ().
Table 5. Descriptive statistics of trace elements collected from River Swat and River Panjkora water District Swat, Pakistan.
3.3. Spatial distribution of elements over the rivers
The spatial distribution of four physiochemical properties and six heavy metals demonstrates a non-uniform pattern across both rivers, indicating variations in their dispersion and concentration levels. The pH levels in the rivers are observed to be generally low to moderate, however, the highest recorded pH values are found in the Kalakot and Asharay regions (Samples 15 and 16). The EC in the northern section of the River Swat exhibits a notably low value. Conversely, in the middle region of the River Panjkora, a higher EC value is recorded. Moving downstream along both rivers, the EC values demonstrate a moderate range. Similarly, as EC, the highest TDS is recorded in the northern counterpart of the Panjkora River, whereas the low and moderate TDS is recorded in the river swat and southern part of Panjkora. In Panjkora River, the lowest temperature is recorded in the origin of the river and gradually increasing in temperature is recorded down the stream. Whereas in river swat moderate temperature is recorded in the northern part, the lowest temperature is recorded in the middle, while the highest temperature is noted in the southern part.
Among the 53 sites, the maximum Cd concentration can be seen down near the junction of both rivers (Samples 30–32). While the minimum Cd can be seen in the northern origin part of the swat river. The river Panjkora has more concentration of Cd than the river swat. Similarly, to Cd, the highest concentration of Cr can be observed near the confluence of both rivers (Samples 30–32). Conversely, the low concentration of Cr is found in the northern part of the Swat River. The river Panjkora possesses a significantly higher concentration of Cr in comparison to River Swat. The concentration of Cr gradually increased throughout the flow of water of the river. The Cr concentration is different down the stream, indicating the lower part of the river is Cr polluted. Lower parts of the river Kabul and almost the whole Panjkora river are the highest Pb contaminated site. Further, it can be presumed that the river Panjkora is more Pb polluted, and it contributes Pb pollution to the river Kabul. Ni concentrations are lowest in the northern part of the river swat, and moderately concentrated in the river Panjkora and lower part of the river Swat. The concentration of Fe is lower and moderate in the entire river swat, whereas the middle of the central part of river Panjkora River is highly concentrated. In contrast, the northern river swat is highly concentrated, whereas the central river Panjkora and lower river swat are lowly concentrated. Overall, Cd, Cr, Pb, Ni, and Fe concentrations in the river Panjkora ranged from moderate to high. However, the river Swat contains high and moderate concentrations of As. From the spatial analysis, it can be concluded that the entire river Panjkora and downstream of the river swat are heavy metal polluted. Since heavy metals are non-degradable and not decomposable, they are likely to persist in the water flow over time.
4. Conclusion
The existing contamination by heavy metals in surface water is a foremost environmental concern over the globe. Thus, the current research monitors and assesses the heavy metal contamination in the surface water of 53 sampling sites along the selected rivers (Swat and Panjkora). The selected Rivers Swat and Panjkora, which are characterized by a cold climate and blue alpine glacier water, but currently facing pollution problems due to a variety of chemical pollutants, especially heavy metals. This study investigates the hydrochemistry of dissolved heavy metals in river water. The elevated heavy metal hazard in this region is mostly responsible for the poor river water quality, and the primary contaminants in river water are Cd, Cr, Pb, Ni and Fe. Cd, Pb, Cr and Ni are the main contaminants for human health in the health risk assessment, especially for children. The outcomes derived from the multivariate statistical analysis of each factor are spatially distributed across the river system to enhance visual representation and interpretation. Moreover, in this study both the largest rivers of the northern area of Pakistan are analyzed for heavy metals analysis and their results are compared. However, sediments and aquatic biota analysis of both the rivers are skipped. It is recommended that in future the pollution status of both the rivers are analyzed based on sediments and biota samples, which will give a clear insight of the pollution status of these rivers. The quality of the water and the subsequent risk to human health were frequently ignored in the River Swat and River Panjkora due to economic limitations and a lack of awareness of water safety. Development of contamination control management at these relevant locations is required, or search for new, high-quality water sources, particularly for agricultural uses. Effective health education for heavy pollution in river Swat and river Panjkora, as well as a long-term monitoring program for heavy metals and other potential constituents in surface water is required.
Authors contribution
All authors contributed equally.
Availability of data and codes
The data and codes used for the preparation of the manuscript is available with the corresponding author and can be provided upon request.
Consent to participate
All authors voluntarily agreed to participate in this research.
Consent to publish
All authors are agreed to for publication, there is no legal constraint in publishing the data used in the manuscript.
Ethical statement
All procedures followed were in accordance with the ethical standards with the Helsinki Declaration of 1975, as revised in 2000.
Disclosure statement
No potential conflict of interest was reported by the authors.
References
- Aktan N, Tekin-Özan S. 2012. Levels of some heavy metals in water and tissues of chub mackerel (Scomber japonicus) compared with physico-chemical parameters, seasons and size of the fish. J Anim Plant Sci. 22(3):605–613.
- Alam M, Dafader N, Sultana S, Rahman N, Taheri T. 2017. Physico-chemical analysis of the bottled drinking water available in the Dhaka city of Bangladesh. J Mater Environ Sci. 8:2076–2083.
- Alberto WD, del Pilar DM, Valeria AM, Fabiana PS, Cecilia HA, de Los Ángeles BM. 2001. Pattern recognition techniques for the evaluation of spatial and temporal variations in water quality. a case study: Suquı́a River Basin (Córdoba–Argentina). Water Res. 35(12):2881–2894. doi: 10.1016/s0043-1354(00)00592-3.
- Astel A, Tsakovski S, Barbieri P, Simeonov V. 2007. Comparison of self-organizing maps classification approach with cluster and principal components analysis for large environmental data sets. Water Res. 41(19):4566–4578. doi: 10.1016/j.watres.2007.06.030.
- Bilgin A, Konanç MU. 2016. Evaluation of surface water quality and heavy metal pollution of Coruh River Basin (Turkey) by multivariate statistical methods. Environ Earth Sci. 75(12):1–18. doi: 10.1007/s12665-016-5821-0.
- Bonsignore M, Andolfi N, Barra M, Madeddu A, Tisano F, Ingallinella V, Castorina M, Sprovieri M. 2016. Assessment of mercury exposure in human populations: a status report from Augusta Bay (southern Italy). Environ Res. 150:592–599. doi: 10.1016/j.envres.2016.01.016.
- Carafa R, Faggiano L, Real M, Munné A, Ginebreda A, Guasch H, Flo M, Tirapu L, von der Ohe PC. 2011. Water toxicity assessment and spatial pollution patterns identification in a Mediterranean River Basin District. Tools for water management and risk analysis. Sci Total Environ. 409(20):4269–4279. doi: 10.1016/j.scitotenv.2011.06.053.
- Carbajal-Hernández JJ, Sánchez-Fernández LP, Villa-Vargas LA, Carrasco-Ochoa JA, Martínez-Trinidad JF. 2013. Water quality assessment in shrimp culture using an analytical hierarchical process. Ecol Indic. 29:148–158. doi: 10.1016/j.ecolind.2012.12.017.
- Dasar KN, Ahmad A, Mushrifah I, Shuhaimi-Othman M. 2009. Water quality and heavy metal concentrations in sediment of Sungai Kelantan, Kelantan, Malaysia: a baseline study. Sains Malaysiana 38:435–442.
- Edward JB, Idowu E, Oso J, Ibidapo O. Determination of heavy metal concentration in fish samples, sediment and water from Odo-Ayo River in Ado-Ekiti, Ekiti-State, Nigeria. Int J Environ Monit Analysis. 1(1):27–33. doi: 10.11648/j.ijema.20130101.14.
- Elbaz-Poulichet F, Seidel J-L, Casiot C, Tusseau-Vuillemin M-H. 2006. Short-term variability of dissolved trace element concentrations in the Marne and Seine Rivers near Paris. Sci Total Environ. 367(1):278–287. doi: 10.1016/j.scitotenv.2005.11.009.
- Fathi E, Zamani-Ahmadmahmoodi R, Zare-Bidaki R. 2018. Water quality evaluation using water quality index and multivariate methods, Beheshtabad River, Iran. Appl Water Sci. 8(7):1–6. doi: 10.1007/s13201-018-0859-7.
- Gao B, Gao L, Gao J, Xu D, Wang Q, Sun K. 2019. Simultaneous evaluations of occurrence and probabilistic human health risk associated with trace elements in typical drinking water sources from major river basins in China. Sci Total Environ. 666:139–146. doi: 10.1016/j.scitotenv.2019.02.148.
- Giri S, Singh AK. 2014. Assessment of surface water quality using heavy metal pollution index in Subarnarekha River, India. Water Qual Expo Health. 5(4):173–182. doi: 10.1007/s12403-013-0106-2.
- Hajigholizadeh M, Melesse AM. 2017. Assortment and spatiotemporal analysis of surface water quality using cluster and discriminant analyses. Catena. 151:247–258. doi: 10.1016/j.catena.2016.12.018.
- Hamil S, Baha M, Arab S, Doukhandji N, Arab A. 2017. A multivariate analysis of water quality in Lake Ghrib, Algeria, p. 805–807. In Recent Advances in Environmental Science from the Euro-Mediterranean and Surrounding Regions: Proceedings of Euro-Mediterranean Conference for Environmental Integration (EMCEI-1), Tunisia. Springer.
- Helena B, Pardo R, Vega M, Barrado E, Fernandez JM, Fernandez L. 2000. Temporal evolution of groundwater composition in an alluvial aquifer (Pisuerga River, Spain) by principal component analysis. Water Res. 34(3):807–816. doi: 10.1016/S0043-1354(99)00225-0.
- Ikem A, Adisa S. 2011. Runoff effect on eutrophic lake water quality and heavy metal distribution in recent littoral sediment. Chemosphere. 82(2):259–267. doi: 10.1016/j.chemosphere.2010.09.048.
- Kaiser HF. 1960. The application of electronic computers to factor analysis. Educ Psychol Meas. 20(1):141–151. doi: 10.1177/001316446002000116.
- Khanoranga , Khalid, S. 2019. An assessment of groundwater quality for irrigation and drinking purposes around brick kilns in three districts of Balochistan province, Pakistan, through water quality index and multivariate statistical approaches. J Geochem Explor. 197:14–26. doi: 10.1016/j.gexplo.2018.11.007.
- Khan M, Almazah MM, EIlahi A, Niaz R, Al-Rezami A, Zaman B. 2023. Spatial interpolation of water quality index based on Ordinary kriging and Universal kriging. Geomatics Nat Hazards Risk. 14(1):2190853. doi: 10.1080/19475705.2023.2190853.
- Khan M, Ellahi A, Niaz R, Ghoneim ME, Tag-Eldin E, Rashid A. 2022. Water quality assessment of alpine glacial blue water lakes and glacial-fed rivers. Geomatics Nat Hazards Risk. 13(1):2597–2617. doi: 10.1080/19475705.2022.2126800.
- Khanna D, Ishaq F. 2013. Impact of water quality attributes and comparative study of icthyofaunal diversity of Asan Lake and River Asan. JANS. 5(1):200–206. doi: 10.31018/jans.v5i1.306.
- Kormoker T, Idris AM, Khan MM, Tusher TR, Proshad R, Islam MS, Khadka S, Rahman S, Kabir MH, Kundu S. 2022. Spatial distribution, multivariate statistical analysis, and health risk assessment of some parameters controlling drinking water quality at selected primary schools located in the southwestern coastal region of Bangladesh. Toxin Rev. 41(1):247–260. doi: 10.1080/15569543.2020.1866012.
- Krishna AK, Satyanarayanan M, Govil PK. 2009. Assessment of heavy metal pollution in water using multivariate statistical techniques in an industrial area: a case study from Patancheru, Medak District, Andhra Pradesh, India. J Hazard Mater. 167(1-3):366–373. doi: 10.1016/j.jhazmat.2008.12.131.
- Kurnaz A, Mutlu E, Uncumusaoğlu AA. 2016. Determination of water quality parameters and heavy metal content in surface water of Çiğdem Pond (Kastamonu/Turkey). Turkish JAF SciTech. 4(10):907–913. doi: 10.24925/turjaf.v4i10.907-913.942.
- Lawson E. 2011. Physico-chemical parameters and heavy metal contents of water from the Mangrove Swamps of Lagos Lagoon, Lagos, Nigeria. Adv Biol Res. 5:8–21.
- Li S, Zhang Q. 2010a. Risk assessment and seasonal variations of dissolved trace elements and heavy metals in the Upper Han River, China. J Hazard Mater. 181(1-3):1051–1058. doi: 10.1016/j.jhazmat.2010.05.120.
- Li S, Zhang Q. 2010b. Spatial characterization of dissolved trace elements and heavy metals in the upper Han River (China) using multivariate statistical techniques. J Hazard Mater. 176(1-3):579–588. doi: 10.1016/j.jhazmat.2009.11.069.
- Liu C-W, Lin K-H, Kuo Y-M. 2003. Application of factor analysis in the assessment of groundwater quality in a blackfoot disease area in Taiwan. Sci Total Environ. 313(1-3):77–89. doi: 10.1016/S0048-9697(02)00683-6.
- Lu Y, Khan H, Zakir S, Ihsanullah , Khan S, Khan AA, Wei L, Wang T. 2013. Health risks associated with heavy metals in the drinking water of Swat, northern Pakistan. J Environ Sci (China), 1025: 2003–2013. doi: 10.1016/s1001-0742(12)60275-7.
- Markich SJ, Brown PL. 1998. Relative importance of natural and anthropogenic influences on the fresh surface water chemistry of the Hawkesbury–Nepean River, south-eastern Australia. Sci Total Environ. 217(3):201–230. doi: 10.1016/s0048-9697(98)00188-0.
- Mokarram M, Pourghasemi HR, Huang K, Zhang H. 2022. Investigation of water quality and its spatial distribution in the Kor River basin, Fars province, Iran. Environ Res. 204(Pt C):112294. doi: 10.1016/j.envres.2021.112294.
- Mulk S, Azizullah A, Korai AL, Khattak MNK. 2015. Impact of marble industry effluents on water and sediment quality of Barandu River in Buner District, Pakistan. Environ Monit Assess. 187(2):8. doi: 10.1007/s10661-014-4221-8.
- Mulk S, Korai AL, Azizullah A, Khattak MNK. 2016. Decreased fish diversity found near marble industry effluents in River Barandu, Pakistan. Ecotoxicology. 25(1):132–140. doi: 10.1007/s10646-015-1575-9.
- Nasir MJ, Ahmad W, Jun C, Iqbal J, Bateni SM. 2023. Soil erosion susceptibility assessment of Swat River sub-watersheds using the morphometry-based compound factor approach and GIS. Environ Earth Sci. 82(12):315. doi: 10.1007/s12665-023-10982-4.
- Nasir MJ, Iqbal J, Ahmad W. 2020. Flash flood risk modeling of swat river sub-watershed: a comparative analysis of morphometric ranking approach and El-Shamy approach. Arab J Geosci. 13(20):1–19. doi: 10.1007/s12517-020-06064-5.
- Osman AG, Kloas W. 2010. Water quality and heavy metal monitoring in water, sediments, and tissues of the African Catfish Clarias gariepinus (Burchell, 1822) from the River Nile, Egypt. JEP. 01(04):389–400. doi: 10.4236/jep.2010.14045.
- Pal D, Maiti SK. 2019. Evaluation of potential human health risks from toxic metals via consumption of cultured fish species Labeo rohita: a case study from an urban aquaculture pond. Expo Health. 11(1):33–46. doi: 10.1007/s12403-017-0264-8.
- Pejman A, Bidhendi G, Karbassi A, Mehrdadi N, Bidhendi ME. 2009. Evaluation of spatial and seasonal variations in surface water quality using multivariate statistical techniques. Int J Environ Sci Technol. 6(3):467–476. doi: 10.1007/BF03326086.
- Sfakianakis D, Renieri E, Kentouri M, Tsatsakis A. 2015. Effect of heavy metals on fish larvae deformities: a review. Environ Res. 137:246–255. doi: 10.1016/j.envres.2014.12.014.
- Shams MG, Nipa C, Foyzul HF. 2013. Fish diversity of the River Choto Jamuna, Bangladesh: present status and conservation needs. Int J Biodiver Conserv. 5:389–395.
- Sunjida SB, Yesmine S, Rahman I, Islam R. 2016a. Assessing the quality of household and drinking water in Tongi industrial zone of Bangladesh and its toxicological impact on healthy Sprague Dawley rats. J Appl Pharm. 8(3):2. doi: 10.21065/1920-4159.1000224.
- Sunjida SB, Yesmine S, Rahman I, Islam R. 2016b. Assessing the quality of household and drinking water in Tongi Industrial Zone of Bangladesh and its toxicological impact on healthy Sprague Dawley rats. J Appl Pharm. 8(224):2.
- Topaldemir H, Taş B, Yüksel B, Ustaoğlu F. 2023. Potentially hazardous elements in sediments and Ceratophyllum demersum: an ecotoxicological risk assessment in Miliç Wetland, Samsun, Türkiye. Environ Sci Pollut Res Int. 30(10):26397–26416. doi: 10.1007/s11356-022-23937-2.
- Ullah K, Zhang J. 2020. GIS-based flood hazard mapping using relative frequency ratio method: a case study of Panjkora River Basin, eastern Hindu Kush, Pakistan. PLoS One. 15(3):e0229153. doi: 10.1371/journal.pone.0229153.
- Ustaoğlu F, Tepe Y, Aydın H, Akbaş A. 2017. Investigation of water quality and pollution level of lower Melet River, Ordu, Turkey. Alinteri J Agric Sci. 32:69–79.
- Varol M. 2011. Assessment of heavy metal contamination in sediments of the Tigris River (Turkey) using pollution indices and multivariate statistical techniques. J Hazard Mater. 195:355–364. doi: 10.1016/j.jhazmat.2011.08.051.
- Varol M, Gökot B, Bekleyen A, Şen B. 2012. Water quality assessment and apportionment of pollution sources of Tigris River (Turkey) using multivariate statistical techniques—a case study. River Res Applic. 28(9):1428–1438. doi: 10.1002/rra.1533.
- Varol M, Şen B. 2012. Assessment of nutrient and heavy metal contamination in surface water and sediments of the upper Tigris River, Turkey. Catena. 92:1–10. doi: 10.1016/j.catena.2011.11.011.
- Vega M, Pardo R, Barrado E, Debán L. 1998. Assessment of seasonal and polluting effects on the quality of river water by exploratory data analysis. Water Res. 32(12):3581–3592. doi: 10.1016/S0043-1354(98)00138-9.
- Wang J, Liu G, Liu H, Lam PK. 2017. Multivariate statistical evaluation of dissolved trace elements and a water quality assessment in the middle reaches of Huaihe River, Anhui, China. Sci Total Environ. 583:421–431. doi: 10.1016/j.scitotenv.2017.01.088.
- Wang L, Wang Y, Xu C, An Z, Wang S. 2011. Analysis and evaluation of the source of heavy metals in water of the River Changjiang. Environ Monit Assess. 173(1-4):301–313. doi: 10.1007/s10661-010-1388-5.
- Warnken KW, Santschi PH. 2009. Delivery of trace metals (Al, Fe, Mn, V, Co, Ni, Cu, Cd, Ag, Pb) from the Trinity River watershed towards the ocean. Estuaries Coasts. 32(1):158–172. doi: 10.1007/s12237-008-9088-x.
- Willett J. 1987. Similarity and clustering in chemical information systems. John Wiley & Sons, Inc.
- Xiao J, Wang L, Deng L, Jin Z. 2019. Characteristics, sources, water quality and health risk assessment of trace elements in river water and well water in the Chinese Loess Plateau. Sci Total Environ. 650(Pt 2):2004–2012. doi: 10.1016/j.scitotenv.2018.09.322.
- Xu C, Li E, Liu Y, Wang X, Qin JG, Chen L. 2017. Comparative proteome analysis of the hepatopancreas from the Pacific white shrimp Litopenaeus vannamei under long-term low salinity stress. J Proteomics. 162:1–10. doi: 10.1016/j.jprot.2017.04.013.
- Yuksel B, Arica E. 2018. Assessment of toxic, essential, and other metal levels by ICP-MS in Lake Eymir and Mogan in Ankara, Turkey: an environmental application. At Spectrosc. 39(5):179–184. doi: 10.46770/AS.2018.05.001.
- Yüksel B, Ustaoğlu F, Arica E. 2021. Impacts of a garbage disposal facility on the water quality of çavuşlu stream in Giresun, Turkey: a health risk assessment study by a validated ICP-MS assay. Aquat Sci Eng. :181–192. doi: 10.26650/ASE2020845246.
- Yüksel B, Ustaoğlu F, Tokatli C, Islam MS. 2022. Ecotoxicological risk assessment for sediments of Çavuşlu stream in Giresun, Turkey: association between garbage disposal facility and metallic accumulation. Environ Sci Pollut Res Int. 29(12):17223–17240. doi: 10.1007/s11356-021-17023-2.
- Yüksel B, Ustaoğlu F, Yazman MM, Şeker ME, Öncü T. 2023. Exposure to potentially toxic elements through ingestion of canned non-alcoholic drinks sold in Istanbul, Türkiye: a health risk assessment study. J Food Compos Anal. 121:105361. doi: 10.1016/j.jfca.2023.105361.
- Zeng X, Liu Y, You S, Zeng G, Tan X, Hu X, Hu X, Huang L, Li F. 2015. Spatial distribution, health risk assessment and statistical source identification of the trace elements in surface water from the Xiangjiang River, China. Environ Sci Pollut Res Int. 22(12):9400–9412. doi: 10.1007/s11356-014-4064-4.
- Zhang Y, Chu C, Li T, Xu S, Liu L, Ju M. 2017. A water quality management strategy for regionally protected water through health risk assessment and spatial distribution of heavy metal pollution in 3 marine reserves. Sci Total Environ. 599-600:721–731. doi: 10.1016/j.scitotenv.2017.04.232.
- Zhao G, Gao J, Tian P, Tian K, Ni G. 2011. Spatial–temporal characteristics of surface water quality in the Taihu Basin, China. Environ Earth Sci. 64(3):809–819. doi: 10.1007/s12665-011-0902-6.