
 ?Mathematical formulae have been encoded as MathML and are displayed in this HTML version using MathJax in order to improve their display. Uncheck the box to turn MathJax off. This feature requires Javascript. Click on a formula to zoom.
Abstract
Evaluation of a site suitability for sustainable urban settlement growth is crucial. A system for evaluating an interaction between the factors must be established to assure that critical site selection interrelationships are not neglected. To solve this problem, the proposed methodology was evaluated to identify a suitable site for sustainable residential development in Nashik, India. The Geographic information system (GIS)-based multi-influence factor (MIF) approach is used in this study to find ideal locations for future urban settlement. The assessment was based on 11 factors including vegetation, elevation, land use, industry, drainage network, slope, water bodies, road, health services, railway station and population density. The sustainable site suitability was delineated by aggregating all considered factors and their associated MIF weights using the interrelationship between the factors. The results showed that 27.26% of research area was not ideal for settlement development, 16.82% was low suitable, 30.65% was moderately suitable, 16.48% was highly suitable and 8.77% was very highly suitable. Most of the suitable sites were located near the existing habitant area, and major roads. The suitability sites were validated using receiver-operating characteristic (ROC), and area under curve (AUC) value of 0.895 indicated that the model was effective. Sensitivity analysis revealed that the distance from road, drainage network, and health services are the dominant for selecting the optimal location of settlement development in research area. The findings of the delineated ideal areas for the intensive urban settlement development will be helpful to planners and policy makers for sustainable urban growth in the near future.
1. Introduction
One of the fundamental principles of building design is site selection, which is crucial and directly influences the design of current development (Cheng et al. Citation2007). Finding the ideal placement for a structure in a specific area is the goal of acceptable site selection (Ghobarah Citation1987). Environmental, economic and social factors are all part of the concept of sustainable development provided by Kahn (Citation1995) and UNESCO (Citation2005). Building orientation, neighborhood development, accessibility to amenities, infrastructure and public transportation facilities, vegetation (flora and fauna), surrounding communities, safety and security, etc., are some of the factors that affect where buildings are placed. Other factors include restricted land types, local climatic conditions, neighborhood development and neighborhood development. Both the location and choice of the building’s site are crucial. The project’s contribution to the sustainability of the environment will be determined by its relationship with and significance to the local ecosystem, watershed zones and community (Draper et al. Citation2011). Sustainable site selection and design helps contribute to reduction in greenhouse gas (GHG) emissions and results in adapting to the effects of climate change (Rane et al. Citation2023; Rolnick et al. Citation2023).
Global issues including rising pollution levels and climate change have made it necessary for policymakers to create eco-friendly plans for a sustainable future (Sharma Citation2018). Over the last 30 years, various methods have been established addressing the site selection problem (Mallick et al. Citation2022). Several safe site selection techniques are presented in the literature. However, most locations are picked based on precise guidelines provided by national government organizations, leaving the ultimate, perhaps biased decision to the architects and engineers. There are existing tools that are heuristic or are based on simple visualization software that fails to consider spatial aspects important to site selection. The choice of site has a significant impact on whether a project is successful or unsuccessful. Especially in developing countries, projects often fail due to unsuitable building sites (Ghobarah Citation1987). A building can be constructed in an ideal site with least number of resources (people and equipment, materials, machines, money and time), in a manner that is logistically and economically feasible, and that is also sufficiently and economically viable for future growth (Dai et al. Citation2001; Kuta et al. Citation2016).
Given the huge population and rising urbanization in the country is resulting in demand for new buildings, putting pressure on available resources (James, Citation2019). Identifying new sites for development or improvement is becoming increasingly difficult (Liu et al. Citation2015; Caprioli and Bottero Citation2021). Governments are implementing green programmes to stop environmental damage as environmental awareness grows (Ho et al. Citation2013). To promote sustainable development and provide incentives, the government offers benefits, such as tax credits, reimbursement of registration fees, loans and free services (TERI, Citation2006). The Government of India supports organizations like Indian Green Building Council (IGBC), Green Rating for Integrated Habitat Assessment (GRIHA) and TERI (Citation2006) that work to promote green buildings (Potbhare et al. Citation2009). Resource reduction has therefore led to shift the focus towards sustainable construction. The building construction sector is essential to addressing societal requirements since it raises living standards (Alwan et al. Citation2017; Doan et al. Citation2017; Hwang et al. Citation2017; Rolnick et al. Citation2023). ; Industry generates 45–65% of the waste that ends up in landfills and is responsible for 35% of the world’s CO2 emissions (Lima et al. Citation2021). In addition to other activities, the construction industry has a major impact on dangerous emissions. In other words, building operations, which account for around 30% of the planet’s GHG emissions, result in 18% of the GHG emissions from transportation and processing of construction materials (Escamilla et al. Citation2016). With increasing global awareness and various issues such as global warming, climate change, population growth and urbanization, sustainability in building construction has become very important, leading to the emergence of green building for sustainable development because the demand is growing (Butera Citation2010; Gou and Xie Citation2017).
Sustainable selection of locations depends on a variety of criteria, is inherently heterogeneous, and requires optimization methods to assess impacts and how they affect each other (Erbas et al. Citation2018). Suitability analysis, which aids in choosing the optimum places for diverse objectives, is essential for sustainable planning and development (Singh Citation1978; Kumar and Shaikh Citation2013; Rane and Jayaraj Citation2022a). One of the most beneficial Geographic information systems (GISs) applications is a tool that is integrated GIS-based techniques (Malczewski, Citation2004). A number of methods have been used to analyse the suitability of a site, like the land suitability index models (Marull et al. Citation2007; Qiu and Zhang Citation2011; Vasu et al. Citation2018), multi-criteria evaluation (MCE) (Kumar and Shaikh Citation2013; Montgomery and Dragićević Citation2016), analytic hierarchy process (AHP) (Saaty Citation1980; Bait et al. Citation2022; Tripathi et al. Citation2022), urban growth suitability index (Dong et al. Citation2008) and artificial intelligence techniques (Malczewski Citation2004; Mugiyo et al. Citation2021). Multi-criteria decision-making (MCDM) methodologies have advanced significantly in several fields recently (Chen et al. Citation2011; Bhattacharya et al. Citation2020; Emovon and Oghenenyerovwho Citation2020; Jahangiri et al. Citation2020; Siksnelyte-Butkiene et al. Citation2020; Sarkar et al. Citation2022; Sotoudeh-Anvari Citation2022). Methodologies for MCDM have lately made considerable strides in a variety of disciplines (Abdel-malak et al. Citation2017; Nzotcha et al. Citation2019; Ali et al. Citation2022; Yoris-Nobile et al. Citation2023). ; Ranking is the primary objective and goal of MCDM. Decision-makers can now choose solutions based on pre-established criteria. Physical, ecological and financial factors are among the many factors that affect the choice of a sustainable building site. The physical characteristics of the land can be determined by examination of land use/cover, landscape variables, topographic factors, geology, distance from roadways, current construction or development regions, etc. This is particularly ideal for GIS analysis (Pande et al. Citation2021; Mallick et al. Citation2022).
MIF is the most readily available, trustworthy and adaptable tool for examining the growth of residential structures in comparison to other approaches. Only a few studies have utilized MIF in the field of our research (Mallick et al. Citation2022). Then, the application of the integrated GIS-based MIF technique which consider the interrelationship among the influencing factors for the site selection is very effective (Rajasekhar et al. Citation2018; Mandal et al. Citation2021; Bera et al. Citation2022; Nega et al. Citation2022). However, so far, studies have not been found that have used the MIF technique for sustainable site selection for the residential building development. In this article, GIS has been integrated with MIF technique to consider the interrelation among the geo-environmental, geo-physical and socio-economic factors for selecting the sustainable residential construction site for optimal settlement of human activities. Following section provides the description of the study area, methodology used to achieve the objectives and results with discussion,
2. Study area
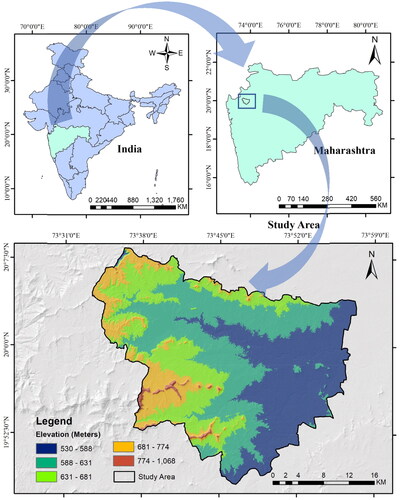
The study area has, named Nashik city, is an area of 890 sq.km, located in the north-west direction of Maharashtra, above mean sea level of 530 m. Nashik has experienced rapid urbanization, leading to challenges in urban planning and infrastructure development. Issues, such as traffic congestion, inadequate public transportation and a shortage of affordable housing are common. Like many urban areas in India, Nashik faces air pollution challenges, primarily due to vehicular emissions and industrial activities. Poor air quality can have adverse effects on public health. While Nashik is experiencing growth, there is a need for continuous infrastructure development, including roads, public transportation, and utilities, to support the city’s expanding population and industries. Ensuring a sustainable and adequate supply of clean drinking water is a significant challenge. Nashik’s dependency on the Godavari River makes it susceptible to fluctuations in water availability, and water quality concerns persist. It is situated on the bank of the Godavari River. shows the study area location with elevation. Study area falls in parts of Survey of India (SOI) toposheets 47-I, 47-E, 46-L and 46-H. According to the Census (Citation2011), Nashik city has 6,107,187 populations. In terms of both population and size, Nashik is the third-largest city in Maharashtra. The city’s large population coupled with the absence of a well-defined development plan by government agencies highlights the urgency and importance of assessing the area’s sustainability. This makes it a pertinent location for research and intervention. In summary, Nashik city’s significant population, lack of a well-defined development plan, diverse geography, unique climate and economic importance make it a compelling choice for a comprehensive study on urban sustainability, development planning, and environmental management. The study can offer valuable insights into addressing urban challenges and fostering sustainable growth in similar regions. Nashik is the third-largest city in Maharashtra, with a population of over 6 million people according to the 2011 Census. Its substantial population size makes it a critical area to study, especially in the context of urban development and sustainability. The district is a portion of the northern Tapi basin and southern Godavari basin. The two prominent rivers through the district are Girna and Godavari. The climate of Nashik is characterized as semi-arid in which year-round overall dryness, with the exception of the south-west monsoon season (Kulkarni and Pardeshi Citation2019). The summertime maximum temperature is 42.5 °C, and the wintertime temperature is less than 5.0 °C. There is a 43 − 62% relative humidity range. The area typically receives the normal yearly rainfall between 575 and 2500 mm (CGWB Citation2014). The district is a portion of the Deccan Plateau and Western Ghat. Nasik district has a variety of terrain in terms of its physiography. The gradient in the Nashik district is decreasing from west (severe) to east (gentle). The cultivation of grapes is well known in Nashik, the regional center of north Maharashtra, India. The tourist industry and economy in Nashik has potential expansion (Gadakh et al. Citation2015).
Figure 1. Research area location with elevation.
2.1. Sustainability issues of urban settlement
City spatial transformation is a continuous and complicated cycle characterized by excessive and sometimes loss of natural habitat, unregulated industrial growth, quick and haphazard urban growth, escalating air pollution and depletion of water and other natural resources (Barredo and Demicheli Citation2003; Lehmann Citation2008). The world’s natural landscape has substantially changed as a result of urbanization (Rao et al. Citation2021). Urban land use results in significant environmental changes, and human development activities have an impact on the ecosystem (Wang et al. Citation2018). An increase in population has an impact on how cities grow (Brockerhoff Citation1999; Robson Citation2006; Bianchini et al. Citation2021). Settlement growth substantially alters land use. Numerous negative repercussions of these settlements include biodiversity loss, a decline in arable land, deteriorating landscape quality, irreversible loss of environmental resources and decreased quality of life. In recent years, urban sustainability has grown in importance for construction projects (Bulti and Assefa Citation2019; Chang et al. Citation2020). The selection of an appropriate location is the first step in sustainable building. The accessibility, energy use, safety, security, environment, utilization of existing infrastructure and local environmental conditions, etc., are the variables that are significantly impacted by a building’s location. Understanding sustainability issues and how they affect a building’s overall safety and performance is important for engineers and architects who are in responsible of site selection (Singh and Raghubanshi Citation2020; Poon Citation2021). Because of this, the comprehensive evaluation becomes more crucial when choosing a sustainable location.
For sustainable planning, the land use for settlements should be appropriately governed. To determine the optimal spatial patterns for future use of land, suitable land-use policies necessitate the formation of sustainable planning priorities and employ the decision support system. Environmental damage from unplanned and uncontrolled urban sprawl is prevented by site appropriateness assessments in urban planning and development (Jarah et al. Citation2019; Pawe and Saikia Citation2020; Pande et al. Citation2023). The sustainability of cities can be impacted by a variety of environmental conditions. Urban expansion is a challenge that most cities throughout the world have been dealing with (Chakraborty et al. Citation2022). In developing nations like India, it is more severe (Bhagat and Mohanty Citation2009; Chadchan and Shankar Citation2012; Pawe and Saikia Citation2020). Urbanization in Nashik city is experiencing rapid growth (Poyil and Misra Citation2015; Yadav et al. Citation2016). In Nashik city, urban growth has been the cause of the expanding land usage which is occurred from the city center to the city’s outskirts. Nashik will require more land as a result of expanding populations (Kumar Citation2021; Yadav and Karmakar Citation2021). The necessity to acquire land for settlements in the Nashik city therefore will grow. These circumstances impact urban planning and development and raise land costs. Due to the enormous population expansion and urban sprawl, as well as the need to maintain ecologic balance, it is crucial to identify suitable locations for future settlement development and ensure that various land categories are used in the best possible ways.
3. Material and methods
3.1. Collection and preparation of GIS database
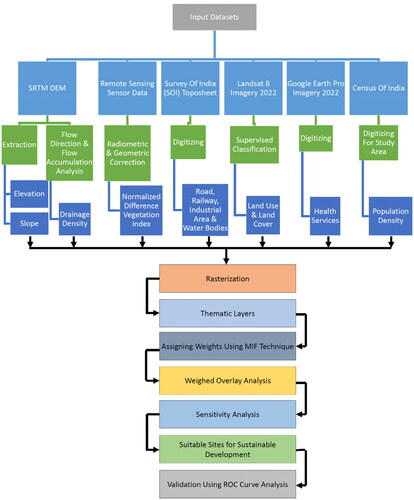
Site selection of sustainable building construction is controlled by various influencing factors, such as Geo-environmental factors; distance to industry, water treatment plant and vegetation density etc., Geo-physical factors; elevation, land use, slope and distance to drainage network, water bodies etc., and socio-economic factors; distance to road network, health services, railway network, population density, etc. The elements that affect the selection of a sustainable site were selected by taking into account the impact of the variables and the accessibility of site investigation and geospatial data. In this study, eleven geo-environmental, geo-physical and socio-economic variables were chosen to assess the location for a sustainable settlement, and for each influencing variable, the thematic layer was provided. A structured identification process was used to create the land use map in the ERDAS Imagine 2018 program. The Normalized Difference Vegetation Index (NDVI) data from 2011 to 2021 were prepared using Landsat 8 OLI sensor data and averaged to prepare the vegetation thematic layer. The ArcGIS spatial analyser application was used to create slope, drainage density, and elevation layouts using the 30 m Shuttle Radar Topography Mission (SRTM) DEM dataset. Digitalization was conducted for the distance from water bodies, railway station, industrial area and road network in the study region using the toposheets that acquired from SOI and further verified by means of Landsat-8 imagery. The health services are digitized using the Google Earth Pro software. Besides, population censes data were extracted from the Census (Citation2011). shows the flowchart of implemented steps to ranking different options regarding suitability of sustainable residential building.
Figure 2. Flowchart of suitable building construction selection using MIF.
3.2. Delineation of appropriate locations for sustainable development of residential building
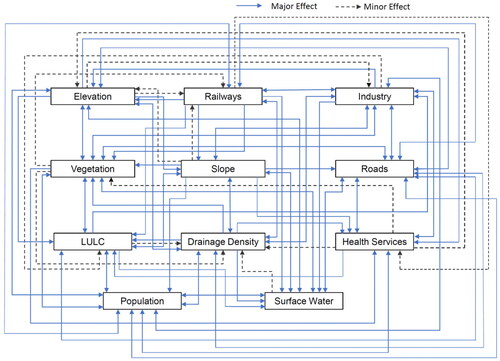
The considered factors for siting residential building sustainable development are defined to clarify how they can influence the final assessment. Since these factors do not have an equal impact on suitability evaluation, the multi-influence factor (MIF) approach is developed to weigh the influential indicators. Weighing considered indicators is an important process that must be handled with care. The results of this step significantly impact the final results. In this research, the MIF approach is employed that distributes the weights by constructing a relationship between the variables to make robust outcomes. Literature research focusing on interrelationship between the MIF were employed to assess the applicability of each factor in the computation procedures (Kumar and Shaikh Citation2013; Poyil and Misra Citation2015; Raut et al. Citation2016; Nassereddine and Eskandari Citation2017; Rao et al. Citation2021; Saha and Roy Citation2021; Singh et al. Citation2021; Mallick et al. Citation2022). The relationships are determined according to the impact of a mutual relationship between variables, including major, equal to 1; minor, equal to 0.5; and no-effect, equal to 0. The relative weights in terms of settlement were calculated using the combined major and minor effects. For instance, land use had a major effect on vegetation and vegetation had an indirect effect on drainage density. Interrelationships through influential indicators are depicted in .
Figure 3. Relation between the multi-influencing factors of suitable settlement development.
The total value of each variable is composed of overall scores of major and minor impacts of the corresponding variable with others. This value represents the importance of each variable. The weight was computed for each influencing variable by the below equation:
(1)
(1)
where W, Mx and My represent weight, major and minor effects. Using cumulative weights, the appropriateness of sites is evaluated as stated in EquationEquation (2)
(2)
(2) :
(2)
(2)
where Z represents the appropriateness of under-observation’ sites for sustainable development, and V represents variables. exposes the considered factors and their relative effects and weights.
Table 1. Influencing factors with relative effects and weights.
3.3. Preparation of thematic layers
To assess the appropriate locations for sustainable development of residential building in the study area, eleven thematic layers were developed considering the geo-environmental, geo-physical and socio-economic conditions. In this research, the geo-environmental factors; distance to industry, and vegetation density, etc., Geo-physical variables; slope, elevation, land use, distance from drainage network, water bodies, etc., and socio-economic factors; distance to road network, health services, railway network, population density, etc., were chosen as an influencing factor (Hashemizadeh and Ju Citation2019; Saha and Roy Citation2021; Singh et al. Citation2021; Mallick et al. Citation2022). The specifics are described as follows.
Vegetation Density NDVI: Vegetation indices are quantitative values derived from remotely sensed data that are used to assess plant life on Earth. There are a number of vegetation indicators available for use, the ‘Normalized Difference Vegetation Index (NDVI)’ being the most popular. The primary mathematical basis of a spectral index is a ratio between two spectral bands, typically red and near infrared (NIR). The formula for determining this measurement is defined below:
(3)
(3)
The computation for a specific pixel generally returns a score in range of [−1, +1]. A score of zero implies that there is no vegetation, while a score near to one suggests that there is the greatest density of plant imaginable. The present research used Sentinel datasets and the ‘
’ to estimate the vegetation condition. The significance of this variable comes from the key role of forestry and natural areas in sustainable development. Regarding this variable, preserving ecosystems in order to build the city has been considered.
Distance to industry: In order to avoid the dangers associated with traffic, pollutants and disturbance, residential zones should be built at least a kilometer away from factories. Buffer zones were created around the industries site, and the map was rearranged to reflect the new distance measurements. The rating score grew with distance from the industrial zones, thus places less than 1000 m away were considered unsafe. The Euclidian distance had been computed for all potential sites. In this research, values of distance-based criteria, such as distance to industry, distance from water bodies, proximity to drainage network, distance from road, distance from railway station, farness to health services and population density Euclidean distance were computed using the Euclidean distance concept that compute the length of straight line between two elements that links them. In negative criteria, the first element (close to the considered variable) displays the least desirable distance, while the second element (far from the considered variable) displays the most desirable distance for selecting suitable sites for sustainable residential development. For positive criteria, the scoring is reversed.
Elevation: A site’s elevation may be used as a useful predictor of its suitability since it has an effect on their appropriateness. As a result, residential building development is increasingly taking place in lower-lying locations, which is both safer and more convenient. In contrast, water storage tanks designed to collect rainwater are best suited for locations with low elevation. However, after exploring existing literature review and consulting with the expert team, we now know that the elevation component is essential in determining the slope and aspect when assessing the viability of a site for a sustainable residual building development.
Slope: To calculate the slope, take the distance between two places and divide it by the rise/fall rate. It is a crucial indicator for site selection due to the difficulties of constructing on slopes. Hence, flatter terrain is preferred. Cutting sloping causes ecological harm and slope instability in regions, thus it’s preferable to eliminate sloping areas from possible places for creating residential buildings. Therefore, cuts should be avoided until all necessary measures have been taken to prevent damage and guarantee site safety. Building should not occur on slopes steeper than 30 degrees or in landslide-prone locations. After reclassifying the slope map, points were allotted depending on the angle of the slope. Sites with a slope of more than 30 degrees were declared inappropriate, whereas those with a slope of less than 10 degrees were rated possibly viable.
Land use land cover (LULC): The major reasons for urbanization were changes in population and economic data, as well as changes in LULC. Dense forest, farmland, open fields, city streets, scrubland and water resources all made up the area’s varied land uses. To assign categories to the layers obtained by Sentinel, a maximum likelihood classifier was utilized. Evaluating how well the classification was performed is a crucial step in extracting the results from the picture classification. Classification outcomes may be measured in a variety of ways, including general precision, producer precision, consumer precision and the kappa coefficient. The uncertainty matrix was employed for a quantitative investigation of the LULC categorization rate.
Distance from water bodies: Both suburban and rural residents depend on nearby sources of water. Because water bodies are employed for storing the water from rainfall which can be used at later periods as needed, the region within 250 m should not have settlement to avoid contamination and preserve water bodies safety and security. The bodies of water in the research area are surrounded by a single, 100-m-wide buffer zone.
Distance from drainage network: Given the close proximity to the drainage network, it makes sense to preserve as much of the wadi and drained land as feasible. Wadi and drainage systems are the primary supply of water. It’s crucial to ecosystems in the agricultural, forests and other sectors. Because of this, no structures should be constructed within a 100-m buffer zones, and the area around it should be protected with great care. Drainage network may be extracted using an integration of satellite imagery and a topographic overlay. Buffering evaluation is required for integration with a GIS system. The Euclidean distance was applied to all locations to establish their distance from or direction towards the drainage system.
Distance from road: The constructing locations for sustainable buildings must always be available. The availability of a road is a crucial factor in determining whether a site is suitable since it is necessary to move both completed goods and raw materials. It is expensive to build a new road in steep places. As a consequence, every effort is made to situate the property as near to each and every route that already exists. Additionally, in order to increase connection to the current roads, buffer zone has been built 100 m away from road. The cost of transportation and the inconvenience increase proportionately with the distance from the road and the difficulty of accessing a property. Roadway distribution may be determined using remote sensing data. When interfacing with a GIS system, buffering investigation is crucial. The previously mentioned Euclidean distance was employed to determine the continuous distances far from or towards the roads.
Distance from railway station: The main requirements for setting up new building, whether for residential or commercial uses, are efficient and smooth transportation, as well as greater communication with other locations. The presence of a railroad has a significant effect in this respect. People prefer to settle in areas with greater connection since building new transportation systems is costly. People often build homes or commercial buildings next to these amenities because they are more readily available. The train network has been taken into consideration in this study to determine accessibility across the whole region. Now, buffer zone maps with a 250-m spacing have been considered, and their significance for built-up expansion has been determined by ranking, in order to determine improved accessibility and also to discover the ideal places.
Distance to health services: Because time may have a significant impact, healthcare planners must consider both the quality and accessibility of their facilities. Then, the location of residential structures should take health care into consideration. For medical establishments, a safety zone was created. The constant lengths to or from the health services were calculated using the Euclidean distance as previously shown. The elements indicate which are most and least appropriate for a building site by being either closer to or further away from the health services, respectively.
Population density Euclidean distance: The population density of a place is a quantitative indicator of its human occupants. This value is an average determined by the entire population divided by the total land area. Population density can influence the life quality of residents in buildings that may be broken down into two categories: physical and human. Space for human settlement, relief (the form and height of the ground in a certain location), resources (such as water and food) and climate are all examples of physical issues. Lifestyle preferences, such as whether or not people want to live in close proximity to one another, and economic conditions, such as the proximity of employment, are all examples of human variables. Furthermore, population density is an important variable in our considering decision-making problem. Euclidean distance is computed as defined before.
3.4. Receiver‑operating characteristic (ROC)
Without confirmation, the algorithms will not have any scientific significance since the compatibility analysis used them to anticipate potential urban settlements. The accuracy of a proposed framework is measured using a ROC curve that is a broadly accepted method. Using the technique used by Pontius and Schneider (Citation2001), the exact positive and false-positive rates were computed. A test’s capacity to discriminate is often measured by the area under the ROC curve. The area under curve (AUC) of 1 denotes absolute precision, the AUC of 0.5 denotes unacceptable accuracy, and all the layers are significant at the level of 0.05. The x-axis of a ROC curve represents the false-positive value, whereas the y-axis dedicates the true value. The accomplishment level assessment and the prediction rate evaluation are two crucial elements in the AUC-based model evaluation process. Through the use of a handheld GIS, 230 control points were amassed during fieldwork. The results for the success rate and prediction rates were obtained from a set of control point. Because the control points were used to determine the success and prediction rates, the results showed how well the model matched the actual observation (Terluin et al. Citation2020). These actual observed points were compared with an MIF delineated mapping. It demonstrates the trade-off among two ratios: A true positive (TP) is a pixel which separates when the actual and the model scenario change, while a false positive (FP) is a pixel which is incorrectly identified as non-changeable (Mossman and Somoza Citation1991; Carter et al. Citation2016). The continuity formula was used to compute the aforementioned rates:
(4)
(4)
(5)
(5)
where, TPR is the true-positive rate of prediction,
NPR refers to the rate of FPs,
FPs and false negatives (FNs) indicate the amount of wrongly classified pixels, and
TPs and true negatives (TNs) indicate the total number of properly identified pixels.
3.5. Sensitivity analysis
The final site suitability mapping is greatly influenced by a variety of variables. First, a high level of interconnectedness of elements might raise the likelihood of misadjustment (Wedley et al. Citation2001; Hussaini et al. Citation2022). Additionally, the final output map may be affected by the imposed mistakes or ambiguities of a number of input layers (variables) (Malekmohammadi et al. Citation2012). Concerns about accuracy have also been highlighted by the inevitable subjectivity in the evaluations and weights of the criteria (Carneiro et al. Citation2016; Kumar et al. Citation2022). Sensitivity analysis utilizing the map removal approach is used to solve these problems (Kindie et al. Citation2018). It identifies the map(s) that are most/least important in influencing the values of the output map. It recalculates potential sites using the existing themes after removing one theme at a time; the sensitivity of the deleted theme is then estimated using EquationEquation (6)(6)
(6)
(6)
(6)
where
= Sensitivity measure,
is site selection index,
refers as recalculated site selection index, N and n are the total number of factors employed to compute
and
4. Results and discussion
4.1. Characterization of geospatial variability of the influencing factor
The evaluation of a suitable site for sustainable development of settlements is a crucial element of urban planning. Following is the geo-environmental, geo-physical and socio-economic factors that influence building construction site appropriateness. The integration of these influencing factors determines the degree of suitability and helpful to identify and delineate the unsuitable zones. demonstrates influencing factors with their features, areas, and the number of pixels belongs to each level of suitability. The following are the different thematic layers developed to achieve the objective.
Table 2. Influencing factors with their features and areas.
Elevation: The research area is located at a height between 530 and 1068 m above sea level, with an average of 622.19 m, as shown by . The south-western portion of the study had a greater elevation than the west-east and eastern portions of the map, which had a lower height. Very high topography height (774–1068 m AMSL) predominates in the study area’s western portion, whilst the northern–central and central portions have intermediate topographic elevation (588–631 m AMSL). Since the bulk of the region (530–631 m AMSL) in 64% of the overall research area is at a moderate geographical elevation, it is the best location to choose for the safe erection of residential buildings. For instance, a site at a high height is seen to be appropriate for overhead tanks, but one at a lower level is thought to be suitable for rain-harvesting water tanks. But, as a result of the conversation with the consultant and literature, the elevation factor utilized to compute the aspect and slope to assess the sustainable locating for settlement development in this research.
Slope: In the research region, the slope angle ranges from 0 to 57.91 with an average of 3.924. The slope map shows that the bulk of the region, or more than half of it, has a mild slope of less than 2.7 degrees (). The research area has a high slope in the western and northwestern regions and a low slope in the central and eastern regions. Sites with a slope of less than 2.8 degrees were deemed to be the most ideal, and as the slope grew, desirability declined, with sites having a slope of more than 24.7 degrees being the least appropriate.
Figure 4. Urban settlement site selection factors: a) slope, b) land use, c) roads, d) railways, e) drainage density, f) health services, g) industrial area, h) population density, i) vegetation density and j) water bodies.
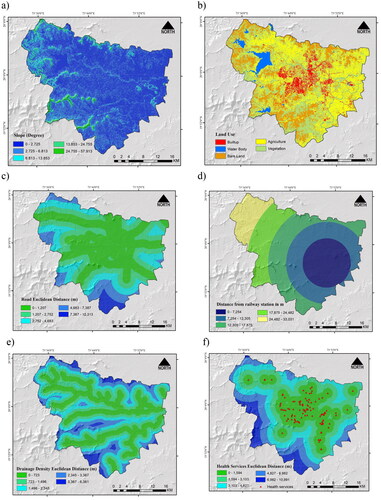
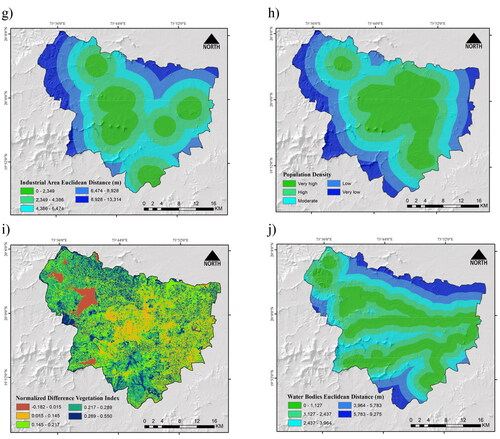
Land use: Using a supervised categorization approach, the LULC map was created. The LULC map for the research region is shown in . According to the findings (), Vegetation Land accounted for 39.56% of the total area and was the major land cover/land use. While just 6.61% of the total area is made up of buildings, barren land takes up 21.25% of the space. The intensity of virgin areas is shown by the high percentage of bare terrain. The scope and character of environmental and societal changes might be to blame for this illness. 28.56% of the total area is made up of farmland for agriculture, which includes cultivated land and horticulture. In addition, just 3.99% of the entire land was taken up by waterbodies. The weights assigned to water bodies, agriculture, and developed areas are all low. While the high weight is allotted to the plants and barren terrain.
Distance from road: Locations closer to main roads (less than 1207 m) were rated as highly acceptable owing to the importance of road network availability in prices, whereas areas farther from the buffers (buffer area identified using Euclidean distance) were rated less favorably (). More than 41% of the area is in the optimal distance from roads classification, while only 3.24% of lands are more than 7387 m from roads. The remaining 45% of the study region is placed in the moderate distance from roads classification, with a distance of between 1297 and 4683 m to the road network.
Distance from railway station: Because it may facilitate transportation and products transformation, proximity to a train station is important. The places closest to the railway network (less than 7254 m) were given the highest ratings, while those farther away (more than 24482 m) were given significantly lower scores (). More than 19.68% of the property is in the best possible location in terms of proximity to the railroad, while 11.91% of the land is placed more than 24,482 m away from the railway network. More over two-thirds of these places landed in the middle tiers (from 7254 to 24,482 m).
Distance from drainage network: In research area, June–September is the months with most of the rainfall. The region is vulnerable to heavy rain during these months, and some areas have experienced flash floods (Dahake Citation2018; Ramkar and Yadav Citation2021). The planned settlement site must be sufficiently far from the drainage network to be safe. Consequently, a building site might not be near a stream. Drainage network regions must thus be considered while developing a settlement site. The first control point, which is close to a drainage network, shows the distance that is least suitable for settlement, whereas the second control point, which is away from the drainage network, shows the distance that is most suitable for choosing a suitable site for settlement ().
Distance to health services: The research area’s health care provider network is shown in . Generally, residential building development sites that are closer to medical facilities are preferred. Based on their distance to health services, areas were classified to five groups (). More than 29.9% of areas placed near to the health service centers (less than 1594 m), that they received highest score in this manner. As the distance to the health care centers rose, the score gradually dropped, with regions with distances more than 6982 m earning the lowest appropriateness ratings that they are furthest areas in the study region (from 6982 to 10,991 m).
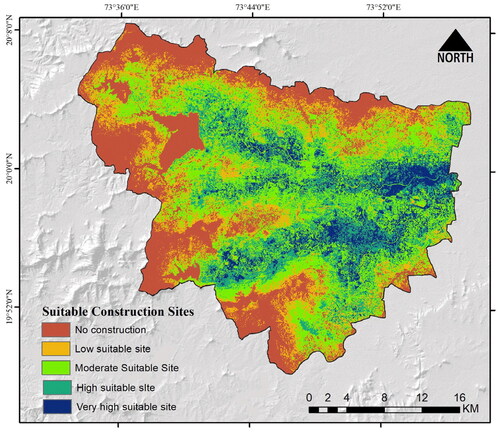
Figure 5. Suitable building construction zones for sustainable urban development in the study area.
Distance to industry: Distance to industrial zones could influence to select optimal places for building development since they make noise, pollution and other inappropriateness. While all areas are categorized to five classes regarding to distance from industrial zones, the nearest group placed less than 2349 m and furthest one placed at 8928 m to 13,314 m far from these areas (). There are 20.74% of areas in the first group, the nearest one, while 27.42% of lands belongs to the second group. This group is the biggest one in this variable. There is only 10.10% of areas in the last group that are furthest sites from the industry. More value assigned to the regions with more distance from industry based on the calculated Euclidian distance.
Population density Euclidean distance: Based on the Euclidean distance of population density, study region classified to five groups (). Each group with more distance received more score based on the concept of this variable. The least suitable group that is nearest areas to population density had less than 1434 m. The majority of the study area belongs to this class with more than 26.74%. The distribution of the population density Euclidean distance demonstrates site selection for sustainable building development is challenging because the most appropriate areas with the most distance (from 7891 to 13,066 m) constitutes only 11.67% of the study region.
Vegetation density NDVI: The preservation of ecosystems and natural resources is crucial when achieving sustainable development is our main goal. When choosing a new suitable location for residential building development, the future urban residential area should not influence on the ecology, particularly in environmentally sensitive locations. The vegetation was mostly found in the western and wetter portions of the research area, which correlate to the region’s steep terrain and abundant wildlife. Therefore, it is necessary to safeguard these places from urban growth. Following the reclassification of the NDVI map, ratings were determined based on the NDVI value. Sites with a high NDVI score (more than 0.289) were seen to be possibly appropriate, and as the NDVI score dropped (to less than 0.015), the suitability reduced ().
Distance from water bodies: Bodies of water are essential to civilizations. To avoid contamination, land should not be constructed within 500 m of them. The first control point, which is close to surface water, shows the least ideal location for a residence structure, while the second control point, which is away from waterbodies, shows the best location for choosing a secure site for sustainable building construction. More than 31% of the region is in the nearest group to the water bodies while only 7.46% of areas belongs to the furthest areas of the water bodies that are placed at northern, southern, west-northern and east northern areas of the study region ().
The MIF approach was used to determine the weights for each class. The influencing factors weights with normalized weights for each class are shown in . The most importance has been placed on the distances from the railroad station, the drainage system and industries because of their crucial roles in meeting the needs of both construction projects and occupants. As a consequence, this grading aligned with the principles of sustainable development to prevent environmental harm, enhance living quality and take economic considerations into account. Elevation, Slope, Distance from Road and Population Density are listed after that. The results of expert consultations and reviews of the literature (Saha and Roy Citation2021; Mallick et al. Citation2022) indicate that the assigned weights are appropriate for the anticipated results. Due to difference influence of each variable, is it necessary to clarify their impact on the site selection. classifies each variable in a suitability scale from very low to very high to demonstrate how variables affect the final evaluation for sustainable construction development. There are five distinct zones on the map of urban settlement viability: no construction, low-, moderate-, high-, and very high suitability.
Table 3. Influencing variables weights with normalized weights for each class.
4.2. Sustainable site selection mapping of study area
Multiple factors, such as economics, ecology and topography, are taken into account while deciding on a place for a sustainable residential development. There is a solution to this difficult decision-making challenge, and that is a GIS. The geographical distribution of all the results from the various criteria for sustainable site identification for residential structure development is shown in . According to the study’s findings, weighted overlay assessment is the most effective way for employing GIS-based MIF to map possible safe site building. Eleven indicators, such as Elevation, Slope, Land use land cover Distance from road, Distance from railway network, Distance from drainage network, Distance to health services, proximity to industry, population density Euclidean distance, Vegetation Density (NDVI) and Distance from water bodies (m) theme layers, use fuzzy set theory to categorize the research region into a number of safe site selection residential building construction zones. Safe site selection classification map () obtained statistically for examination based on the sustainable site selection index (SSSI).
Minimum and highest scores for the site’s potential index were 0.004 and 0.317, respectively, with a mean value of 0.236. Statistics on site suitability using the MIF approach are divided into different zones based on their suitability. Appropriate locations were found and classified into five categories: no construction, low, moderate, high and extremely high appropriate location. displays data on consolidated safe site categories for settlement locations. Based on the data analysis, 8.77% and 16.48% of the entire area were classified as very high and high appropriate sites, respectively, while 27.26% and 16.82% were attributed to low suitable potential and no construction. In the center, central-east, east and central-west regions of the research area, there is a significant and extremely high spatial variation of safe site appropriate residential building construction zones.
Table 4. Site suitability statistics using MIF technique.
4.3. Sensitivity analysis
All parametric methods are significantly impacted by the subjectivity of the weights chosen for the parameters (Saltelli Citation1999; Oke Citation2020). The results of a sensitivity analysis may be used to assess the importance of subjective factors and the impact of varying parameter weights (Kindie et al. Citation2018). displays the outcome of a sensitivity analysis that was calculated by omitting each theme layer in turn. Reduced distance from the road resulted in a higher variance index (mean variation index = 0.1875) and distance to health services (0.1873), implying that distance from road and health services are the most sensitive variables followed by distance from drainage network (0.1865), industry (0.1869) and railway station (0.1857). Vegetation density (0.1855), population density (0.1848) and elevation (0.1844) are moderately sensitive whereas slope (0.1838), LULC (0.1837) and distance from water bodies (0.1816) are least sensitive parameters. The standard deviation of the variation index is ranging from 0.0478 to 0.0523 and mean varies from 0.1816 to 0.1875 shows all the considered factors are sensitive for delineating the optimal site for sustainable residential development in the study area. In future studies, these factors should be considered and evaluated with good accuracy in the study region.
Table 5. Summary of sensitivity analysis with variation index.
5. Discussion
Urbanization, a global phenomenon driven by population concentration, has led to the expansion of cities into new territories. As urban populations continue to grow, there is a pressing need for innovative urban development encompassing residential, commercial, service and public spaces. One of the paramount challenges in urban planning is the identification of suitable locations (Mukhopadhaya Citation2016). Site suitability analysis, a crucial component of urban planning, integrates both spatial and non-spatial data to address this challenge (Al-shalabi et al. Citation2006). GISs play a pivotal role in this analysis, utilizing specific parameters tailored to the intended purpose (Vanegas et al. Citation2010). In this context, Remote Sensing, GIS, GPS and the Analytical Hierarchy Process (AHP) method serve as indispensable tools for site identification, comparative analysis and informed decision-making (Rane and Jayaraj Citation2021). Within the realm of land suitability analysis, GIS-Multi-Criteria Decision Analysis (MCDA) emerges as a valuable approach (Rane and Jayaraj Citation2021). Notably, various MCDA methods, such as ELECTRE, TOPSIS, PROMETHEE and AHP, offer comprehensive frameworks for evaluating and selecting suitable urban development sites (Villacreses et al. Citation2017). GIS are powerful spatial visualization and analysis tools that can be used to make accurate and efficient use of data (Kiefer and Robbins Citation1974; Villacreses et al. Citation2017; Rane and Jayaraj Citation2021). GIS based techniques applications are economical as it lends itself to relatively simple and practical applications instead of expensive field surveys, also helping to narrow down the potential areas for further investigation (Tabari et al. Citation2008; Khan et al. Citation2021; Rane and Jayaraj Citation2022b). GIS has the ability to consider different aspects of an issue, including socio, cultural, economic and environmental factors, when making decisions (Murray Citation2001; Thapa and Murayama Citation2010; Villacreses et al. Citation2017). In the study focused on the urban suitable sites location in the city, it’s a most important for maintain the ecosystem and sustainable development entire in the study as compared to other studies, so different and novel results found in the study. Combining the thematic layers, MIF and GIS methods have been used to suitable sites locations in the urban settlements. The results can be helpful to city development plan and sustainable development goal.
5.1. Validation of the delineated suitable sites
The final appropriate map had been validated by developing the ROC model. The ROC analysis shows the predicted site suitability accuracy level. The match between the FP rate and true positive rate which are computed using EquationEquations (4)(4)
(4) and Equation(5)
(5)
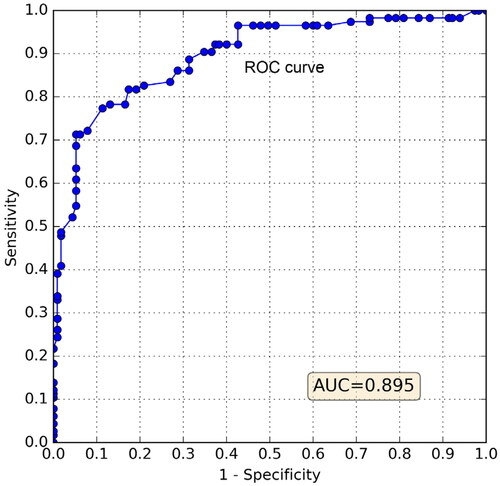
(5) is shown in . In this case, the AUC was 0.895. Therefore, predictions were reasonably good. Based on the validation, 78.24 sq.km (8.77%) and 146.95 sq.km (16.48%) of the study area were classified as very high and high appropriate sites, respectively, while 242.99 sq.km (27.26%) and 149.95 sq.km (16.82%) were found low suitable potential and no construction. Moreover, 273.22 (30.65%) of the area is moderately appropriate for building construction. In the center, central-east, east and central-west part of the study region, there is a significant and extremely high spatial variation for the sustainable residential development in the study area. Overall, the confirmation outcomes show that the GIS-based MIF model performed well for delineating the optimal site for sustainable residential development.
Figure 6. Receiver-operating characteristic (ROC) curve of the suitable sites.
6. Conclusions
Geo-environmental, geophysical and socio-economic factors have a significant impact on the decision-making process for selecting an urban settlement. The combined effect of these criteria assesses appropriateness and aids in classifying the areas into several suitable/unsuitable zones. Evaluation of a range of parameters with varying weights or percentage influences is required as part of the site selection process for sustainable settlement development. A framework for assessing an interrelation for a sustainable settlement site selection must be employed to make sure that important site selection interrelations are not neglected. In this research, the interrelationship among the crucial influencing elements was used to evaluate the applicability of MIF and GIS approaches in site suitability delineation for sustainable settlement development. The interrelationships between the factors in MIF approaches were used to produce a commensurate weight for the 11 essential influencing factors that were taken into consideration. In the research area, vegetation and agricultural land are the two dominant types of land used. A suitability map was obtained using MIF based weights with weighted overlay analysis. The suitability map was categorized into zones with no construction, low, moderate, high and very high suitability. About 27.26% (242.99 km2) of the land was not suitable, 16.82% (149.95 km2) low suitability, 30.65% (273.223 km2) moderate suitability, 16.48% (146.95 km2) high suitability and 8.77% (78.24 km2) was very highly suitable for sustainable urban development.
To understand how each parameter dominates the settlement delineation, the sensitivity analysis was performed. Sensitivity analysis is conducted using the thematic layer removal technique. Sensitivity analysis revealed that the distance from road, drainage network and health services are the dominant for selecting the optimal location of the residential development in the study area. A spatial map indicates that most of the delineated zones located near the habitant area, and major roads. The findings indicate that unsuitable areas for residential development are located in the vegetation (forest), water bodies and agriculture areas. Plans for future land use should prioritize utilizing both highly and moderately suitable zones. The findings highlight the weighted overlay approach with the MIF technique as the effective tool to map sustainable settlement development. The demarcated suitability zones can be used as a fundamental baseline for selecting optimal sites for future settlement development.
Using the ROC curve, the proposed suitability map’s accuracy and feasibility were evaluated. The validation using ROC curve showed a satisfactory AUC value of 0.895. Urban development was most suitable in the central eastern and middle regions, while it was less suitable in the north, south and west regions. The MIF approach with GIS offers precise and potent studies of site suitability. City planners can effectively apply suitability mapping to identify optimal urban settlement and take the suitable decision. Urban planners and other specialists can use the findings to create suitable sustainable development plans. For the development of sustainable urban policies, future research should take urban disaster resilience and catastrophe risk reduction into consideration. Future population growth, water usage and consumption, risk management and vulnerability levels should all factor into urban policy planning. Future studies can examine further cutting-edge artificial intelligence techniques for selecting sustainable sites, including artificial neural networks, fuzzy-topsis and others. To better comprehend sustainable site appropriateness, other variables, such as groundwater level and power, should be integrated as decision-making variables when evaluating the optimum site location to construct settlement properties.
Compliance with ethical standards
Disclosure of potential conflicts of interest.
Authors’ contributions
Conceptualization and supervision: NLR, AA and AH; writing draft, writing review and editing: NLR, CBP, AH, AA and SP; writing review and editing data curation and formal analysis: CBP, SP, NT, MA, KKY, MK, ADT and MG; evidence collection, review, and editing: NLR, AA, CBP, and MG.
Acknowledgements
The authors express their gratitude to Princess Nourah bint Abdulrahman University Researchers Supporting Project (Grant No. PNURSP2023R12), Princess Nourah bint Abdulrahman University, Riyadh, Saudi Arabia. The authors extend their appreciation to the Deanship of Scientific Research at King Khalid University (KKU) for funding this research through the Research Group Program Under the Grant Number:(R.G.P.2/453/44).
Disclosure statement
The authors have no conflicts of interest to declare.
Data availability statement
The data that support the findings of this study are available on request from the corresponding author.
Additional information
Funding
References
- Abdel-Malak FF, Issa UH, Miky YH, Osman EA. 2017. Applying decision-making techniques to civil engineering projects. Beni-Suef Univ J Basic Appl Sci. 6(4):326–331. doi: 10.1016/j.bjbas.2017.05.004.
- Ali T, Aghaloo K, Chiu YR, Ahmad M. 2022. Lessons learned from the COVID-19 pandemic in planning the future energy systems of developing countries using an integrated MCDM approach in the off-grid areas of Bangladesh. Renew Energy. 189:25–38. doi: 10.1016/j.renene.2022.02.099.
- Al-Shalabi MA, Mansor SB, Ahmed NB, Shiriff R. 2006. GIS based multicriteria approaches to housing site suitability assessment. In Proceedings, XXIII FIG Congress. Shaping the Change; October 8–13; Munich, Germany. p. 1–17.
- Alwan Z, Jones P, Holgate P. 2017. Strategic sustainable development in the UK construction industry, through the framework for strategic sustainable development, using Building Information Modelling. J Cleaner Prod. 140:349–358. doi: 10.1016/j.jclepro.2015.12.085.
- Bait S, Lauria SM, Schiraldi MM. 2022. A risk-based hybrid multi-criteria approach to support managers in the industrial location selection in developing countries: a case study of textile sector in Africa. J Cleaner Prod. 335:130325. doi: 10.1016/j.jclepro.2021.130325.
- Barredo JI, Demicheli L. 2003. Urban sustainability in developing countries’ megacities: modelling and predicting future urban growth in Lagos. Cities. 20(5):297–310 doi: 10.1016/S0264-2751(03)00047-7.
- Bera K, Newcomer ME, Banik P. 2022. Groundwater recharge site suitability analysis through multi-influencing factors (MIF) in West Bengal dry-land areas, West Bengal, India. Acta Geochim. 41(6):1030–1048. doi: 10.1007/s11631-022-00559-6.
- Bhagat RB, Mohanty S. 2009. Emerging pattern of urbanization and the contribution of migration in urban growth in India. Asian Popul Stud. 5(1):5–20. doi: 10.1080/17441730902790024.
- Bhattacharya RK, Chatterjee ND, Das K. 2020. Sub-basin prioritization for assessment of soil erosion susceptibility in Kangsabati, a plateau basin: a comparison between MCDM and SWAT models. Sci Total Environ. 734:139474. doi: 10.1016/j.scitotenv.2020.139474.
- Bianchini L, Egidi G, Alhuseen A, Sateriano A, Cividino S, Clemente M, Imbrenda V. 2021. Toward a dualistic growth? Population increase and land-use change in Rome, Italy Land. Land. 10(7):749. doi: 10.3390/land10070749.
- Brockerhoff M. 1999. Urban growth in developing countries: a review of projections and predictions. Popul Dev Rev. 25(4):757–778. doi: 10.1111/j.1728-4457.1999.00757.x.
- Butera FM. 2010. Climatic change and the built environment. Advances in building energy research. Vol. 4. Abingdon: Routledge; p. 45–75. doi: 10.3763/aber.2009.0403.
- Bulti DT, Assefa T. 2019. Analyzing ecological footprint of residential building construction in Adama City, Ethiopia. Environ Syst Res. 8(1):1–5. doi: 10.1186/s40068-019-0130-8.
- Caprioli C, Bottero M. 2021. Addressing complex challenges in transformations and planning: a fuzzy spatial multicriteria analysis for identifying suitable locations for urban infrastructures. Land Use Policy. 102:105147. doi: 10.1016/j.landusepol.2020.105147.
- Carneiro J, Martinho D, Marreiros G, Novais P. 2016. Intelligent negotiation model for ubiquitous group decision scenarios. Front Inf Technol Electronic Eng. 17(4):296–308. doi: 10.1631/FITEE.1500344.
- Carter JV, Pan J, Rai SN, Galandiuk S. 2016. ROC-ing along: evaluation and interpretation of receiver operating characteristic curves. Surgery. 159(6):1638–1645. doi: 10.1016/j.surg.2015.12.029.
- Census. 2011. Census of India 2011, district census handbook, Nashik, directorate of census operation Maharashtra. https://censusindia.gov.in/nada/index.php/catalog/814.
- CGWB. 2014. Ground water information Nashik district Maharashtra, Govt of India, Ministry of water resources, central ground water board. [assessed on 20 December 2022]. http://cgwb.gov.in/district_profile/maharashtra/nashik.pdf
- Chadchan J, Shankar R. 2012. An analysis of urban growth trends in the post-economic reforms period in India. Int J Sustain Built Environ. 1(1):36–49. doi: 10.1016/j.ijsbe.2012.05.001.
- Chakraborty S, Dadashpoor H, Novotný J, Maity I, Follmann A, Patel PP, Roy U, Pramanik S. 2022. In pursuit of sustainability–Spatio-temporal pathways of urban growth patterns in the world’s largest megacities. Cities. 131:103919. doi: 10.1016/j.cities.2022.103919.
- Chang NB, Hossain U, Valencia A, Qiu J, Kapucu N. 2020. The role of food-energy-water nexus analyses in urban growth models for urban sustainability: a review of synergistic framework. Sustain Cities Soc. 63:102486. doi: 10.1016/j.scs.2020.102486.
- Cheng EW, Li H, Yu L. 2007. A GIS approach to shopping mall location selection. Build Environ. 42(2):884–892. doi: 10.1016/j.buildenv.2005.10.010.
- Chen VY, Lien HP, Liu CH, Liou JJ, Tzeng GH, Yang LS. 2011. Fuzzy MCDM approach for selecting the best environment-watershed plan. Appl Soft Comput. 11(1):265–275. doi: 10.1016/j.asoc.2009.11.017.
- Dahake S. 2018. Taming Godavari River: navigating through religious, developmental, and environmental narratives. Wiley Interdiscip Rev Water. 5(5):e1297. doi: 10.1002/wat2.1297.
- Dai FC, Lee CF, Zhang XH. 2001. GIS-based geo-environmental evaluation for urban land-use planning: a case study. Eng Geol. 61(4):257–271. doi: 10.1016/S0013-7952(01)00028-X.
- Doan DT, Ghaffarianhoseini A, Naismith N, Zhang T, Ghaffarianhoseini A, Tookey J. 2017. A critical comparison of green building rating systems. Build Environ. 123:243–260. doi: 10.1016/j.buildenv.2017.07.007.
- Dong J, Zhuang D, Xu X, Ying L. 2008. Integrated evaluation of urban development suitability based on remote sensing and GIS techniques–a case study in Jingjinji Area, China. Sensors (Basel). 8(9):5975–5986. doi: 10.3390/s8095975.
- Draper J, Dawson M, Casey E. 2011. An exploratory study of the importance of sustainable practices in the meeting and convention site selection process. J Convent Event Tourism. 12(3):153–178. doi: 10.1080/15470148.2011.598353.
- Emovon I, Oghenenyerovwho OS. 2020. Application of MCDM method in material selection for optimal design: a review. Results Mater. 7:100115. doi: 10.1016/j.rinma.2020.100115.
- Erbaş M, Kabak M, Özceylan E, Çetinkaya C. 2018. Optimal siting of electric vehicle charging stations: a GIS-based fuzzy multi-criteria decision analysis. Energy. 163:1017–1031. doi: 10.1016/j.energy.2018.08.140.
- Escamilla EZ, Habert G, Wohlmuth E. 2016. When CO2 counts: sustainability assessment of industrialized bamboo as an alternative for social housing programs in the Philippines. Build Environ. 103:44–53. doi: 10.1016/j.buildenv.2016.04.003.
- Gadakh B, Jaybhaye R, Nalawade P. 2015. An assessment of tourism potential: a case sof Nashik City Maharashtra. Int J Res Geogr. 1(1):8–12.
- Ghobarah A. 1987. Civil engineers’ role in site-selection studies. J Prof Issues in Eng. 113(4):351–359. doi: 10.1061/(ASCE)1052-3928(1987)113:4(351).
- Gou Z, Xie X. 2017. Evolving green building: triple bottom line or regenerative design? J Cleaner Prod. 153:600–607. doi: 10.1016/j.jclepro.2016.02.077.
- Hashemizadeh A, Ju Y. 2019. Project portfolio selection for construction contractors by MCDM–GIS approach. Int J Environ Sci Technol. 16(12):8283–8296 doi: 10.1007/s13762-019-02248-z.
- Ho KH, Rengarajan S, Lum YH. 2013. “Green” buildings and Real Estate Investment Trust’s (REIT) performance. J Property Invest Fin. 31(6):545–574. doi: 10.1108/JPIF-03-2013-0019.
- Hwang BG, Zhu L, Tan JS. 2017. Green business park project management: barriers and solutions for sustainable development. J Cleaner Prod. 153:209–219. doi: 10.1016/j.jclepro.2017.03.210.
- Hussaini MS, Farahmand A, Shrestha S, Neupane S, Abrunhosa M. 2022. Site selection for managed aquifer recharge in the city of Kabul, Afghanistan, using a multi-criteria decision analysis and geographic information system. Hydrogeol J. 30(1):59–78. doi: 10.1007/s10040-021-02408-x.
- James H. 2019. Population, development, and the environment: challenges to achieving the sustainable development goals in the Asia Pacific. London: Palgrave Macmillan.
- Jahangiri M, Shamsabadi AA, Mostafaeipour A, Rezaei M, Yousefi Y, Pomares LM. 2020. Using fuzzy MCDM technique to find the best location in Qatar for exploiting wind and solar energy to generate hydrogen and electricity. Int J Hydrogen Energy. 45(27):13862–13875. doi: 10.1016/j.ijhydene.2020.03.101.
- Jarah SH, Zhou B, Abdullah RJ, Lu Y, Yu W. 2019. Urbanization and urban sprawl issues in city structure: a case of the Sulaymaniah Iraqi Kurdistan Region. Sustainability. 11(2):485. doi: 10.3390/su11020485.
- Kahn AM. 1995. Sustainable development: The key concepts, issues and implications. Keynote paper given at the Proceedings of the 1995 International Sustainable Development Research Conference, 27–29 march; Manchester, England; p. 63–69. John Wiley & Sons, Ltd.
- Khan U, Faheem H, Jiang Z, Wajid M, Younas M, Zhang B. 2021. Integrating a GIS-based multi-influence factors model with hydro-geophysical exploration for groundwater potential and hydrogeological assessment: a case study in the Karak Watershed, Northern Pakistan. Water. 13(9):1255. doi: 10.3390/w13091255.
- Kiefer RW, Robbins ML. 1974. Computer-based land use suitability maps. Int J Rock Mech Min Sci Geomech Abstr. 11(8):A179. doi: 10.1016/0148-9062(74)91978-0.
- Kindie AT, Enku T, Moges MA, Geremew BS, Atinkut HB. 2018. Spatial analysis of groundwater potential using GIS based multi criteria decision analysis method in Lake Tana Basin, Ethiopia. International conference on advances of science and technology. Cham, Switzerland: Springer; p. 439–456.
- Kumar M, Shaikh VR. 2013. Site suitability analysis for urban development using GIS based multicriteria evaluation technique. J Indian Soc Remote Sens. 41(2):417–424. doi: 10.1007/s12524-012-0221-8.
- Kumar M. 2021. Evaluation of experimental research on black cotton soil stabilization using stone powder. Mater Today Proc. 37:3490–3493. doi: 10.1016/j.matpr.2020.09.389.
- Kumar P, Sharma R, Bhaumik S. 2022. MCDA techniques used in optimization of weights and ratings of DRASTIC model for groundwater vulnerability assessment. Data Sci Manag. 5(1):28–41. doi: 10.1016/j.dsm.2022.03.004.
- Kulkarni PP, Pardeshi SD. 2019. Evaluation and interpolation of rainfall trends over the semi-arid upper Godavari basin. Meteorol Atmos Phys. 131(5):1565–1576. doi: 10.1007/s00703-018-0652-z.
- Kuta AA, Opaluwa YD, Zitta N, Ojatah E, Ugolo EM. 2016. Application of GIS sieve mapping and overlay techniques for building site suitability analysis in part of FUT, Gidan Kwano, Minna, Nigeria. Indian J Sci Technol. 9(46):1–6.
- Lehmann S. 2008. Sustainability on the urban scale: green urbanism–New models for urban growth and neighbourhoods. Urban energy transition. Amsterdam, Netherlands: Elsevier; p. 409–430.
- Lima L, Trindade E, Alencar L, Alencar M, Silva L. 2021. Sustainability in the construction industry: a systematic review of the literature. J Cleaner Prod. 289:125730. doi: 10.1016/j.jclepro.2020.125730.
- Liu Y, Luo T, Liu Z, Kong X, Li J, Tan R. 2015. A comparative analysis of urban and rural construction land use change and driving forces: implications for urban–rural coordination development in Wuhan, Central China. Habitat Int. 47:113–125. doi: 10.1016/j.habitatint.2015.01.012.
- Mallick J, Ibnatiq AA, Kahla NB, Alqadhi S, Singh VP, Hoa PV, Hang HT, Hong NV, Le HA. 2022. GIS-based decision support system for safe and sustainable building construction site in a mountainous region. Sustainability. 14(2):888. doi: 10.3390/su14020888.
- Mallick SK, Rudra S, Maity B. 2022. Land suitability assessment for urban built-up development of a city in the Eastern Himalayan foothills: a study towards urban sustainability. Environ Dev Sustain. doi: 10.1007/s10668-022-02857-8.
- Malczewski J. 2004. GIS-based land-use suitability analysis: a critical overview. Prog Plann. 62(1):3–65. doi: 10.1016/j.progress.2003.09.002.
- Malekmohammadi B, Ramezani Mehrian M, Jafari HR. 2012. Site selection for managed aquifer recharge using fuzzy rules: integrating geographical information system (GIS) tools and multi-criteria decision making. Hydrogeol J. 20(7):1393–1405. doi: 10.1007/s10040-012-0869-8.
- Mandal P, Saha J, Bhattacharya S, Paul S. 2021. Delineation of groundwater potential zones using the integration of geospatial and MIF techniques: a case study on Rarh region of West Bengal, India. Environ Challenge. 5:100396. doi: 10.1016/j.envc.2021.100396.
- Marull J, Pino J, Mallarach JM, Cordobilla MJ. 2007. A land suitability index for strategic environmental assessment in metropolitan areas. Landscape Urban Plann. 81(3):200–212. doi: 10.1016/j.landurbplan.2006.11.005.
- Montgomery B, Dragićević S. 2016. Comparison of GIS‐based logic scoring of preference and multicriteria evaluation methods: urban land use suitability. Geog Anal. 48(4):427–447. doi: 10.1111/gean.12103.
- Mossman D, Somoza E. 1991. ROC curves, test accuracy, and the description of diagnostic tests. J Neuropsychiatry Clin Neurosci. 3(3):330–333.
- Mugiyo H, Chimonyo VG, Sibanda M, Kunz R, Masemola CR, Modi AT, Mabhaudhi T. 2021. Evaluation of land suitability methods with reference to neglected and underutilised crop species: a scoping review. Land. 10(2):125. doi: 10.3390/land10020125.
- Murray AT. 2001. Strategic analysis of public transport coverage. Socio-Econ Plann Sci. 35(3):175–188. doi: 10.1016/S0038-0121(01)00004-0.
- Mukhopadhaya S. 2016. GIS-based site suitability analysis case study for professional college in Dehradun. J Civil Eng Environ Technol. 3(1):60–64.
- Nassereddine M, Eskandari H. 2017. An integrated MCDM approach to evaluate public transportation systems in Tehran. Transport Res A Policy Pract. 106:427–439. doi: 10.1016/j.tra.2017.10.013.
- Nega W, Hunie Y, Tenaw M, Dires T, Kassaw S, Mansberger R. 2022. Demand-driven suitable sites for public toilets: a case study for GIS-Based site selection in Debre Markos Town, Ethiopia. GeoJournal. 87(3):2181–2194. doi: 10.1007/s10708-020-10360-8.
- Nzotcha U, Kenfack J, Manjia MB. 2019. Integrated multi-criteria decision making methodology for pumped hydro-energy storage plant site selection from a sustainable development perspective with an application. Renew Sustain Energy Rev. 112:930–947. doi: 10.1016/j.rser.2019.06.035.
- Oke SA. 2020. Regional aquifer vulnerability and pollution sensitivity analysis of drastic application to Dahomey Basin of Nigeria. Int J Environ Res Public Health. 17(7):2609. doi: 10.3390/ijerph17072609.
- Pande CB, Moharir KN, Singh SK, Varade AM, Ahmed Elbeltagie SFR, Khadri PC. 2021. Estimation of crop and forest biomass resources in a semi-arid region using satellite data and GIS. J Saudi Soc Agric Sci. 20(5):302–311.
- Pande CB, Moharir KN, Varade AM, Abdo HG, Mulla S, Yaseen ZM. 2023. Intertwined impacts of urbanization and land cover change on urban climate and agriculture in Aurangabad city (MS), India using google earth engine platform. J. Clean. Prod. 422:138541. doi: 10.1016/j.jclepro.2023.138541.
- Pawe CK, Saikia A. 2020. Decumbent development: urban sprawl in the Guwahati Metropolitan Area, India. Singap J Trop Geogr. 41(2):226–247. doi: 10.1111/sjtg.12317.
- Pontius RG, Schneider LC. 2001. Land-cover change model validation by an ROC method for the Ipswich watershed, Massachusetts, USA. Agric Ecosyst Environ. 85(1–3):239–248. doi: 10.1016/S0167-8809(01)00187-6.
- Poon ST. 2021. Reviewing whole building design sustainability challenges: perspectives on net zero energy and rainwater harvesting. Resilient and responsible smart cities. Cham, Switzerland: Springer; p. 209–218.
- Potbhare V, Syal M, Korkmaz S. 2009. Adoption of green building guidelines in developing countries based on US and India experiences. J Green Build. 4(2):158–174. doi: 10.3992/jgb.4.2.158.
- Poyil RP, Misra AK. 2015. Urban agglomeration impact analysis using remote sensing and GIS techniques in Malegaon city, India. Int J Sustain Built Environ. 4(1):136–144. doi: 10.1016/j.ijsbe.2015.02.006.
- Qiu D, Zhang J. 2011. Urban residential land suitability index system and its comprehensive evaluation—a case study of Wenzhou. Procedia Eng. 21:439–445. doi: 10.1016/j.proeng.2011.11.2036.
- Rajasekhar M, Raju GS, Raju RS, Basha UI. 2018. Data on artificial recharge sites identified by geospatial tools in semi-arid region of Anantapur District, Andhra Pradesh, India. Data Brief. 19:462–474. doi: 10.1016/j.dib.2018.04.050.
- Ramkar P, Yadav SM. 2021. Flood risk index in data-scarce river basins using the AHP and GIS approach. Nat Hazards. 109(1):1119–1140. doi: 10.1007/s11069-021-04871-x.
- Rane N, Jayaraj GK. 2021. Stratigraphic modeling and hydraulic characterization of a typical basaltic aquifer system in the Kadva river basin, Nashik, India. Model Earth Syst Environ. 7(1):293–306. doi: 10.1007/s40808-020-01008-0.
- Rane NL, Jayaraj GK. 2022a. Comparison of multi-influence factor, weight of evidence and frequency ratio techniques to evaluate groundwater potential zones of basaltic aquifer systems. Environ Dev Sustain. 24(2):2315–2344. doi: 10.1007/s10668-021-01535-5.
- Rane NL, Jayaraj GK. 2022b. Enhancing SWAT model predictivity using multi-objective calibration: effects of integrating remotely sensed evapotranspiration and leaf area index. Int J Environ Sci Technol. 20(6):6449–6468. doi: 10.1007/s13762-022-04293-7.
- Rao Y, Dai J, Dai D, He Q, Wang H. 2021. Effect of compactness of urban growth on regional landscape ecological security. Land. 10(8):848. doi: 10.3390/land10080848.
- Rane NL, Achari A, Choudhary SP, Mallick SK, Pande CB, Srivastava A, Moharir KN. 2023. A decision framework for potential dam site selection using GIS, MIF and TOPSIS in Ulhas river basin, India. J Clean Prod. 15(423):138890.
- Raut RD, Kamble SS, Jha MK. 2016. An assessment of sustainable house using FST-QFD-AHP multi-criteria decision-making approach. Int J Procurement Manag. 9(1):86–122. doi: 10.1504/IJPM.2016.073390.
- Robson BT. 2006. Urban growth: an approach. Abingdon: Routledge.
- Rolnick D, Donti PL, Kaack LH, Kochanski K, Lacoste A, Sankaran K, Ross AS, Milojevic-Dupont N, Jaques N, Waldman-Brown A, et al. 2023. Tackling climate change with machine learning. ACM Comput Surv. 55(2):1–96. doi: 10.1145/3485128.
- Saaty TL. 1980. The analytic hierarchy process (AHP). J Oper Res Soc. 41(11):1073–1076.
- Saha A, Roy R. 2021. An integrated approach to identify suitable areas for built-up development using GIS-based multi-criteria analysis and AHP in Siliguri planning area, India. SN Appl Sci. 3(4):395. doi: 10.1007/s42452-021-04354-5.
- Sarkar P, Kumar P, Vishwakarma DK, Ashok A, Elbeltagi A, Gupta S, Kuriqi A. 2022. Watershed prioritization using morphometric analysis by MCDM approaches. Ecol Inf. 70:101763. doi: 10.1016/j.ecoinf.2022.101763.
- Sharma M. 2018. Development of a ‘Green building sustainability model’ for Green buildings in India. J Cleaner Prod. 190:538–551. doi: 10.1016/j.jclepro.2018.04.154.
- Saltelli A. 1999. Sensitivity analysis: could better methods be used? J Geophys Res. 104(D3):3789–3793. doi: 10.1029/1998JD100042.
- Siksnelyte-Butkiene I, Zavadskas EK, Streimikiene D. 2020. Multi-criteria decision-making (MCDM) for the assessment of renewable energy technologies in a household: a review. Energies. 13(5):1164. doi: 10.3390/en13051164.
- Singh KN. 1978. Urban development in India. Ajmer, Rajasthan: Abhinav Publications.
- Singh L, Saravanan S, Jennifer JJ, Abijith D. 2021. Application of multi-influence factor (MIF) technique for the identification of suitable sites for urban settlement in Tiruchirappalli City, Tamil Nadu, India. Asia-Pac J Reg Sci. 5(3):797–823. doi: 10.1007/s41685-021-00194-8.
- Singh RP, Raghubanshi AS. 2020. ‘Green building’movement in India: study on institutional support and regulatory support. Urban ecology. Amsterdam, Netherlands: Elsevier; p. 435–455.
- Sotoudeh-Anvari A. 2022. The applications of MCDM methods in COVID-19 pandemic: a state of the art review. Appl Soft Comput. 126:109238. doi: 10.1016/j.asoc.2022.109238.
- Tabari M, Kaboli A, Aryanezhad MB, Shahanaghi K, Siadat A. 2008. A new method for location selection: a hybrid analysis. Appl Math Comput. 206(2):598–606. doi: 10.1016/j.amc.2008.05.111.
- TERI. 2006. In pursuit of sustainable development: mainstreaming environment in the construction sector. Delhi sustainable development summit, India habitat Center, Lodhi Road. New Delhi, India: The Energy and Resources Institute.
- Terluin B, Griffiths P, van der Wouden JC, Ingelsrud LH, Terwee CB. 2020. Unlike ROC analysis, a new IRT method identified clinical thresholds unbiased by disease prevalence. J Clin Epidemiol. 124:118–125. doi: 10.1016/j.jclinepi.2020.05.008.
- Thapa RB, Murayama Y. 2010. Drivers of urban growth in the Kathmandu valley, Nepal: examining the efficacy of the analytic hierarchy process. Appl Geogr. 30(1):70–83. doi: 10.1016/j.apgeog.2009.10.002.
- Tripathi AK, Agrawal S, Gupta RD. 2022. Comparison of GIS-based AHP and fuzzy AHP methods for hospital site selection: a case study for Prayagraj City, India. GeoJournal. 87(5):3507–3528. doi: 10.1007/s10708-021-10445-y.
- UNESCO. 2005. United Nations decade of education for sustainable development 2005–2014. Framework for the international implementation scheme. Vol. 32. Paris, France: UNESCO. [assessed on 25 Dec 2022]. https://unesdoc.unesco.org/ark:/48223/pf0000148654
- Vasu D, Srivastava R, Patil NG, Tiwary P, Chandran P, Singh SK. 2018. A comparative assessment of land suitability evaluation methods for agricultural land use planning at village level. Land Use Policy. 79:146–163. doi: 10.1016/j.landusepol.2018.08.007.
- Vanegas P, Cattrysse D, Wijffels A, Van Orshoven J. 2010. Finding sites meeting compactness and on- and off-site suitability criteria in raster maps. 2nd International Conference on Advanced Geographic Information Systems, Applications, and Services, GEO Processing 2010, p. 15–20. doi: 10.1109/GEOProcessing.2010.10.
- Villacreses G, Gaona G, Martínez-Gómez J, Jijón DJ. 2017. Wind farms suitability location using geographical information system (GIS), based on multi-criteria decision making (MCDM) methods: the case of continental Ecuador. Renew Energy. 109:275–286. doi: 10.1016/j.renene.2017.03.041.
- Wang YC, Shen JK, Xiang WN. 2018. Ecosystem service of green infrastructure for adaptation to urban growth: function and configuration. Ecosyst Health Sustain. 4(5):132–143. doi: 10.1080/20964129.2018.1474721.
- Wedley WC, Choo EU, Schoner B. 2001. Magnitude adjustment for AHP benefit/cost ratios. Eur J Oper Res. 133(2):342–351. doi: 10.1016/S0377-2217(00)00302-7.
- Yadav V, Karmakar S, Dikshit AK, Vanjari S. 2016. A feasibility study for the locations of waste transfer stations in urban centers: a case study on the city of Nashik, India. J Cleaner Prod. 126:191–205. doi: 10.1016/j.jclepro.2016.03.017.
- Yadav V, Karmakar S. 2021. Multi criteria decision making for sustainable municipal solid waste management systems. Computational management. Cham, Switzerland: Springer; p. 587–598.
- Yoris-Nobile AI, Lizasoain-Arteaga E, Slebi-Acevedo CJ, Blanco-Fernandez E, Alonso-Cañon S, Indacoechea-Vega I, Castro-Fresno D. 2023. Life cycle assessment (LCA) and multi-criteria decision-making (MCDM) analysis to determine the performance of 3D printed cement mortars and geopolymers. J Sustain Cement-Based Mater. 12(5):609–626. doi: 10.1080/21650373.2022.2099479.