
 ?Mathematical formulae have been encoded as MathML and are displayed in this HTML version using MathJax in order to improve their display. Uncheck the box to turn MathJax off. This feature requires Javascript. Click on a formula to zoom.
Abstract
In order to improve the comparability between the geometric information content of vector area objects, this article proposes a method for measuring the geometric information content of area objects based on discrepancy degree of shape points. First, the method selects circles with unique geometric feature as the reference shape for extracting geometric features, and the geometric in-formation carried by each shape point of area objects is represented by the discrepancy degree between the area object and the reference circle at the point position. Second, the proposed method measures the geometric information content of area objects from both local and global perspectives. To avoid the subjectivity of assigning feature weights based on empirical experience, the article uses the relationships between the radii of three reference circles (MIC: Maximum Inscribed Circle, EAC: Equal-area circle, and MCC: Minimum Circumscribed Circle) as adaptive weight parameters for local and global structural geometric information. The amount of geometric information at each shape point is obtained by weighted summation, and the total geometric information content of an area object is the sum of the amount of geometric information of all shape points. To verify the effectiveness and rationality of the proposed method, this article designs a noise simulation dataset for simply building area objects and an empirical ranking dataset for evaluating the measurement performance of the proposed method. The experimental results show that the proposed method achieves a Kendall rank correlation coefficient of 0.88 on the empirical ranking dataset, which is higher than that of the nine existing representative methods. The proposed method is more consistent with human cognition and is highly correlated with the amount and intensity of noise information. Moreover, the proposed method achieves the comparability of geometric information content of area objects and the adaptive determination of geometric feature weights. The proposed method is an effective method for measuring the geometric information quantity of area objects.
1. Introduction
The geometric information content of area objects is a quantitative expression of the diversity of geometric shape features for area objects, which is a key property for effectively understanding and utilizing vector area data (Liao Citation2017; Zhilin et al. Citation2016, Citation2021). Geometric information content has important auxiliary value in various aspects such as selection of area map data (Susan et al. Citation2018), generalization of area map (Tinghua et al. Citation2015; Mianmian et al. Citation2019), multi-scale representation and evaluation of map data (Liu et al. Citation2016, Citation2020; Huimin et al. Citation2014) and readability re-search of maps (Harrie et al. Citation2015; Harrie and Stigmar Citation2010; Cheng et al. Citation2021; Stigmar and Harrie Citation2011; Fairbairn Citation2006). Meanwhile, with the continuous enrichment and accumulation of crowdsourced vector data, the demand for selection of vector data has also increased (Susan et al. Citation2018). The geometric information content of area objects can provide an evaluation index for the richness of spatial information for selection applications of vector data. Compared to indicators such as data size and number of map objects, geometric information content can provide more comprehensively spatial information of map data. Therefore, objectively, and accurately measuring the geometric information content of area objects will help improve the efficiency of selection of crowdsourced vector data.
The prerequisite for applying geometric information content to data selection is that the size of the geometric information content can be used to compare and rank area objects with different shapes. This will serve as the basis for data selection and is also a key factor in improving data selection efficiency. However, existing methods for measuring the geometric information content of area objects have significant subjectivity, resulting in high uncertainty in the measurement results. (Li and Huang Citation2002; Liu et al. Citation2012; Chen and Sundaram Citation2005; Su et al. Citation2006; Basaraner and Cetinkaya Citation2017; Zhao et al. Citation2020). This is because most existing methods use an approach for setting weight value based on human experience to combine geometric features (Mianmian et al. Citation2019; Liu et al. Citation2012; Chen and Sundaram Citation2005; Su et al. Citation2006). The use of weight values can lead to varying measurement results for different models due to difference experience in weight value settings, thereby increasing uncertainty. In addition, existing methods typically utilize similarity analysis theory to extract the geometric shape features of area objects, with the degree of similarity between area objects and simple shapes being the most widely studied geometric feature. However, most studies choose convex hulls or rectangles as reference shapes for geometric feature extraction (Mianmian et al. Citation2019; Liu et al. Citation2012; Chen and Sundaram Citation2005; Su et al. Citation2006; Basaraner and Cetinkaya Citation2017; Zhao et al. Citation2020; Zhang et al. Citation2021; Jiang et al. Citation2020). For example, geometric features such as area ratio of convex hull, edge number ratio of convex hull, perimeter ratio of convex hull, and perimeter ratio of equivalent rectangle is used. Due to the different convex hull and bounding rectangles shapes of different area objects, the extracted geometric features have different calculation standards. The Aspect ratio of different reference rectangles is inconsistent, resulting in different standards for eigenvalue calculation which can also increase the measurement uncertainty of the method. For example, area objects with different shapes and convex hull may have the same measurement values, but the physical meanings between these values are not the same. Finally, some representative methods use some scalar features to represent geometric information, which also increases the uncertainty of measurement results. For example: the number of points, the edges of area objects, the length of the longest axis, the number turning times of boundary and the number of concave and convex points (Mianmian et al. Citation2019; Harrie et al. Citation2015; Harrie and Stigmar Citation2010; Cheng et al. Citation2021; Zhao et al. Citation2020; Zhang et al. Citation2021; Jiang et al. Citation2020; Wentz Citation2010). These scalar features are often normalized in the process of combining multiple features to eliminate differences in dimensions. However, because the ranges of scalar features are uncertain, some information may be lost during the normalization process within the range of sample data, thereby affecting the comparability of the measurement method. Therefore, the geometric information content obtained by existing methods often show low comparability between area objects with different shapes, which severely restricts the accuracy and efficiency of using geometric information content for data selection.
The geometric information of content area objects is primarily reflected in its shape, and the measurement of geometric information mainly involves analysing the relationship between changes in shape and geometric information (Brown and Owen Citation1967). Gestalt theory has conducted comprehensive research on the perception of shape, and the cognitive principles in Gestalt theory help us better understand the influencing factors of geometric information in shape of area objects (Koffka Citation1935; Li et al. Citation2004). According to Gestalt theory, the human brain perceives area objects in a hierarchical cognitive process: the human brain’s perception of the geometric information of area objects is a process from the global structure to the local details; and special points in the shape of area objects have rich geometric information, because different points in the shape contribute significantly differently to the formation of the overall shape. This is also the main basis for simplifying, displacement, merging and typifying operators in cartographic generalization. Secondly, research in computer vision has indicated that the geometric information of area objects is mainly influenced by the spatial distribution of points in the shape, and the more diverse the spatial distribution characteristics of the points are, the higher the geometric information of the area objects will be. A circle is the simplest shape in two-dimensional geometry and has the lowest degree of diversity, because no matter how it is sampled, the geometric features of its points remain consistent (Chambers et al. Citation2018). Therefore, the measurement of geometric information content of area objects needs to simulate the cognitive process of human brain perception of shape, and different points in the boundary of area objects should have different geometric information content due to differences in their positions relative to the overall shape. Finally, due to the uniqueness and lowest degree of diversity of circles, using circles as a reference shape will make the geometric feature values have the same comparison baseline.
Based on the above analysis, this article proposes a method for measure geometry information content of area objects based on discrepancy degree of shape points and selects circles as the reference shape for feature extraction. First, local and global structural features are designed to extract geometric features from both local and global perspectives. Secondly, considering that feature values should have a clear or consistent range, this method chooses the discrepancy degree index used in shape similarity analysis as the feature indicator for expressing geometric information. The range of the discrepancy degree index is kept between [0,1), which avoids information loss caused by normalization of scalar features. Finally, by analysing the variation pattern of geometric shape of area object, it is found that the geometric shape changes can be reflected in the size changes among the three reference circles (maximum in-scribed circle MIC, Equal area circle EAC and minimum circumscribed circle MCC) of area objects. Therefore, the proposed method selects the size relationship among the three reference circles of area objects as the adaptive weight parameter for measuring geometric features and constructs a measurement method for geometric information content of area objects. The proposed method aims to overcome the shortcomings of existing measurement methods in terms of comparability and provide a powerful indicator for the selection of crowdsourced vector data.
The main contributions of this article are as follows:
In order to solve the problem of calculation standards of features for representing geometric information is unclear. The proposed method utilizes the degree of discrepancy between the area objects and their corresponding circles as a measure to characterize the amount of geometric information in the area objects, thereby achieving comparability of the feature values.
Considering the ability of geometric features and the consistency of the value range of the eigenvalues, this article chooses the discrepancy degree index as the indicator for geometric features. The physical meaning and value range of the discrepancy degree remain consistent, and normalization is not necessary during the feature combination process, reducing information loss.
In order to reduce the subjectivity of manually setting weight parameters, this method uses the size relationship between the reference circles of the area objects as the adaptive weight parameters for local and global structural features by analysing the geometric morphology variations of the area objects. While avoiding subjectivity caused by manual settings, this method also achieving adaptive determination of weight parameters between features.
The remainder of the thesis is organized as follows: Section 2 deals with the work related to the main topic of this article’s research, Section 3 deals with the methodology proposed in this article, Section 4 presents the design of the experiments and the experimental results, Section 5 contains the discussion, and Section 6 contains the conclusions drawn from this article.
2. Related work
Research on the geometric information content of area objects primarily comes from two research fields. The first is the field of Cartography, which focuses on measuring spatial information in maps (Zhilin et al. Citation2016, Citation2021; Huimin et al. Citation2014; Harrie et al. Citation2015), including the measurement of geometric information for map objects. The second is the field of computer graphics, which studies the measurement of complexity for 2D graphics (Cesar and Costa Citation1997; Okano et al. Citation2020; Yoshiki et al. Citation2012; Demetriou et al. Citation2013; Angel et al. Citation2010; Attneave Citation1957; Brinkhoff et al. Citation1995; Parent et al. Citation2009; Dutt and Biswas Citation2017; Feldman and Singh Citation2005; Psarra and Grajewski Citation2001). In the field of cartography, the geometric information content of map objects is categorized as the diversity degree of their geometric features (Zhilin et al. Citation2021; Huimin et al. Citation2014; Harrie et al. Citation2015; Basaraner and Cetinkaya Citation2017), which has a high correlation with the measurement of complexity for 2D graphics. Both are based on the theoretical foundation that the amount of cognitive cost required for human visual perception of shapes determines the information content and graphic complexity (Harrie et al. Citation2015; Harrie and Stigmar Citation2010; Fairbairn Citation2006; Brinkhoff et al. Citation1995; Dutt and Biswas Citation2017; Psarra and Grajewski Citation2001). The diversity degree of geometric features is used as the measurement, but the difference lies in the representation of the measurement. In the field of computer graphics, studies often use complexity values or shape index to represent the complexity level of 2D graphics. However, the measurement of geometric information content for area objects uses information entropy as the representation unit. Although there are some differences in their expressions, both have the consistency of measurement principles in characterizing geometric morphology. Similarly, some scholars were inspired by information theory and believed that the complexity of shape is directly related to the amount of information contained in the shape. The more information or features a shape has, the higher the cost required for understanding or perceiving the shape, and thus the shape is considered more complex (Fairbairn Citation2006; Parent et al. Citation2009; Dutt and Biswas Citation2017; Feldman and Singh Citation2005; Psarra and Grajewski Citation2001). Research in this area has gradually been linked by scholars. When using the same information entropy model for joint research, the concept and measurement of graphic complexity can be seamlessly converted to the information entropy involved in the field of map cartography (Feldman and Singh Citation2005; Page et al. Citation2003; Rigau et al. Citation2005). Therefore, discussions about the measurement of geometric information content for area objects in map data will include relevant research on graphic complexity.
Drawing on Wentz’s (Citation2010) classification of shape descriptors, this article categorizes existing research on the measurement of geometric information for area objects into two types: single-parameter models and multi-parameter models. The single-parameter models can be further divided into probabilistic parameter models and non-probabilistic parameter models, differing in the information entropy model used to measure geometric information. The multi-parameter models can be further divided into logic models guided by visual cognition and regression models driven by data.
2.1. Single-parameter models
2.1.1. Probabilistic single-parameter models
Li and Huang (Citation2002) proposed a method for measuring the spatial information of map data based on the Shannon information entropy model. This method uses the ratio of the area of the target object to the total area of the map as the probabilistic feature of the Shannon information entropy model, thereby calculating the geometric information content of the map object in the map space. Geometric information I is defined as:
(1)
(1)
where I represent the amount of geometric information about the map objects in the map space, si represents the area of the ith object in the map space, S represents the total area of the map and N represents the number of map objects in the map space.
Although Li’s method is simple and efficient, it is susceptible to the limitation of map space. For example, when comparing the geometric information content of two maps, it is necessary to fix the map space of both maps. Only when compared within the same map space, can the geometric information content have a unified measurement standard.
Some researchers use the probability distribution of curvature to measure the geometric information of area objects (Okano et al. Citation2020; Yoshiki et al. Citation2012). The curvature of area object refers to the rate of angle change between the sampled points on its contour. Yoshiki et al. (Citation2012) divided the curvature of the boundary points of area object into 100 equally curvature intervals and calculated the curvature entropy of the area object by combining the probability within each curvature interval with the Shannon information entropy model. The curvature entropy was used as a measurement of the geometric information content of the area object, and it was calculated as follows:
(2)
(2)
where Hc represents the curvature entropy of the area object, and U represents the number of intervals of curvature, ph represents the probability that the curvature of a shape point falls within the corresponding h interval.
Similar methods to the above-mentioned research include a series of algorithms such as entropy of angle, entropy of distance, and entropy of edge length (Fairbairn Citation2006; Chen and Sundaram Citation2005; Su et al. Citation2006). Overall, the shortcomings of these methods lie in only considering the distribution of the quantity of features that affect the geometric information, thereby ignoring the order relationship between feature values. This means that area objects with the same probability distribution of feature values have the same geometric information, such as regular polygons, which results in insufficient discriminative power.
2.1.2. Non-probabilistic single-parameter models
Scholars in the field of computer graphics have conducted extensive researches on the complexity of 2D shapes, including many studies on non-probabilistic single-parameter measurements, such as turning number of boundary contour (Mianmian et al. Citation2019), angle variation (Attneave Citation1957), area-perimeter ratio of shape (Psarra and Grajewski Citation2001), variance of internal angle, second moment of perimeter deviation, maximum radial length (Demetriou et al. Citation2013; Angel et al. Citation2010), number of concavities (Feldman and Singh Citation2005; Zhao et al. Citation2020; Dai et al. Citation2022; Dutt and Biswas Citation2017), bending energy (Cesar and Costa Citation1997), symmetry (Chen and Sundaram Citation2005; Su et al. Citation2006), equivalent rectangle index (Basaraner and Cetinkaya Citation2017) and so on.
A representative study is the method proposed by Cesar and Costa (Citation1997) which uses bending energy to represent the geometric information of area objects. This method was initially used to measure the geometric information of nerve cells and is mainly based on the curvature values of points as a measure of geometric information. The geometric information is obtained by combining the curvature values with the calculation formula of energy. It is calculated as follows:
(3)
(3)
where Ψ(σ) represents the bending energy of the area object under a smoothing scale of σ, t represents the sampled points on the boundary of area object, and k(σ,t) represents the curvature value at the sampled points. Although the geometric information content based on bending energy is concise, robust and easy to calculate, its drawback is that the configuration relationship between different sampling points is ignored, resulting in insufficiently comprehensive measurement of geometric information.
Another representative study is the equivalent rectangle index proposed by Basaraner and Cetinkaya (Citation2017) This index uses the ratio of the perimeter of the target object to the perimeter of its equivalent rectangle as the measurement value, which is used to measure the complexity level of the boundary of building. Here, equivalent rectangle refers to a rectangle with the same aspect ratio as the minimum bounding rectangle of the area object and the same area as the area object.
(4)
(4)
where PEAR is the perimeter of the equivalent area rectangle, PPN is the perimeter of the building object, ‘PMBAR’ is the perimeter of the minimum bounding rectangle, and ‘APN’ and ‘AMBAR’ are the area of the building object and its minimum bounding rectangle, respectively. The equivalent rectangle index is easy to calculate and has good application effects in distinguishing the complexity of building boundaries. However, there is an obvious limitation when it comes to applying it to map data. First, map data contains a large number of natural area objects, which are significantly different from artificial buildings with rectilinear features, making the rectangle unsuitable as a reference shape for natural area objects. Second, different area objects have minimum bounding rectangles with different aspect ratios, which make the equivalent rectangle index not comparable between area objects.
2.2. Multi-parameter models
In previous research, the size of internal angles, convexity, length of edges, ratio of area, ratio of edges and ratio of length between the area object and its convex hull, and symmetry of the area object were all major factors affecting the geometric information content of the area objects. However, single-parameter measurement models often only reflect one-sided information about the local or global structure of the area object (Harrie et al. Citation2015; Harrie and Stigmar Citation2010; Basaraner and Cetinkaya Citation2017; Li and Huang Citation2002). To address this problem of insufficiently comprehensive and accurate information in single-parameter models, scholars have considered combining multiple geometric features that affect the geometric information content of the area objects to form a multi-parameter measurement model that considers geometric information content from various perspectives.
2.2.1. Visual cognition-based models
Chen and Sundaram (Citation2005) analysed the geometric information content of area objects from both a global and local perspective and found that the geometric information of area object s is mainly influenced by angles and distances. They used the distance entropy and shape randomness measurement of area objects as features of global information and used the local angle entropy as features of local detailed information. They then combined the global and local features to calculate the geometric information content of area objects. The calculation method is as follows:
(5)
(5)
In the formula Equation(5)(5)
(5) , C represents the geometric information content of the area objects, Cangle represents the local angle entropy, Cdist represents the distance entropy, P represents the smoothness of the boundary points and R represents the measure of shape randomness.
Su et al. (Citation2006) found that the complexity of the area objects, the solidity of the convex hull and the symmetry of the shape are the main factors affecting the geometric information content of area objects. Therefore, they designed a measurement model that combines these three features. The calculation method is as follows:
(6)
(6)
In the formula Equation(6)(6)
(6) , Cs represents the geometric information content of the area objects, SC represents the symmetry factor, BC represents the complexity of the area objects, and GC represents solidity of the convex hull.
Chen et al. and Su et al. used a weighted sum of multiple parameters in a linear equation to represent various features of information content. However, both methods used weight parameters determined by manual experience, which increased the subjectivity and uncertainty of the information measurement model.
Huimin et al. (Citation2014) proposed a geometric information measurement model for area objects based on continuous convex decomposition. This method uses the ratio of the area and the ratios of edges of area objects and its convex hull as the features of geometric information, which can effectively distinguish the convexity and concavity information of area objects. Although this method conforms to the gradual cognition theory of graphics, a significant drawback is that different area objects have various convex hulls, which leads to the degree of proximity between different area objects and their corresponding convex hulls not having the same physical meaning. Additionally, many simple building objects in map data have convex polygons as their boundary, which results in zero feature values when extracting geometric features based on convex hulls. Moreover, the boundary of natural features in map data are complex, and the construction cost of the complex convex hull tree for complex area objects is relatively high. These limitations greatly restrict the application of this model.
Based on the above research, due to the lack of a clear quantitative relationship between the various features that represent geometric information, many existing methods determine weight values mostly by experts setting fixed values based on their experience. This may increase the subjective and uncertainty of the measurement model.
2.2.2. Data-driven regression-based models
Considering the subjectivity and uncertainty of expert experience, some scholars have attempted to study an objective way of setting weights from a data-driven perspective to reduce the subjectivity of the measurement model.
Dai et al. (Citation2022) proposed a multi-parameter regression measurement model based on visual cognitive validation. The model mainly includes three features: weighted angle Shannon entropy, weighted edge length Shannon entropy and solidity of convex hull. A dataset of visual cognitive scores was used to construct and validate a multiple linear regression equation model. Although this method comprehensively measures the geometric information of area objects, it also brings a new problem: the value range of some scalar features is not fixed, such as edge length, increment of convex hull, longest axis length and number of concave-convex points. Normalization of sample data may result in the loss of some information. Zhao et al. (Citation2020) constructed a regression model to measure the geometric information content of area objects by using the parallel computing efficiency as the dependent variable. The independent variables in the regression equation include features such as the proportion of area, the number of points and the degree of point aggregation, which are used to measure the geometric shape of area objects. However, the weight of the number of points in Zhao’s regression equation is as high as 0.692, which makes the measurement values of geometric information highly dependent on the number of points and weakens the role of other features. Zhang et al. (Citation2021) constructed a multi-parameter regression model to measure the geometric information of area objects by using the time cost of spatial analysis of vector data as the dependent variable. The most significant factor in the model is the number of points, with a weight value as high as 0.91. Jiang et al. (Citation2020) chose the time cost of overlay analysis as the dependent variable to construct a multi-parameter regression model, which includes two features: the number of points and the ratio of convex hull area. However, similarly, the weight of the number of points is too high, with a weight of 0.74.
Despite scholars conducting a lot of research, the weight values in data-driven regression models usually differ significantly from visual cognitive experience. This difference is caused by the different principles of computer processing graphics and the visual cognitive of graphics. At the same time, the research on data-driven models often relies on the selection of sample data and different sample data may produce different regression models, which greatly restricts the measurement performance of the regression model.
2.3. Disadvantage of existing methods
As mentioned above, there are three main shortcomings of existing methods for measuring geometric information of area objects:
The degree of proximity between area objects and reference graphics is a key feature in measuring geometric information, which is used in most of the research. However, existing studies have selected convex hulls or rectangles as reference graphics, and their geometric shapes will change with the corresponding geometric shapes of area objects. Therefore, the degree of proximity between different area objects and their corresponding reference shapes does not have the same physical meaning, which results in a low power of comparability between measurement values. Secondly, since simply objects and artificial buildings are usually rectangular or convex polygons, many zero values often appear in the measurement values of geometric features, which affects the distinguishability of geometric information.
In existing representative methods, the weight parameters between features are set to fixed values based on artificial experience, while data-driven regression models consider the number of points on area objects as the decisive variable for measuring geometric information content. This will result in a certain degree of subjectivity and uncertainty in the measurement and application of geometric information content, thus lacking a reasonable method for determining feature weights.
The value range of scalar geometric feature values selected in the multi-parameter model is infinite. Normalization for features from the sample data set will result in the loss of some information in the measurement model, and the measurement performance will be influenced and restricted by the sample data.
3. Methods
To overcome the shortcomings of existing measurement methods, this article pro-poses a method for measuring the geometric information content of area objects based on point discrepancy degree, aiming to measure the geometric information more effectively and objectively and provide a key attribute for application of map data selection.
3.1. Overview of the method
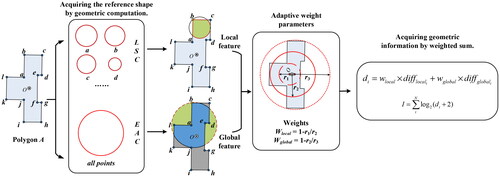
This article is inspired by the Gestalt theory of perception and considers shape points as the basic units that carry geometric information of the area objects. The geometric information contained in the points is reflected in the spatial relationship between the points and the area objects. Based on the above analysis, this article uses the shape points of area objects as the unit of measurement for geometric information. To avoid the shortcoming of insufficient comparability power of the measurement models caused by the unreasonable selection of reference graphics in previous works, this article uses circle which has unique shape as the reference shape for extracting the geometric features of the points. Since circles have the lowest diversity, the degree of discrepancy between area objects and circle can indirectly reflect the degree of diversity of the area objects and hence express the quantity of geometric information (Wang et al. Citation2008; Yan Citation2022, Citation2023). Therefore, the method in this article selects the discrepancy degree between the reference circle and the area objects at the points as the feature representing the amount of geometric information. Considering the hierarchical nature of shape cognition, the proposed method designs two types of discrepancy degree for the local and global structure to express the hierarchical cognition of geometric information. The combination of these two features forms the measurement model for the geometric information content of the area objects. Research framework and workflow is illustrated in .
Figure 1. Research framework and workflow (LSC: local structure circle for each points a, b, c, …; EAC: Circle with equal area as polygon; w: the adaptive weights parameters; di: discrepancy degree at point i; I: geometric information content of polygon).
3.2. Features of local structure
The features of local structural of area objects are designed to capture the geometric information content at the unit point of the shape from a local perspective. In this article, the local structure at the point is defined as the triangle region formed by the target point and its adjacent points, which is the smallest local structure of the area objects under the condition of using the point as the measurement unit. The amount of geometric information in the local structure at the point is mainly influenced by the angle of point and the lengths of its two sides. Given the two sides and the angle, a unique local structure can be determined, which has the function of characterizing the geometric morphology at the point. A circle with a size like that of the local structure is an ideal state with the lowest degree of diversity. We refer to this type of circle as a ‘local structure circle (LSC)’, which serves as a reference shape for extracting local structural features. The diameter of the LSC is given as the average length of the left and right sides of the target point because the length of the point’s neighbourhood side can better reflect the true size of the point’s local structure compared to its area. This article uses the degree of proximity between local structure and the local structure circle (LSC) to reflect the geometric information content in the local perspective. Under the given size of the point’s local structure, the local structure circle has the lowest degree of diversity, and therefore, the degree of proximity mentioned above can be used to indirectly express the degree of discrepancy between the local structure and the circle and hence represent the geometric information content in the perspective of local structure.
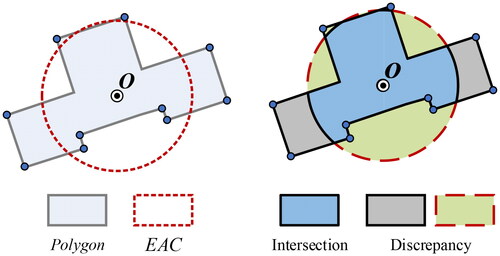
The degree of proximity between the area objects and the reference circle can be expressed by the Shape discrepancy index proposed by Lee and Sallee (Citation1970). The Shape discrepancy index was initially used to evaluate the similarity between two shapes. The index determines the degree of difference by the amount of common area between the two shapes with overlapping centroids. The larger the value of the Shape discrepancy index, the less similar the two shapes are, and vice versa. The schematic diagram of the Shape Difference Index is shown in . This idea, compared to differences in area, perimeter, and edges between area objects and the reference shape, considers the dissimilar parts of the two shapes and more deeply reveals the degree of proximity between them.
Figure 2. Schematic diagram of the difference between area object and its equal-area circle.
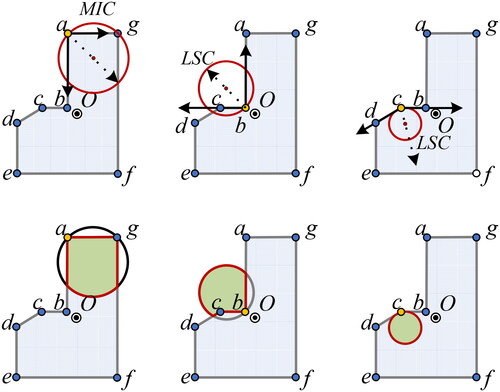
The proposed method draws inspiration from Lee et al.’s idea of using Shape discrepancy index and utilizes it to express the discrepancy relationship between the target point and the LSC, thereby obtaining a quantitative expression of local structural features. Specifically, given the area object A, the local structural feature of the target points a is designed to measure the degree of discrepancy between the local structure and the corresponding LSC at point a. First, at point a, the direction of the LSC corresponding to the local structure at point a is determined by the angle bisector of the angle at point a, as shown in . Second, the area object A is overlaid with the LSC to obtain the Schematic diagram of intersection and difference between the two, as shown in . Finally, from a perspective of local structure, the measurement of the geometric information content does not consider whether the local structure at the point is located inside or outside the area objects, and the convexity or concavity of the target point is symmetrical from a local perspective. Therefore, concave and convex points with the same degree of proximity as the local structure should have the same feature values. Therefore, this article performs dual processing on convex and concave points and calculates the difference and intersection of the LSC and area objects as the calculation parameters for the local structural of the convex and concave points.
Figure 3. Schematic diagram of the discrepancy between the LSC and the area object for different points.
The calculation of the local structural feature difflocal-i of the point i is as follows:
Convex point
(7)
concave point
In the above equation, the larger the value of difflocal-i for a point, the higher the degree of discrepancy between the local structure and the corresponding circle, and the greater the geometric information content contained in the local structure.
In practical shapes of area objects, there may be cases where some adjacent edges of point are too long. When the two edges of a point are relatively long, the area of the LSC formed is much larger than the area object it belongs to, which affects the accuracy of the local structural features. Therefore, this article introduces a new parameter: the maximum inscribed circle (MIC) of the area object. The MIC of the area object is the largest area that can be accommodated within the area object. When the average length of the adjacent edges of the target point is greater than the diameter of MIC, the neighborhood area of the target point no longer belongs to the category of local structure. In order to accurately measure the geometric information of this point at local perspective, this article selects the MIC as the LSC for this type of point, to ensure that the local structure at this point meets the measurement purpose of the local structural features.
3.3. Features of global structure
Compared to the local structural perspective, global structural features primarily express information about the degree of diversity in the overall geometric shape of area objects. However, like the design of the local structural features, the degree of proximity between area objects and the corresponding reference circle can also express the diversity of the geometric morphology of area objects, thereby indirectly expressing the geometric information content of area objects under the perspective of global structure. Since the global structure needs to consider all point in shape of area objects, the selection of the reference circle should also be corresponding. In computational geometry, under the same area conditions, a circle has the smallest perimeter, highest compactness and lowest diversity, making it the simplest shape under this condition, while maintaining consistency in scale with the corresponding area object. Therefore, a circle with equal area (EAC) is the most suitable as a reference circle under the perspective of global structural.
As mentioned earlier, some special points in shape of area objects often contain rich information, which often depends on the spatial relationship between the points and the whole shape of area objects. In order to measure the degree of diversity brought by spatial relationships, this article takes the point as the basic measurement unit and further defines the global structural features as the degree of proximity between the EAC at the target point and the area object. Since the position of the EAC is constrained by the position of the target point, the degree of proximity can reflect the diversity of spatial position between the target point and the whole shape of area objects, which is more conducive to measuring the geometric information by perspective of the global structure. Specifically, given the area object A, the global structural feature is designed to measure the degree of discrepancy between the global structure and the corresponding circle at point a. At point a, an EAC is constructed in the direction of the line connecting point a and the center of the area object A, as shown in . Second, the area object is overlaid with the EAC for analysis, and the discrepancy diagram between the two is obtained, including the intersection and union parts, as shown in . Finally, the global structural feature diffglobal-i for the current point is obtained based on the proportion of the intersection and union parts, calculated as follows:
(9)
(9)
Figure 4. Schematic diagram of the discrepancy between the EAC and the area object for different points.
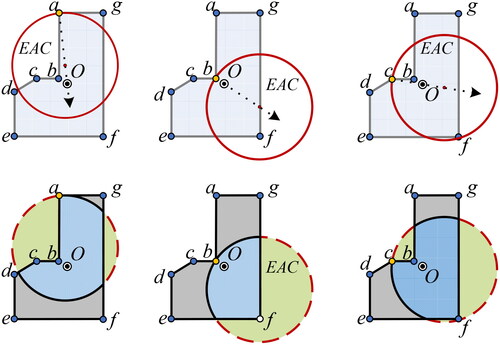
In the above equation, the more the intersection area between the EAC and the area object, and the smaller the union area relative to the area object, the higher the similarity between the EAC and the area object, and the lower the geometric information of the area object at perspective of global structure. The EAC is the simplest shape with the same size as the area object and represents the ideal state of minimizing the geometric information of the area object. The global structural features between the EAC and the area object at different points can effectively reflect the degree to which the point’s spatial position deviates from the whole shape of the area object. The measurement values of the features of protrusion points and concave points both show high values. The high value of features plays a high correlation with visual perception of protrusion and concave, that is, protrusion points and concave points in shape of the area object often carry more geometric information and are also a concentrated expression of the overall geometric information of the area object (Angel et al. Citation2010).
3.4. Definition of adaptive weight values
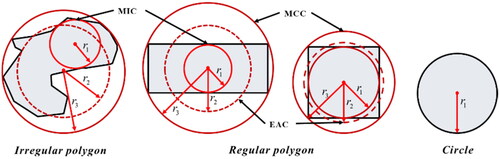
The quantitative relationship between the local structural feature and the global structural feature of shape is a difficult problem in current multi-parameter measurement models. Existing studies often use fixed values set by empirical experience or weight parameters set by data-driven regression models. The limitations of these two methods have been explained above. In order to address these problems, this article analyzes the geometric morphology changes of the shape of area objects and selects the radii of three reference circles (EAC, MIC and MCC: the minimum circumscribing circle) of the target area object as adaptive weight parameters between the local structural features and the global structural features.
The EAC, MIC and MCC of area objects are three adaptive reference shapes that represent the geometric features of area objects in computational geometry. The radii and positions of the three circles vary with changes in the geometric morphology of the area object, as showed in . As the shape of the area object becomes more compactness and smoothness, the positions and sizes of the three circles also tend to be similar, and the area object gradually approaches a standard circular shape. The protrusions or concave in the shape of the area object will affect the radii of the three circles. Specifically, under the condition of the same area, a protrusion in the shape of the area object will cause the radii of MCC to increase, reflecting an increase in the visual size information of the area object, and the importance of the global structural features will increase with the increase in visual size information. A concave in the boundary of the area object will cause the radius of the MIC to decrease. When the radius of the MIC gradually becomes smaller than that of the EAC, the global structure of the area object in visual perception will gradually become localized, and the local structural features at the point of the area object will becomes multiple local structures smaller than the MIC, thereby increasing the importance of the local structural features. Based on the above analysis, the adaptive relationship between the radii of the three reference circles can reflect the changes in the geometric morphology of the area object (). Therefore, this article introduces three parameters: the radius of MIC, EAC and MCC, and the calculation of adaptive weight parameters between the local structural features and the global structural features is as follows:
(10)
(10)
Figure 5. Reference shapes for area objects of different shapes (irregular shape, rectangle and square).
3.5. Calculation of geometric information
The entropy model is a universal model for characterizing information. The focus of this study is the geometric information of area objects, and the unit of geometric information content should also be information entropy unit bit. However, since the point discrepancy degree is a non-probabilistic parameter and the value is positively correlated with geometric information content, it does not comply with the measurement principles based on probability of Shannon entropy. Therefore, the point discrepancy degree is not suitable for the Shannon entropy model. Weijun and Xianlin (Citation1988) proposed an eigenvalue entropy model in their early research on information of map symbol, which can effectively express the positive correlation between eigenvalue and information content and is easy to calculate. Therefore, in this study, Ou’s eigenvalue entropy model is combined with the point discrepancy degree to construct a geometric information content calculation model. The point discrepancy degree at point i is defined as di and the geometric information content of the area object is I, which is calculated as follows:
(11)
(11)
(12)
(12)
The geometric information of the area objects is the sum of point discrepancy degree at all points on the shape of area object. The range of values for both the local structural feature value and global structural feature value is [0, 1]. The physical meaning of both is similar, indicating that the smaller the value, the closer the shape structure is to a circle. Therefore, there is no need to normalize the feature values when calculating the geometric information comprehensively, which reduces the possibility of information loss. When the area object is a circle, the discrepancy degrees of each point is 0. By using the eigenvalue entropy model, the final measurement value of the geometric information content of the circle is 1, which serves as the basic standard unit for measuring geometric information content and the smallest measurement value.
4. Experiments and results
4.1. Experimental design and comparison method
4.1.1. Experimental design
Three experiments were designed to analyze the effectiveness of the proposed method.
Experiment 1: A set of simple regular and irregular area objects were used to validate the superiority of the proposed method over existing methods in measuring the geometric information content of regular and irregular area objects.;
Experiment 2: This article designs a dataset with increasing artificial simulated noise quantity and noise intensity. The dataset is used to evaluate the consistency of the proposed method in measuring results with changes in noise;
Experiment 3: This article constructs an area object dataset based on artificial experimental ranking. The dataset is used to evaluate the consistency of the value size of measurement by proposed method with the visual cognitive information.
4.1.2. Comparison method
Various existing complexity indices and geometric information measurement methods are used as comparison methods, including: curvature entropy C1 (Yoshiki et al. Citation2012), frequency entropy C2 (Liu et al. Citation2020), bending energy C3 (Cesar and Costa Citation1997), equivalent rectangle index C4 (Basaraner and Cetinkaya Citation2017), hierarchical convex decomposition method C5 (Huimin et al. Citation2014), feature combination method based on artificial experiential weighting C6 (Su et al. Citation2006), feature combination method based on artificial experiential weighting C7 (Chen and Sundaram Citation2005), feature combination method based on regression analysis C8 (Jiang et al. Citation2020), and feature combination method based on regression analysis C9 (Zhang et al. Citation2021). The calculation methods are shown in .
Table 1. Nine existing geometric information measurement methods for area object.
4.2. Experiment 1: Comparison of geometric information content between simple regular and irregular area objects
A group of common simple area objects were used to verify the discriminative ability of the proposed method for measuring geometric information content of simple area objects. The simple area objects include circles, squares, rectangles, regular quadrilaterals, irregular quadrilaterals and some regular polygons. The experimental data are shown in .
Figure 6. Schematic diagram of the regular and irregular area objects used in Experiment 1.
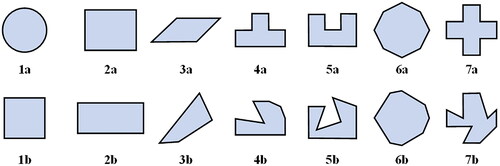
Experimental hypothesis: First, according to the Gestalt cognitive rules, a circle has the simplest cognitive information, so it is considered to have less geometric information than a square. Second, under the same conditions of area, a rectangle with a larger aspect ratio often has a larger visual space, and therefore has relatively higher geometric information content. Finally, under the same number of points and area conditions, irregular area objects have more diverse geometric features than regular area objects, resulting in increased cognitive costs and therefore higher geometric information content. Therefore, the hypothesis of the experiment 1 is that the geometric information content of shape b in each group of shapes is greater than that of shape a.
The results of geometric information content measurements are shown in .
Table 2. Geometric information content measurement results of Experiment 1.
The results show that our proposed method has excellent performance in distinguishing regular and irregular area objects, and its discriminative ability is better than that of existing measurement methods. Among them, the C5 and C6 methods use the convexity of the convex hull and the ratio of the number of edges of the convex hull as the measure of geometric information, so their discriminative power for convex polygons is insufficient, and the measurement values of most elements that have convex polygons as their boundaries are 0. The C1, C2, C3 and C7 methods measure the geometric information of some regular area objects higher than their corresponding irregular objects, which does not conform to visual cognition. The C1, C7 and C8 methods measure the geometric information of circles abnormally higher than other features, which also contradicts the Gestalt cognitive principle. The measurement results of the C7 and C8 methods are highly correlated with the number of points in the element, so their discriminative power for area objects with the same number of points is insufficient. In comparison, our proposed method demonstrates good performance in recognizing circles and comparing irregular and regular features. Due to the ability of global structural features in the proposed method to effectively measure the positional relationship between points and the shape of area objects, it exhibits good discriminative power for geometric information of irregular objects, which is a key factor that makes the proposed method superior to existing methods.
4.3. Experiment 2: Consistency analysis of geometric information content and noise changes
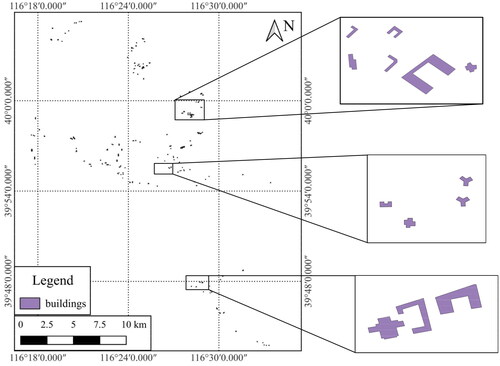
A set of artificially simulated area objects data with noise were used in Experiment 2. Based on human cognitive experience, the geometric information of area objects increases with the increase in the number and intensity of noise points. Therefore, a set of area objects with continuous geometric information changes was constructed by artificially adding different numbers and intensities of noise points to the initial area objects, which were used to verify the consistency of the method. A total of 194 initial area objects in the experiment were selected from the OSM platform. The dataset in Experiment 2 consisted of ten shape recognition, including shapes like Z, H, U, L, T, ‘+’ and Y. On average, buildings of different shapes have approximately 10 shape points. The distribution and shape of experimental data are shown in . The parameters selected for the simulated data in the experiment were the number and intensity of noise points, where the number of noise points was set to 2, 4, 6, 8 and 10, totalling 5 levels, and the noise intensity was set to five levels with intervals of 0.2 between 0.2 and 1. The method for adding noise points involves randomly selecting position along the boundary of the area onject and adding noise points perpendicular to the direction of the line connecting the adjacent two points. The intensity of the noise points is determined by their distance from the adjacent line. The maximum noise intensity, set at one-tenth of the radius of the maximum inscribed circle, determines the distance from the noise point to the adjacent line. The noise intensities increase progressively in a sequential manner of the five levels mentioned above.
Figure 7. Schematic diagram of building dataset in Experiment 2.
shows simulated objects for an initial area object in the experimental data corresponding to different numbers and intensities of noise points.
Figure 8. Schematic diagram of noise simulation area objects with different intensities and numbers.
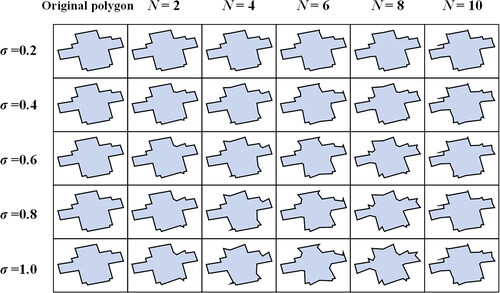
The hypothesis of Experiment 2 is that area objects with more noise points have higher geometric information than those with fewer noise points and area objects with higher noise intensity have higher geometric information than those with lower noise intensity.
The Kendall rank correlation coefficient was used to evaluate the consistency between the geometric information measurement values of different methods and the order of changes in noise intensity and number. The Kendall rank correlation coefficient is an index that measures the consistency of rankings and is particularly suitable for evaluating the relationship between the measurement value order of the methods and the noise in Experiment 2. The Kendall rank correlation coefficient is in the range of [0,1], indicating that the ranking relationship between two sets of samples is positively correlated, with [0.6–0.8] and [0.8,1] representing strong correlation and very strong correlation, respectively. The calculation of the Kendall rank correlation coefficient is as follows:
(13)
(13)
In the formula, P represents the number of pairs of samples with consistent order in the sample data and R represents the Kendall rank correlation coefficient.
First, under five level with fixed noise intensity, the correlation between the measurement value order of geometric information and the order of noise number is shown in .
Table 3. The Kendall rank correlation coefficient between the measurement results of existing methods and the change in noise number.
The results indicate that single-parameter measurement models such as C1, C2 and C4 are not significantly correlated with changes in the number of noise points at the shape of area objects. C3 and C6 show weak positive correlation, while method C5 shows strong correlation. C7, C9, and our method show the same increasing trend of information as the number of noise points increases, and their positive correlation coefficients are all above 0.8, indicating very strong correlation. However, as mentioned earlier, the weighting of the number of points in the regression model is too high for C7 and C9, so the extremely strong correlation results are related to the weight of the number of points.
The method proposed in this article uses points as the unit of measurement for geometric information content. Therefore, an increase in the number of points will also lead to an increase in measurement results. However, under low noise intensity level, the values of local structural features in the proposed method are relatively small, and the increase in measurement results is mainly affected by an increase in global structural features. Under conditions of increasing noise intensity, the values of local structural features at noise points will also increase, and the increase in measurement results is affected by both global and local structural features. Therefore, the proposed method maintains a high level of consistency.
Secondly, under five levels with fixed number of noise points, the correlation between the measurement value order of geometric information and the order of noise intensity is shown in .
Table 4. The Kendall rank correlation coefficient between the measurement results of existing methods and the change in noise strength.
The results indicate that methods such as C3 and C8 are not significantly correlated with changes in the noise intensity at the shape of area objects. C1, C2, C5 and C6 show weak positive correlation, while methods like C4, C7 and C9 have correlation coefficients between 0.4 and 0.6, which are considered basic positive correlation. Only our method shows the same increasing trend of information as the noise intensity increases, with a correlation coefficient between 0.6 and 0.8, indicating strong positive correlation. Currently, most existing methods focus on measuring the number of points and are not sensitive to the changes in geometric information caused by changes in noise intensity under the same number of points. Our method has shown outstanding performance in both experiments.
4.4. Experiment 3: Consistency analysis of geometric information content and visual cognitive
In Experiment 3, a dataset of area objects based on human visual cognitive sorting experience was used to evaluate the consistency of our method with the visual cognitive geometric information size. The experimental data selected area objects from the OSM platform and sorted their geometric information based on human visual cognitive experience. To avoid the influence of area object size on geometric information during the cognitive sorting process, all types of area objects were scaled to the same size grid in the experimental design. The experimental data is shown in , with the subscript indicating the order of geometric information from small to large.
Figure 9. Order of geometric information of area objects based on human visual cognitive experience.
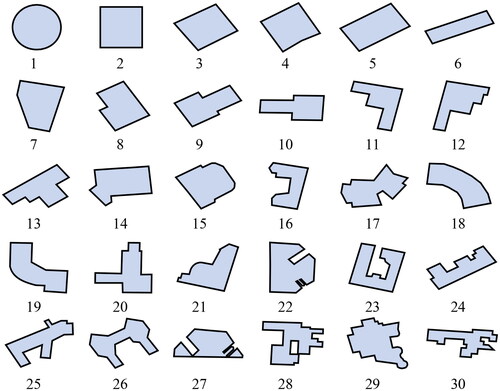
This study recruited 25 students (including undergraduate and graduate students) in the field of cartography from Central South University in China to rate the geometric information of area objects. Each student rated 30 area objects using a seven-level: ‘very complex, complex, moderately complex, moderate, moderately simple, simple, very simple’, with scores of 7, 6, 5, 4, 3, 2 and 1 point, respectively. The geometric information ranking value for each area object was obtained by taking the arithmetic mean of the 25 scores. After the first round of sorting, if area objects with the same score of area objects appeared, a second round of scoring was conducted until the final scores were different, resulting in the determination of the human visual cognitive sorting information for 30 experimental samples. The verification method also used Kendall rank correlation coefficient to evaluate the differences between the geometric information order measured by different methods and the order based on human visual cognitive experience. The experimental results are shown in .
Figure 10. Kendall rank correlation coefficient between the geometric information order based on human visual cognitive experience and existing methods.
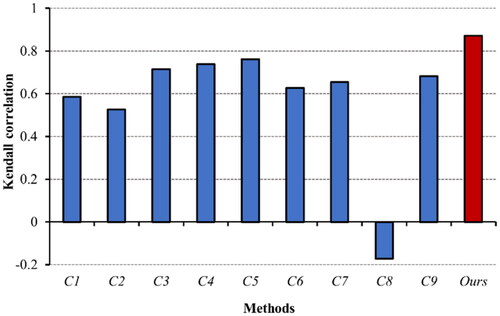
As shown in , in the dataset based on human visual cognitive experience, our proposed method is more consistent with the visual cognitive discrimination results for the geometric information of area objects. The Kendall rank correlation coefficient of our method is as high as 0.873, which is higher than that of existing methods and shows a strong positive correlation with the visual cognitive experience based on human visual cognitive experience.
5. Discussion
The results of the three experiments indicate that existing methods for measuring the geometric information of area objects have shortcomings in terms of sensitivity to noise and discrimination between regular and irregular shapes. Some methods use rectangles and convex hulls as reference shapes to extract features, which have good applicability in measuring artificial features such as buildings. However, due to the variability of rectangles and convex hulls, the geometric information measurement values are not comparable. To address these existing shortcomings, we proposed a method for measuring the geometric information content of area objects based on point discrepancy degree, which effectively solves these three problems.
5.1. The feature values are comparable
In our method, we have chosen circles as the reference shape for feature extraction, taking into consideration the coexistence of both regular and irregular area objects in map data. Additionally, circles possess uniqueness and the lowest diversity, which ensures that features extracted using circles as the reference shape have the same physical meaning and can be compared explicitly. These features represent the degree of proximity between local or global structures and circles, and hold the same physical meaning for area objects with varying structures, making them comparable. Compared with convex hulls and rectangles, the shapes of convex hulls for different area objects have significant differences, and rectangles also have differences in aspect ratio. The advantage of circles lies in their unique geometric shape. The closeness measurement values between two area objects and their respective convex hulls or equivalent rectangles do not have the same physical meaning, so it is not possible to directly compare which area objects has richer geometric information between the two. Therefore, circles are a better choice that considers both regular and irregular area objects for geometric information content measurement method.
5.2. The feature values do not need to be normalized
The consistency of dimensions of values of feature, which is also an advantage of using circles as the reference shape for feature extraction, is because the range of discrepancy values based on circles for both local and global structures is between [0,1). A discrepancy value of 0 indicates that the structure is closer to a circle, and a value approaching 1 indicates a lower similarity between the structure and a circle. Therefore, in the process of fusing global and local structural features, there is no need to normalize the feature values, which avoids information loss and uncertainty increase. In existing methods, some scalar feature values often come with uncertainty and information loss when normalized, such as the scalar parameters in multi-parameter combination measurement models, including the number of edge vibrations, the number of points, the increment of convex hull, the longest axis length, the number of concave-convex points, etc. Since the value range of these parameters is not clear, when normalizing to eliminate the dimension of feature values, it is often based on sample data, which undoubtedly ignores other potential value possibilities and increases uncertainty.
5.3. Adaptive weight setting method based on morphological change of area objects
The adaptive weight setting based on morphological changes of area objects is the third advantage of the point discrepancy method proposed in this article. Existing multi-parameter measurement models mostly use manually set weights or obtain them through regression analysis. Through literature review, we observed that the weights obtained by regression analysis often have strong biases, such as assigning too much weight to the number of points. Weight setting methods based on manual experience often contain the subjective experience of model designers. Therefore, this article’s method combines the visual cognitive rules of graph and uses the quantity relationship between three reference circles based on geometric morphological changes of area objects as weight parameters. For an area object, the larger the difference between the MCC and EAC, the more the shape of the area object extends, and the more obvious the global structural features become. In contrast, the area object tends to be a circle with a central aggregation. The larger the difference between the MIC and the EAC, the higher the degree of concavity of the shape of the area object, and the area object is divided into multiple parts smaller than the MIC, making the local structural features more obvious. In contrast, the area object tends to be a circle. The adaptive determination of weights for global and local structural features conforms to the visual cognitive rules of geometric morphological changes of area objects, while reducing the subjectivity caused by the participation of manual experience.
5.4. Robustness analysis based on natural area onjects
To validate the effectiveness of our method, this article employed noise simulation. However, it is important to note that the noise simulation method is currently only suitable for simple area objects. When it comes to complex area objects, the noise points we add to their boundaries closely resemble the points of the complex area objects themselves. This similarity makes it challenging for map users to differentiate between the noise information. Consequently, natural features with complex boundaries solely based on the number and intensity of noise points are not feasible.
The previous experiment analysed the application effect of our method on simple area objects. To further verify the robustness of our method and assess its effectiveness in measuring the geometric information content of natural area objects, we employed the simplification operator in cartographic generalization as a method of validation. The simplification operator can be considered as a complementary operation to adding noise points. Consequently, as the degree of simplification increases, the geometric information content of map objects should gradually decrease.
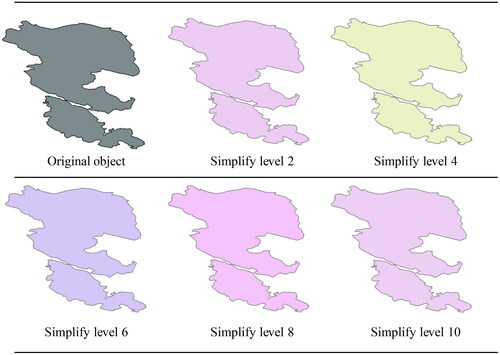
Building upon the theoretical analysis, this article selected lake area objects with natural features and simulated the process of reducing and weakening shape noise points by applying varying degrees of simplification. displays the lake area objects from OSM data, consisting of a total of 1161 objects. Ten consecutive simplification treatments were performed using the ‘POINT_REMOVE’ method in ArcGIS, with the intensity of simplification controlled by adjusting the minimum area tolerance parameter. The parameter ranged from 0.00001 to 0.0001, providing ten intensity levels from small to large. illustrates the simplification results for two lake area objects.
Figure 11. Dataset of lake area objects with natural shape features.
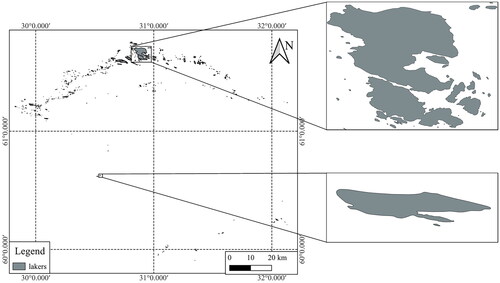
Figure 12. Schematic diagram of lake area objects with different degrees of simplification. (only schematic diagrams of 5 levels are shown here).
After simplification, the number of points in the layer’s lake area objects decreased from 100% of the original layer to 45.5%, resulting in the removal of 54.5% of the points. The measurement results of most existing measurement methods align with the simplification process. provides the measurement results and Kendall rank correlation coefficients for reference.
Table 5. The Kendall rank correlation coefficient between the measurement results of existing methods and the degree of simplification.
The proposed method maintains the same order consistency as most existing methods. However, it demonstrates advantages over other methods when comparing the measurement values of information content. illustrates a line chart displaying the measurement values for 10 simplification results obtained from all methods. To enable a comprehensive comparison, we performed maximum normalization on the measurement values of each method, allowing for the representation of all results in a single graph.
Figure 13. Normalized geometric information content measurement value of existing methods.
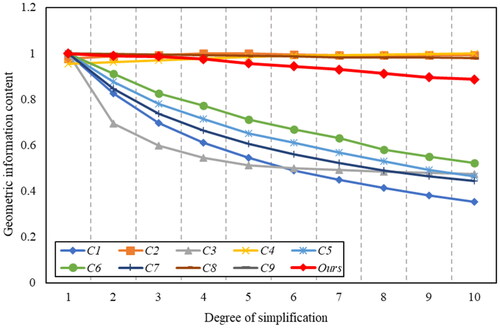
illustrates that as the degree of simplification increases, the information content of our method gradually decreases. The simplest layer retains 88.7% geometric information content. Among the existing methods, the information attenuation of the C8 and C9 methods is less than 1%, while the C5, C6 and C7 methods show an information attenuation of approximately 50%. Despite the removal of numerous points during the simplification process, the overall structure of the area object still maintains a high similarity to its original state, indicating that the majority of geometric information content related to visual cognition of the area object is preserved. In comparison, the information attenuation in C8 and C9 is minimal, suggesting calculation errors. The results of C5, C6 and C7 indicate that the difference in information content between the simplified layer and the original layer is twice as large, which contradicts the observation that the simplified layer still closely resembles the original layer. Therefore, our method’s results for the simplification process align more closely with visual cognition.
Based on the three aforementioned experiments and the robustness analysis discussed earlier, the method proposed in this article exhibits a strong capability to measure noise addition in simple area objects. It effectively distinguishes between regular and irregular simple area objects, displaying high consistency with the amount of information recognized by human visual cognition. The measurement effect surpasses that of existing methods. Furthermore, the method proposed in this article demonstrates a favourable measurement result on the simplification process of complex area objects, with the information measurement results showing high consistency with the actual simplification process. In summary, the method proposed in this article exhibits robustness.
6. Conclusions
This article proposes a method for measuring the geometric information content of area objects based on discrepancy degree of shape points. The proposed method uses circles as the reference shape for extracting geometric features to ensure the comparability of feature values. The degree of discrepancy index in similarity theory is used to measure the degree of discrepancy between local and global structures and the reference circle, which is used as the feature value for local and global structures. The proposed method succeeds the quantity relationship between three reference circles of area object as adaptive weight values for two structural features. The weighted sum of these features is used to obtain the geometric information content of area object. We use three sets of experiments for evaluate the effectiveness, and the results show that it has higher discrimination power for both regular and irregular objects compared to existing methods. The geometric information content measured by the proposed method is more consistent with human visual cognitive experience of the size of area objects, and more consistent with the noise quantity and intensity of area objects, which make it superior to existing representative methods.
Although existing experiments have shown that our proposed method is robust, the concept of geometric information content of area objects has many different definitions. The work of this article is to use circles as the reference shape to construct a comparable measurement method. When using our method for analysis and selection of map data, the geometric information content between map data has physically meaningful comparability, which will help improve the reliability for research and application of map data. However, the study of spatial information measurement of map data not only includes geometric information, but also involves further research on the spatial distribution information of area map data based on geometric information in our future work.
Data availability statement
The data presented in this study are available on request from the corresponding author.
Disclosure statement
The authors declare no conflict of interest
Additional information
Funding
References
- Angel S, Parent J, Civco DL. 2010. Ten compactness properties of circles: measuring shape in geography. Canad Geograph/Le Géographe Canadien. 54(4):441–461. doi: 10.1111/j.1541-0064.2009.00304.x.
- Attneave F. 1957. Physical determinants of the judged complexity of shapes. J Exp Psychol. 53(4):221–227. doi: 10.1037/h0043921.
- Basaraner M, Cetinkaya S. 2017. Performance of shape indices and classification schemes for characterising perceptual shape complexity of building footprints in GIS. Int J Geograph Info Sci. 31(10):1952–1977. doi: 10.1080/13658816.2017.1346257.
- Brinkhoff T, Kriegel HP, Schneider R. 1995. Measuring the complexity of polygonal objects. Proceedings of the 3rd ACM International Workshop on Advances in Geographical Information Systems, p. 109–117. New York: ACM Press.
- Brown DR, Owen DH. 1967. The metrics of visual form: methodological dyspepsia. Psychol. 68(4):243–259.
- Cesar R, Costa L. 1997. Application and assessment of multiscale bending energy for morphometric characterization of neural cells. Review Entif Inst. 68(5):2177–2186. doi: 10.1063/1.1148112.
- Chambers E, Emerson T, Grimm C, et al. 2018. Exploring 2D shape complexity. Research in Shape Analysis. Association for Women in Mathematics Series, vol 12. Cham: Springer.
- Chen Y, Sundaram H. 2005. Estimating complexity of 2D shapes. IEEE Workshop on Multimedia Signal Processing. IEEE.
- Cheng X, Liu Z, Zhang Q. 2021. MSLF: multi-scale legibility function to estimate the legible scale of individual line features. Cartograph Geograph Info Sci. 48(2):151–168. doi: 10.1080/15230406.2020.1857307.
- Dai L, Zhang K, Zheng XS, Martin RR, Li Y, Yu J. 2022. Visual complexity of shapes: a hierarchical perceptual learning model. Vis Comput. 38(2):419–432. doi: 10.1007/s00371-020-02023-z.
- Demetriou D, See L, Stillwell J. 2013. A parcel shape index for use in land consolidation planning. Transactions in GIS. 17(6):861–882. doi: 10.1111/j.1467-9671.2012.01371.x.
- Dutt M, Biswas A. 2017. Boundary and shape complexity of a digital object. International Symposium Computational Modelling of Objects Represented in Images.
- Fairbairn D. 2006. Measuring map complexity. The Cartographic Journal. 43(3):224–238. doi: 10.1179/000870406X169883.
- Feldman J, Singh M. 2005. Information along contours and object boundaries. Psychol Rev. 112(1):243–252. doi: 10.1037/0033-295X.112.1.243.
- Harrie L, Stigmar H. 2010. An evaluation of measures for quantifying map information. ISPRS J Photogram Remote Sens. 65(3):266–274. doi: 10.1016/j.isprsjprs.2009.05.004.
- Harrie L, Stigmar H, Djordjevic M. 2015. Analytical estimation of map readability. IJGI. 4(2):418–446. doi: 10.3390/ijgi4020418.
- Huimin L, Min D, Zide F, et al. 2014. A characteristics-based approach to measuring spatial information content of the settlements in a map. Acta Geodaetica et Cartographica Sinica. 43(10):1092–1098.
- Jiang Y, Jin B, Zhao K, Zhou S. 2020. Research on measurement of polygon shape complexity in overlay calculation. Sci Survey Map. 45(11):177–184.
- Liao K. 2017. Retrospect and prospect of the development of Chinese cartography. Acta Geodaetica et Cartographica Sinica. 46(10):1517–1525.
- Koffka K. 1935. Principles of gestalt psychology. New York: Harcourt. Brace.
- Lee D, Sallee T. 1970. A method of measuring shape. Geographical Review. 60(4):555–563. doi: 10.2307/213774.
- Li Z, Huang P. 2002. Quantitative measures for spatial information of maps. Int J Geograph Info Sci. 16(7):699–709. doi: 10.1080/13658810210149416.
- Liu H, Deng M, He Z, Xu Z. 2012. An approach to measuring the spatial information content of an area feature. Geograph Geo-Info Sci. 14(6):744–750. +774doi: 10.3724/SP.J.1047.2012.00744.
- Liu P, Li X, Liu W, Ai T. 2016. Fourier-based multi-scale representation and progressive transmission of cartographic curves on the internet. Cartograph Geograph Info Sci. 43(5):454–468. doi: 10.1080/15230406.2015.1088799.
- Liu P, Xiao T, Xiao J, Ai T. 2020. A multi-scale representation model of polyline based on head/tail breaks. Int J Geograph Info Sci. 34(11):2275–2295. doi: 10.1080/13658816.2020.1753203.
- Li Z, Yan H, Ai T, Chen J. 2004. Automated building generalization based on urban morphology and Gestalt theory. Int J Geograph Info Sci. 18(5):513–534. doi: 10.1080/13658810410001702021.
- Mianmian C, Qun S, Li X, et al. 2019. Polygon contour similarity and complexity measurement and application in simplification. Acta Geodaetica et Cartographica Sinica. 48(4):489–501.
- Okano A, Matsumoto T, Kato T. 2020. Gaussian curvature entropy for curved surface shape generation. Entropy. 22(3):353doi: 10.3390/e22030353.
- Page DL, Koschan A, Sukumar SR, et al. 2003. Shape analysis algorithm based on information theory. International Conference on Image Processing. IEEEdoi: 10.1109/ICIP.2003.1246940.
- Parent J, Civco D, Angel S. 2009. Shape metrics (presentation). In ESRI 2009 User Conference, University of Connecticut.
- Psarra S, Grajewski T. 2001. Describing shape and shape complexity using local properties. In Proceedings of 3rd International Space Syntax Symposium.
- Rigau J, Feixas M, Sbert M. 2005. An information-theoretic framework for image complexity. Computational Aesthetics 2005: Euro graphics Workshop on Computational Aesthetics in Graphics, Visualization and Imaging, Girona, Spain, May 18–20, 2005. DBLP, 2005.
- Stigmar H, Harrie L. 2011. Evaluation of analytical measures of map legibility. Cartograph J. 48(1):41–53. doi: 10.1179/1743277410Y.0000000002.
- Su H, Bouridane A, Crookes D. 2006. Scale adaptive complexity measure of 2D shapes. International Conference on Pattern Recognition. IEEE.
- Susan S, Kenan B, Arzu Ç. 2018. Measured and perceived visual complexity: a comparative study among three online map providers. Cartograph Geograph Info Sci. 45(3):238–254.
- Tinghua A, Yakun H, Xin D. 2015. Information entropy change in GIS data scale transformation. Geograph Geo-Info Sci. 31(2):7–11.
- Wang D, Belyaev A, Saleem W, et al. 2008. Shape complexity from image similarity. 2008.
- Weijun O, Xianlin Y. 1988. Measurement of map information content-the general eigenvalue measuring method. Map. (04):3–7.
- Wentz E. 2010. A shape definition for geographic applications based on edge, elongation, and perforation. Geograph Anal. 32(2):95–112. doi: 10.1111/j.1538-4632.2000.tb00419.x.
- Yan H. 2022. Spatial similarity relations. Beijing: Science Press.
- Yan H. 2023. Theoretical system and potential research issues of spatial similarity relations. Acta Geodaetica et Cartographica Sinica. 52(5):1–24.
- Yoshiki U, Takeo K, Koichiro S, et al. 2012. Curvature entropy for curved profile generation. Entropy. 14(3):533–558.
- Zhang P, Fan J, Zhang P, Zhang Z, Chen Z, Han L. 2021. Comparative study on the effect of shape complexity on the efficiency of different overlay analysis algorithms. IEEE Access. 9:144179–144194. doi: 10.1109/ACCESS.2021.3121753.
- Zhao K, Jin B, Fan H, Yang M. 2020. A data allocation strategy for geocomputation based on shape complexity in a cloud environment using parallel overlay analysis of polygons as an example. IEEE Access. 8:185981–185991. doi: 10.1109/ACCESS.2020.3030700.
- Zhilin L, Peichao G, Zhu X. 2021. Information theory of cartography: an information-theoretic framework for cartographic communication. J Geod Geoinfo Sci. 4(01):1–16.
- Zhilin L, Qiliang L, Peicha G. 2016. Entropy-based cartographic communication models: evolution from special to general cartographic information theory. Acta Geodaetica et Cartographica Sinica. 45(7):757–767.