
 ?Mathematical formulae have been encoded as MathML and are displayed in this HTML version using MathJax in order to improve their display. Uncheck the box to turn MathJax off. This feature requires Javascript. Click on a formula to zoom.
Abstract
This study evaluated performances of the Climate Hazard Group Infrared Precipitation with stations version 2.0 (CHIRPS v2.0) and Multi-Source Weighted-Ensemble Precipitation version 2.8 (MSWEP v2.8) products against observed data. Rainfall climatology was simulated for different agro-ecological zones (AEZs) of Ethiopia during 1991–2020 at different temporal scales. Performance evaluations were made using continuous and statistical performance measures as well as Probability Density Function (PDF). CHIRPS v2.0 for estimating monthly, seasonal, and annual rainfall totals, and MSWEP v2.8 for daily rainfall have shown better performance over all AEZs. The two products display comparable performance for detecting daily rainfall occurrences over alpine AEZ, but MSWEP v2.8 is superior in the rest four AEZs. CHIRPS v2.0 outperforms MSWEP v2.8 for detecting most of the daily rainfall intensity classes over all AEZs. The findings will play a noteworthy role to improve the quality of hydro-climate studies in Ethiopia.
Keywords:
1. Introduction
Rainfall is one of the most important hydrological and climatic elements and hence, accurate rainfall data is critical for many aspects (Wiwoho et al. Citation2021; Dangol et al. Citation2022; Li et al. Citation2022). Rain gauge is considered to be the most reliable rainfall data source (Liu et al. Citation2020; Polong et al. Citation2023). However, the sparse and uneven distribution of rain gauges makes their applicability difficult (Cavalcante et al. Citation2020; Bathelemy et al. Citation2022; Guo et al. Citation2023). Satellite/reanalysis rainfall products have recently become an alternative source to rain gauges and have shown broader applicability in different studies (Dinku et al. Citation2007; Aksu and Akgül Citation2020). For example, reliable information from satellite/reanalysis rainfall products with sufficient spatiotemporal scales can be applicable for hydrological modeling (Aksu and Akgül Citation2020; Dangol et al. Citation2022; Hafizi and Sorman Citation2022; Kouakou et al. Citation2023), drought monitoring (Li et al. Citation2022; Randriatsara et al. Citation2022) and water resources assessment and modeling (Wiwoho et al. Citation2021; Dangol et al. Citation2022; Randriatsara et al. Citation2022). Accurate rainfall data can be also applied to agricultural decision-making (Paredes-Trejo et al. Citation2017; Randriatsara et al. Citation2022), flood monitoring (Nashwan et al. Citation2019; Bathelemy et al. Citation2022), and climate change impact and adaptation studies (Cavalcante et al. Citation2020; Randriatsara et al. Citation2022).
Due to a lack of meteorological data particularly in developing countries, several studies were undertaken to identify the best rainfall products over different areas of the world (Aksu and Akgül Citation2020; Ageet et al. Citation2022; Dayal et al. Citation2023; Reddy and Saravanan Citation2023; Valencia et al. Citation2023). For instance, Ageet et al. (Citation2022) evaluated MSWEP v2.2, MSWEP v2.8, and CHIRPS v2.0 with other products in Equatorial East Africa. Awange et al. (Citation2019) also made a performance assessment of MSWEP v2.1 and CHIRPS v2.0 together with other rainfall products over Australia and Africa. CHIRPS v2.0 and MSWEP v2.8 were also evaluated together with other rainfall products in Colombia (Valencia et al. Citation2023), Arun River Basin, Nepal (Dangol et al. Citation2022) and over eastern Turkey (Hafizi and Sorman Citation2022). Dinku et al. (Citation2018) assessed representations of CHIRPS v2.0 with other rainfall products over Eastern Africa. The majority of these studies indicated that CHIRPS v2.0 was superior in simulating the observed rainfall climatology than the other rainfall products (Ageet et al. Citation2022; Valencia et al. Citation2023). On the other hand, a study by Ageet et al. (Citation2022) over Equatorial East Africa indicated that the performance of MSWEP v2.8 was declining as compared with MSWEP v2.2. On the other hand, Reddy and Saravanan (Citation2023) evaluations of seven rainfall products in India, of which two of them are CHIRPS v2.0 and MSWEP v2, indicated the better performance of MSWEP v2 compared to CHIRPS v2.0.
CHIRPS v2.0 with other rainfall products were also evaluated in Ethiopia ranging from national to small area scales (Diro et al. Citation2009; Abebe et al. Citation2020; Degefu et al. Citation2022; Beyene et al. Citation2023). For example, CHIRPS v2.0 and other three rainfall products were assessed over the Upper Blue Nile basin (Abebe et al. Citation2020). CHIRPS v2.0 with other 19 rainfall products were also studied in Ethiopia (Degefu et al. Citation2022). Other studies include CHIRPS v2.0 with other five rainfall products and their downscaled version over Wabi-Shebele river basin (Tadesse et al. Citation2022). Most of the studies concluded that CHIRPS v2.0 was superior in replicating rainfall climatology than other products, especially at a monthly time scale (Ayehu et al. Citation2018; Belete et al. Citation2020; Wedajo et al. Citation2021; Malede et al. Citation2022; Tadesse et al. Citation2022). MSWEP v2.8, CHIRPS v2.0, and TAMSAT v3.1 were also evaluated recently over the Bale Eco-Region, Southern Ethiopia (Gashaw et al. Citation2023). In Gashaw et al. (Citation2023) study, MSWEP v2.8 was superior than CHIRPS v2.0 to detect daily rainfall, but CHIRPS v2.0 outperformed than MSWEP v2.8 for detecting the monthly rainfall.
Therefore, previous evaluations of rainfall products in Ethiopia were focused on small-scale areas (watersheds, sub-basins, basins) of the country (Fenta et al. Citation2018; Belay et al. Citation2019; Abebe et al. Citation2020; Tadesse et al. Citation2022). In addition, the majority of previous evaluations of rainfall products in Ethiopia were performed by taking the average values of the study area (Andualem et al. Citation2020; Tadesse et al. Citation2022), except few of them which categories the their study area into broad categories, such as highland (>1500 m a.l.s.) and lowland (<1500 m a.l.s.) (Fenta et al. Citation2018; Belay et al. Citation2019). However, the performance of satellite/reanalysis rainfall products depend on topography, season, and climate (Dinku et al. Citation2007, Citation2018; Bathelemy et al. Citation2022; Reddy and Saravanan Citation2023) and hence, it can vary from one climate zone to another, particularly in mountainous countries, such as Ethiopia. Moreover, the majority of previous evaluations of rainfall products did not cover the full range of temporal scales (Belay et al. Citation2019; Lemma et al. Citation2019; Tadesse et al. Citation2022). However, a recent finding from the Bale Eco-Region (Southern Ethiopia) indicated that the performance of rainfall products can vary from one temporal scale to another (Gashaw et al. Citation2023). Furthermore, most of the earlier studies in Ethiopia were evaluated those rainfall products using continuous and categorical performance measures (Fenta et al. Citation2018; Belay et al. Citation2019). In addition to these metrics, however, evaluation of rainfall products using rainfall intensity is important for certainly use the best performing model for hydro-climate and hydro-sediment researches.
Therefore, this study aimed to evaluate the performances of MSWEP v2.8 and CHIRPS v2.0 over AEZs of Ethiopia for simulating rainfall climatology from daily to annual temporal scales for the period 1991–2020 with 47 meteorological stations data. The main reasons for the selection of these two products over others include: (A) In Ethiopia, many studies evaluated gridded satellite/reanalysis products in different watersheds/sub-basins/basins, and indicated the superior performance of CHIRPS v2.0 compared to other products (Ayehu et al. Citation2018; Belete et al. Citation2020; Wedajo et al. Citation2021; Malede et al. Citation2022). Hence, we focused to evaluate satellite/reanalysis product which have good performance, and (B) MSWEP v2.8 is a new product and it has not been evaluated except in the Bale Eco-Region (Gashaw et al. Citation2023). However, the earlier versions of MSWEP2.8 (MSWEP v2.1 and MSWEP v2.2) were evaluated in the Upper Blue Nile basin (Abebe et al. Citation2020; Lakew Citation2020). In addition, MSWEP v2.0 was also used as an input for hydrological modeling in the Central Rift Valley basin (Abraham et al. Citation2022). Therefore, since there are limited studies on MSWEP v2.8, we are interested to compare the most performing rainfall product (CHIPRS v2.0) with the new rainfall product (MSWEP v2.8) at the national scale at different AEZs. Therefore, the novelty of this study is the evaluations of the latest versions of the two rainfall products using a comprehensive performance evaluation metrics, which is using continuous, categorical, and intensity performance measure statistics, from daily to annual temporal scales at each AEZs of the country. The best performing rainfall product from this study can be used for downscaling climate models and hence, it can facilities our understanding of future climate change under different scenarios with the spatial scale of the country. The findings from this study will also assist a national-scale climate change impact and adaptation studies. The findings will also play key roles in applying the most performing rainfall product for drought monitoring and hydrological forecasting over the country.
2. Materials and methods
2.1. Study area
Ethiopia lies in the Eastern part of Africa, which covers ∼1.12 million km2 (Degefu and Bewket Citation2023). The country has varied topography including craggy, high mountains, deep gorges with rolling plains, rivers, and plateaus with flat tops (Cheung et al. Citation2008). The study area’s elevation ranges from 120 meters below sea level (in the northeast, particularly in the Danakil depression) to 4,620 meters above sea level (m.a.s.l) in the northern mountainous region of the country, Mount Ras Dejen (Wubaye et al. Citation2023). Ethiopia is characterized by five traditional AEZs () (MOA Citation1998), which is relying on topography and climate. These zones are known as Bereha/Desert, Kolla/Tropical, Woyna Dega/Sub-tropical, Dega/Temperate, and Wurch/Alpine. Each AEZ is associated with specific elevations: Bereha/Desert encompasses areas below 500 m.a.s.l., Kolla/Tropical ranges from 500 to 1500 m.a.s.l., Woyna Dega/Sub-tropical spans from 1500 to 2300 m.a.s.l., Dega/Temperate covers elevations between 2300 and 3200 m.a.s.l., while Wurch/Alpine represents regions above 3200 m.a.s.l. (MOA Citation1998). Presentations of land use/land cover (LULC) extents using Copernicus Sentinel-2A Earth observation imagery by Hailu et al. (Citation2018) revealed that cultivated land is the dominant LULC type in the highlands (>1500 m.a.s.l) while shrubland, grassland, and bare areas are the foremost LULC types in the lowlands (<1500 m.a.s.l). On the other hand, tress and vegetation covers are available both in the highlands and lowlands.
Figure 1. The location of Ethiopia from Africa and the meteorological stations used in this study.
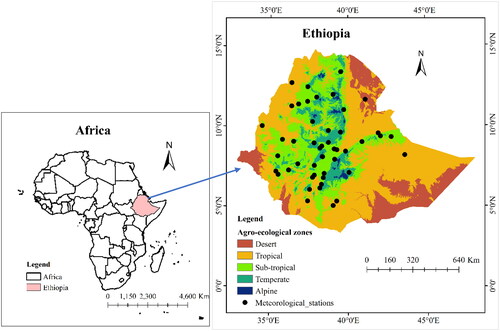
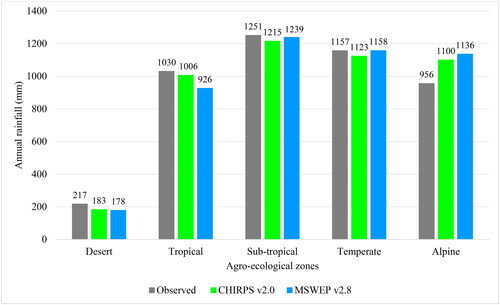
In Ethiopia, rain gauges which are used to measure rainfall are sparse and uneven. Even those available sparse rain gauges do not have continuous records of data (Dinku et al. Citation2007). Ethiopia has three distinct seasons, locally known as Bega, Belg, and Kiremt. For the majority of Ethiopia, the short rainy season, known as the Belg, lasts from February to May, while the main rainy season/Kiremt stays from June to September and the dry season/Bega lasts from October to January. According to the long-term annual average rainfall (1991–2020) estimates of the 47 observed meteorological stations (), the mean annual rainfall extends from 217 mm over the desert AEZ to 1251 mm over the sub-tropical AEZ (), which is computed by taking the average values of stations found in the same AEZ (Supplementary Table 1). The mean annual temperature of the country ranges from <10 to 40 °C (Degefu and Bewket Citation2023).
Figure 2. The long-term annual average rainfall (1991–2020) values of the observed data, and CHIRPS v2.0 and MSWEP v2.8 estimates over the different AEZs of the country.
2.2. Data
2.2.1. Observed rainfall data
Daily observed rainfall data from 47 meteorological stations (; Supplementary Table 1) for the 1991–2020 periods were obtained from the Ethiopian Meteorology Institute (EMI). The main reason why this study used only 47 stations is due to the absence of other stations which have long data series and less percentage of missing data. Of the 47 meteorological stations, 28, 9, and 8 of them are located in Woyna Dega/Sub-tropical, Kolla/tropical, and Dega/temperate AEZs, respectively. The remaining two stations are located in Wurch/Alpine and Bereha/Desert AEZs (i.e. one station from each) (; Supplementary Table 1). This study used stations which have missing values <25%, which is reasonable in data scarce regions, such as Ethiopia. Due to the absence of many stations which have lower missing values, Gashaw et al. (Citation2023) in the Bale Eco-Region, Mohammed et al. (Citation2022) in the Upper Blue Nile basin and Diro et al. (Citation2009) over Ethiopia have also used stations that contain up to 20, 30, and 20% missing data, respectively. Mekasha et al. (Citation2014) have also used stations data with up to 25% missing values to study trends and variability of climate in three eco-environments in Ethiopia. The missing values of this study were filled using the Multivariate Imputation by Chained Equations (MICE) package in R software. Then after, the rainfall data have been subjected for quality control in RClimDex package within R software (Zhang and Yang Citation2004), and errors, such as negative rainfall were replaced with the nearest station. Outliers were also treated according to the suggestion given by the World Meteorological Organization (WMO Citation2009). The details of the data processing and the methods used for filling missing values are available in Wubaye et al. (Citation2023).
2.2.2. Satellite/reanalysis rainfall products
This study evaluated the performances of CHIRPS v2.0 and MSWEP v2.8 for simulating the rainfall climatology over different AEZs of Ethiopia. Brief descriptions of both of these rainfall products are given below.
CHIRPS v2.0 is a quasi-global dataset (50° N-50° S) available at daily, pentadal, and monthly temporal scales with a spatial resolution of 0.05° (∼5 km) (Funk et al. Citation2015) (). CHIRPS v2.0 is a combined product of remotely sensed and gauge observations. The main input data sources used in CHIRPS v2.0 are monthly CHIRPS climatology from the Climate Hazard Group (CHPclim), quasi global geostationary thermal infrared observations from National Oceanic and Atmospheric Administration-Climate Prediction Center (NOAA-CPC), the National Climate Data Center (NCDC), TRMM3B42, NOAA climate forecast system version 2 (CFSv2), and observations from various sources. In Ethiopia, CHIRPS v2.0 has used 76 meteorological/gauged observations (Funk et al. Citation2015). The CHIRPS v2.0 rainfall data is available from 1981 to the revision of this paper is performed (i.e. 2023) at ftp://ftp.chg.ucsb.edu/pub/org/chg/products/CHIRPSv2.0 . CHIRPS v2.0 is mainly developed for monitoring droughts and extremes.
Table 1. Descriptions of CHIRPS v2.0 and MSWEP v2.8 rainfall products.
MSWEP v2.8 is a globally available dataset (Beck et al. Citation2019), which was produced through the weighted merging of gauge, satellite, and reanalysis-based rainfall products. The merged weights were determined by assessing the performance of the input datasets individually against quality-controlled gauge rainfall. The weighted merged results into a 3 h reference rainfall dataset, which is then calibrated using daily and monthly gauge rainfall. MSWEP v2.8 was produced by reducing datasets used for its earlier version (MSWEP v2.2) from five to two, and a reduction in the amount of gauge data used without a change in the algorithm (Beck et al. Citation2019). MSWEP v2.8 dataset is available with a spatial resolution of 0.1° (∼11 km) and temporal resolution of 3 h, daily, and monthly time scales at all latitudes and longitudes of the globe from 1979 to the revision of this paper is made (i.e. 2023) (Beck et al. Citation2019) (). MSWEP v2.8 is a unique rainfall dataset because: (1) it contains long records of data [1979 to the revision of this paper was undertaken (i.e. 2023)] at a higher temporal resolution (3 h) besides to the daily and monthly temporal scales, and (2) it provides data almost equivalent to real time estimation. The MSWEP v2.8 dataset is available at http://www.gloh2o.org/. The long-term annual average rainfall (1991–2020) values of the observed data as well as CHIRPS v2.0 and MSWEP v2.8 estimates over the different AEZs of the country are provided in to aid in better understanding of the datasets.
2.3. Methods
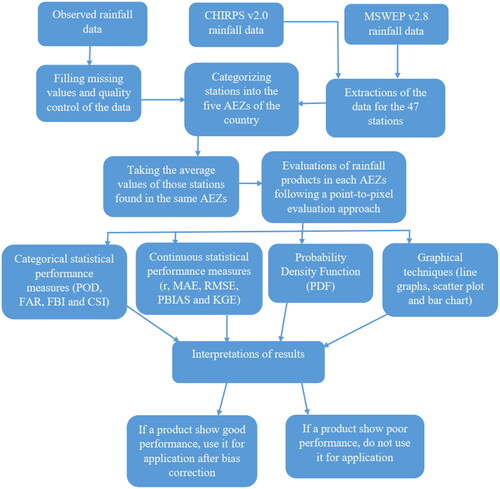
Performance evaluations of the studied rainfall products were undertaken using a point-to-pixel evaluation approach. The main reason why we did not do spatial comparisons in the present study is due to the unavailability of enough data. As it is mentioned before, this study used 47 stations and hence, making spatial comparisons through interpolation of these stations data would be misleading as rainfall in Ethiopia vary within small distance since it is highly determined by topography. As a result, we focused only on a point-to-pixel evaluation. In line with this, for areas with complex topography and small number of gauging stations, most studies suggested a point-to-pixel comparison (Fenta et al. Citation2018; Ageet et al. Citation2022; Peña‐Guerrero et al. Citation2022; Tadesse et al. Citation2022; Gashaw et al. Citation2023). Hence, a point-to-pixel evaluation approach was performed by comparing gauge (observed) data to the closest satellite/reanalysis product pixel value. The observed as well as the extracted rainfall products were grouped into their respective AEZs. After that, the average values of stations that are found in the same AEZs were used following previous studies (Fenta et al. Citation2018; Belay et al. Citation2019; Gashaw et al. Citation2023). The list of stations and their respective AEZs are given in and Supplementary Table 1.
Performance evaluations of CHIRPS v2.0 and MSWEP v2.8 rainfall datasets in this study were carried out using continuous and categorical statistical performance measures as well as Probability Density Function (PDF). In addition to these performance measure statistics, comparison of the studied rainfall products and observed rainfall were made using graphical techniques, such as line graph, scatter plot, and bar graph (Reddy and Saravanan Citation2023). The methodological flows followed for the evaluation of CHIRPS v2.0 and MSWEP v2.8 rainfall products in this study is shown in .
Figure 3. Schematic diagram showing the methodological flows of this study.
2.3.1. Evaluation of rainfall products based on continuous statistical performance measures
Continuous statistical performance measures were calculated to evaluate the performance of CHIRPS v2.0 and MSWEP v2.8 datasets in estimating rainfall at daily, monthly, seasonal, and annual timescales. Evaluations were performed based on mean absolute error (MAE), root mean square error (RMSE), percent bias (PBIAS), correlation coefficient (r) and Kling Gupta efficiency (KGE′) () (Dinku et al. Citation2018; Lemma et al. Citation2019; Peña‐Guerrero et al. Citation2022; Dayal et al. Citation2023; Reddy and Saravanan Citation2023). MAE gives information about the average estimation error while RMSE measures the average magnitude of the deviation of rainfall product from the ground based observed data. The value of MAE and RMSE ranges from 0 to ∞, with a perfect score of 0 (). PBIAS measures the average tendency of rainfall products data to be larger or smaller than the observed data. PBIAS spans from −∞ to ∞, with an ideal value of 0. A low magnitude of PBIAS suggests a better estimation of the rainfall product. Negative and positive PBIAS are an indication of overestimation and underestimation of the satellite/reanalysis rainfall products compared to the observed data, respectively (Gupta et al. Citation1999). Rainfall products are considered a reliable rainfall measurement source where PBIAS values range between −10 and 10% (Dangol et al. Citation2022). The correlation coefficient (r) measures the goodness of fit and linear association between variables. In this case, the linear association is between observed rainfall and satellite/reanalysis rainfall data. The values of r range from −1 to 1, with r values of −1 and 1 indicates a perfect negative and positive score, respectively (). KGE′ is an objective performance metrics combining correlation, bias and variability. The value of KGE′ ranges from −∞ to 1, where the optimum value of KGE′ is 1 (Peña‐Guerrero et al. Citation2022).
Table 2. The list of the considered performance measure statistics used in this study and its best values.
2.3.2. Evaluation of rainfall products based on categorical statistical performance measures
This study employed four categorical scores to determine the rainfall detection capability of the satellite/reanalysis products (rainy and dry days). These categorical scores include Probability of Detection (POD), False Alarm Ratio (FAR), Frequency Bias Index (FBI), and Critical Success Index (CSI) (), which was extracted from a 2 × 2 contingency table (). In the contingency table, the number of hits describes the number of correctly estimated rain events by the satellite/reanalysis rainfall products while false alarm refers to when rain is estimated by the satellite/reanalysis but no rain occurs. Conversely, misses refers to when rain is not estimated by the satellite/reanalysis but the rain occurs, and correct negative refers to the satellite/reanalysis correctly detect the no rain case. This study used rainfall threshold ≥1 mm to detect the rainy days (Nashwan et al. Citation2019; Gashaw et al. Citation2023).
Table 3. The contingency table presenting the agreement between observed records (Po) and satellite/reanalysis rainfall (Ps) for different rainfall intensity ranges (the threshold is ≥1 mm).
POD score is defined as the ability of the satellite/reanalysis products to correctly estimate rain events. POD value ranges from 0 to 1, with 1 being the optimal POD value. On the other hand, FAR measures how often the satellite/reanalysis products detect rainfall that are not confirmed by ground observation. The value of FAR ranges from 0 to 1 with a perfect score of 0. FBI compares the rainy-day detection frequency of satellite/reanalysis products with rain gauge measurements. The value of FBI ranges from 0 to ∞, with an optimal value of 1. FBI < 1 indicates underestimation while FBI values larger than 1 specifies over estimation by the satellite/reanalysis products. CSI is gives a summarized skill measure from POD and FAR (Abebe et al. Citation2020). The value of CSI ranges from 0 to 1 with an optimal value of 1. For detailed descriptions of these categories indices, the readers are suggested to refer preceding studies in this subject of research (Dinku et al. Citation2018; Fenta et al. Citation2018; Abebe et al. Citation2020; Ageet et al. Citation2022; Peña‐Guerrero et al. Citation2022).
2.3.3. Evaluations of rainfall products based on probability density function
This study used the PDF to evaluate the quality of the studied satellite/reanalysis rainfall products in capturing the occurrence probability of rainfall rates at different intensity levels (Jiang et al. Citation2023). For this purpose, the World Meteorological Organization (WMO) rainfall intensity range classification were used. WMO classifies rainfall intensity class as non-rainfall (0–0.1 mm/day), slight rainfall (0.1–1.0 mm/day), thin rainfall (1.0–2.0 mm/day), small rainfall (2.0–5.0 mm/day), light rainfall (5.0–10.0 mm/day), moderate rainfall (10.0–25.0 mm/day), heavy rainfall (25.0–50.0 mm/day), and extreme rainfall (>50.0 mm/day), with the corresponding daily rainfall amount (Jiang et al. Citation2023). The PDF results of CHIRPS v2.0 and MSWEP v2.8 with the observed rainfall intensity were displayed in a line graph for each AEZs of Ethiopia.
3. Results
3.1. Performance of rainfall products based on continuous statistical measures
3.1.1. Performance of rainfall products at annual temporal scale
The performances of CHIRPS v2.0 and MSWEP v2.8 for representing the annual rainfall in the studied AEZs are shown in . The MAE and RMSE values of CHIRPS v2.0 were lower than those of MSWEP v2.8 overall AEZs, indicating its better accuracy. CHIRPS v2.0 is also better than MSWEP v2.8 in all AEZs in terms of achieving better KGE. The performance of CHIRPS v2.0 is also superior in terms of having lower PBIAS in desert, tropical, and alpine AEZs, but MSWEP v2.8 attained better PBIAS than CHIRPS v2.0 in sub-tropical and temperate AEZs. In terms of r, CHIRPS v2.0 attained a better correlation coefficient than MSWEP v2.8 in desert, sub-tropical, temperate, and alpine AEZs, but MSWEP v2.8 achieved an improved correlation coefficient than CHIRPS v2.0 in the tropical AEZ.
Table 4. Performances of CHIRPS v2.0 and MSWEP v2.8 annual rainfall estimates at different AEZs of Ethiopia during 1991–2020.
In terms of the directions of biases of the studied rainfall products, both of them have shown positive PBIAS in the desert, tropical, and sub-tropical AEZs, meaning that they underestimated the annual rainfall. Over temperate AEZ, CHIRPS v2.0 has a positive PBIAS, and MSWEP v2.8 has a negative PBIAS which means that CHIRPS v2.0 underestimates and MSWEP v2.8 overestimates annual rainfall over the temperate AEZ. The two satellite/reanalysis rainfall products have negative PBIAS over alpine AEZ implying that they overestimate the annual rainfall total. The highest underestimation bias was observed over the desert AEZ, with a PBIAS of 15.7% for CHIRPS v2.0 and 18% for MSWEP v2.8. Conversely, the maximum overestimation of annual rainfall total was detected over alpine AEZ with PBIAS of −15.1 and −18.8% for CHIRPS v2.0 and MSWEP v2.8, respectively (). In general, CHIRPS v2.0 has superior performance than MSWEP v2.8 for simulating annual rainfall in all AEZs in the majority/entire of the considered statistical measures.
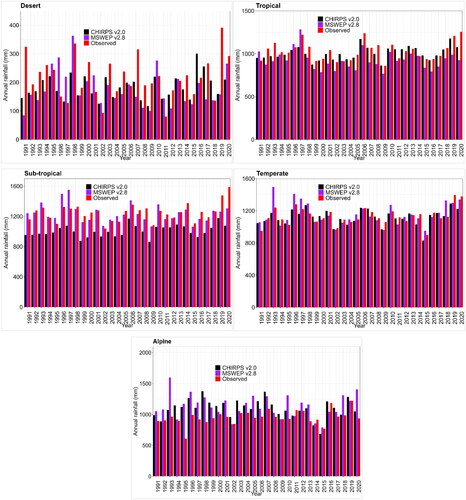
Bar graph representations of the annual rainfall total showed that the two rainfall products are far away from observed over desert and alpine AEZs (). But, over tropical, sub-tropical, and temperate AEZs, the graph of the two studied rainfall products were more or less close to observed. The highest year-to-year performance variation of the two rainfall products was displayed over desert AEZ. Conversely, the least year-to-year performance variation between satellite/reanalysis rainfall products and observed data was observed over temperate AEZ.
Figure 4. The bar graph representation of the observed annual rainfall with MSWEP v2.8 and CHIRPS v2.0 over desert, tropical, sub-tropical, temperate, and alpine AEZs of Ethiopia from 1991 to 2020.
3.1.2. Performance of rainfall products at seasonal scales
The performances of the two studied satellite/reanalysis rainfall products for simulating Belg season rainfall (mm) for the period 1991–2020 over the five AEZs of the country are given in . The results show that CHIRPS v2.0 attained lower MAE and RMSE in all AEZs compared to MSWEP v2.8, indicating the better performance of CHIRPS v2.0 rainfall product. CHIRPS v2.0 is also superior than MSWEP v2.8 in terms of achieving higher r and KGE in all AEZs, except its lower KGE attained in temperate AEZ. CHIRPS v2.0 is also superior in terms of achieving lower PBIAS in sub-tropical, temperate, and alpine AEZs. Conversely, MSWEP v2.8 attained a lower PBIAS in tropical and desert AEZs. In general, CHIRPS v2.0 is better for estimating Belg season rainfall in all AEZs compared to MSWEP v2.8 in majority/entire of the considered statistical metrics ().
Table 5. Statistical continuous metrics analysis comparing seasonal (Belg and Kiremt) CHIRPS v2.0 and MSWEP v2.8 rainfall estimations with ground gauged data of AEZs in Ethiopia from 1991 and 2020.
With regard to the estimation biases of the studied satellite/reanalysis rainfall products, CHIRPS v2.0 exhibited positive PBIAS over the desert, sub-tropical, and temperate AEZs, implying the underestimation of the Belg season rainfall. Whereas, CHIRPS v2.0 attained negative PBIAS over tropical and alpine AEZs, which signifies an overestimation of Belg season rainfall. Conversely, the PBIAS values of MSWEP v2.8 were negative overall AEZs except for tropical AEZ, which implied the overestimation of the Belg season rainfall total in the majority of the AEZs. MSWEP v2.8 only underestimates Belg’s season rainfall total over tropical AEZ. The PBIAS values of MSWEP v2.8 range from −34.3% (over alpine) to 0.1% (over tropical) AEZs while CHIRPS v2.0 PBIAS extends from −31.7 over alpine to 1.3 over temperate AEZs. Therefore, the highest estimation basis of both CHIRPS v2.0 and MSWEP v2.8 products is observed in the alpine AEZ ().
The Kiremt season continuous statistical metrics of the two studied rainfall products are shown in . The finding displayed that CHIRPS v2.0 is better than MSWEP v2.8 for simulating Kiremt season rainfall over the five AEZs of the country in the considered entire performance measures. Concerning the estimations bias directions of the rainfall products, CHIRPS v2.0 underestimates the Kiremt season rainfall total over the desert, sub-tropical, and temperate AEZs, but it overestimates the Kiremt rainfall total over the tropical and alpine AEZs. The PBIAS values of MSWEP v2.8 were positive over the desert, tropical, sub-tropical, and temperate AEZs, indicating that MSWEP v2.8 underestimates the observed Kiremt rainfall. But, MSWEP v2.8 overestimates the Kiremt season rainfall over alpine AEZ. The estimation bias of MSWEP v2.8 ranges from −24.6% (over desert AEZ) to 1.4% (over sub-tropical AEZ) while the highest and lowest PBIAS values of CHIRPS v2.0 is 18.8% (over desert AEZ) and 0.4% (over sub-tropical AEZ), respectively. Hence, both MSWEP v2.8 and CHIRPS v2.0 rainfall products have shown a maximum estimation biases of the observed Kiremt season rainfall over the desert AEZ.
3.1.3. Performance of rainfall products at monthly time scale
shows the scatter plot of the two rainfall products (MSWEP v2.8 and CHIRPS v2.0) against the observed data at the monthly temporal scale over the five AEZs of Ethiopia. The results revealed that the rainfall products agree well with the observed data over all AEZs, except for the desert AEZ, where the rainfall product scatter the values more away from the reference line (dark red color). This indicates a lower performance of the rainfall products in the desert AEZ than in the other AEZs. The continuous statistical performance metrics results revealed that CHIRPS v2.0 is better than MSWEP v2.8 in all the considered continuous statistical measures in the desert, tropical, and alpine AEZs. CHIRPS v2.0 is also better than MSWEP v2.8 in temperate and sub-tropical AEZs in terms of R, MAE, and RMSE, but both of them obtained a similar KGE in these AEZs. Conversely, MSWEP v2.8 is better than CHIPRS v2.0 by achieving a lower PBIAS in the temperate and sub-tropical AEZs (). Therefore, CHIRPS v2.0 has shown superior performance than MSWEP v2.8 for simulating monthly rainfall in all AEZs in the entire/majority of the considered statistical performance measure indices.
Figure 5. Scatterplot of observed monthly rainfall against CHIRPS v2.0 and MSWEP v2.8 over desert, tropical, sub-tropical, temperate, and alpine AEZs of Ethiopia from 1991 to 2020.
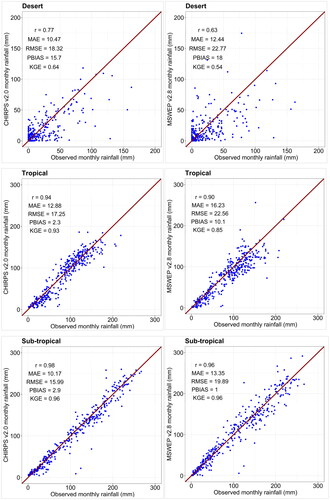
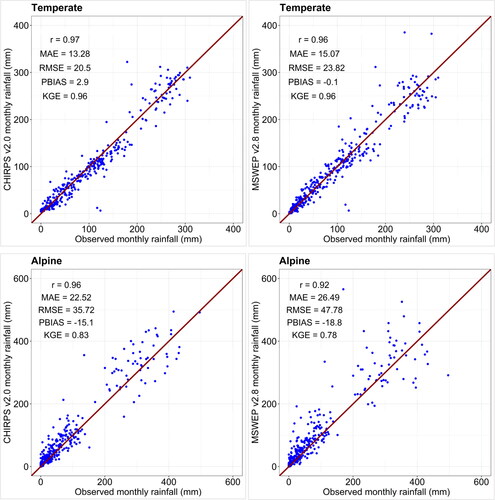
The PBIAS value is positive over desert, tropical, sub-tropical, and temperate AEZs for both rainfall products, except MSWEP v2.8 over temperate AEZ. Thus, this finding indicates that the two rainfall products underestimate monthly rainfall over these AEZs, but MSWEP v2.8 overestimates monthly rainfall over temperate AEZ. Moreover, CHIRPS v2.0 and MSWEP v2.8 overestimate monthly rainfall by 15.1 and 18.8%, respectively over alpine AEZ.
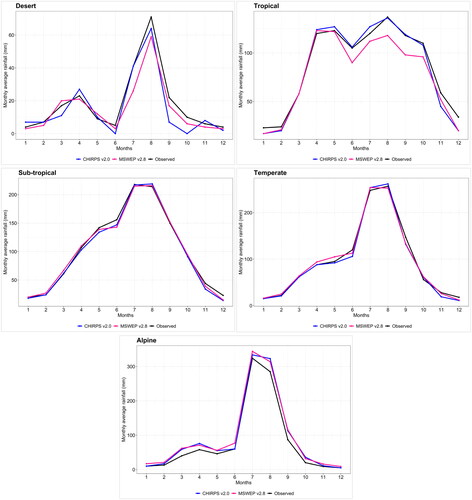
shows the line graph representation of mean monthly rainfall (1991–2020) of CHIRPS v2.0 and MSWEP v2.8. The results revealed that both MSWEP v2.8 and CHIRPS v2.0 detected dry months (October–January) and wet months (both February–May and June–September) rainfall reasonably since the graph of the two rainfall products are closer to the observed line graph. However, comparatively, the performance of MSWEP v2.8 showed low for wet months over desert and tropical AEZs.
Figure 6. Line graph of mean monthly observed rainfall with MSWEP v2.8 and CHIRPS v2.0 rainfall over desert, tropical, sub-tropical, temperate, and alpine AEZs of Ethiopia for the time period 1991–2020.
3.1.4. Performance of rainfall products at daily time step
shows the performance of CHIRPS v2.0 and MSWEP v2.8 for estimating daily rainfall during 1991–2020 periods in the different AEZs of the country. The result displayed that MSWEP v2.8 is superior than CHIRPS v2.0 in terms of achieving lower MAE and RMSE in all AEZs, except attaining identical RMSE in desert AEZ. MSWEP v2.8 is also better than CHIRPS v2.0 in terms of achieving higher r and KGE in all AEZs. Conversely, CHIRPS v2.0 outperforms the MSWEP v2.8 in terms of achieving a lower PBIAS in the desert, tropical, and alpine AEZs, but MSWEP v2.8 attained a smaller PBIAS than CHIRPS v2.0 over the temperate and sub-tropical AEZs. According to the results, we conclude that MSWEP v2.8 performs better than CHIRPS v2.0 in detecting daily rainfall by most/entire continuous statistical indices across all AEZs of Ethiopia.
Table 6. Comparing daily rainfall estimates of CHIRPS v2.0 and MSWEP v2.8 with observed rainfall data over the five AEZs of Ethiopia during1991–2020 periods.
Concerning the direction of estimation biases, both rainfall products have positive PBIAS values over the desert, tropical, and sub-tropical AEZs, indicating underestimation of daily rainfall by these rainfall products. There were positive PBIAS values for CHIRPS v2.0 and negative PBIAS values for MSWEP v2.8 over temperate AEZ. The value implied that CHIRPS v2.0 underestimated and MSWEP v2.8 overestimated daily rainfall over temperate AEZ. The two rainfall products have a negative PBIAS over alpine AEZ, which means that the two rainfall products overestimate daily rainfall over alpine AEZ.
3.2. Performance of rainfall products based on categorical statistical measures
The daily rainfall detection skills of CHIRPS v2.0 and MSWEP v2.8 over the five AEZs of Ethiopia is shown in . The result revealed that the studied rainfall products have a good rainfall detection skills over tropical, sub-tropical, temperate, and alpine AEZs of the country with POD values >0.59 which means that both products can detect more than 59% of the rainfall events over those AEZs. However, CHIRPS v2.0 and MSWEP v2.8 missed around 74 and 70% rainfall events over desert AEZ, respectively. The two rainfall products have the highest POD over sub-tropical AEZ with a value of 0.95 for CHIRPS v2.0 and 0.94 for MSWEP v2.8, which means that the two satellite/reanalysis rainfall products correctly detect 95 and 94% of the observed rainfall events, respectively. FAR value, which is the problem of detecting rainfall by the rainfall products when there was no rainfall, showed that around 54 and 49% of the estimated rainy days by CHIRPS v2.0 and MSWEP v2.8, respectively were falsely estimated over desert AEZ. In addition, about 45% of the rainfall days over the alpine AEZ is false estimated by CHIRPS v2.0. However, the FAR values of both CHIRPS v2.0 and MSWEP v2.8 over temperate, sub-tropical, and tropical AEZs are lower than 0.22.
Table 7. Detection skill scores of daily rainfall (threshold ≥ 1 mm) estimates of CHIRPS v2.0 and MSWEP v2.8 satellite/reanalysis rainfall estimates for Ethiopian AEZs during 1991–2020.
The FBI values of the studied rainfall products over temperate, sub-tropical, and tropical AEZs are above 0.93. CHIRPS v2.0 was also achieved a higher FBI values over the alpine AEZ. Comparatively, both of these rainfall products recorded lower FBI values in the desert AEZ, indicating the relatively poor performance of those products in this AEZ. FBI values of CHIRPS v2.0 were >1 over tropical, sub-tropical, temperate, and alpine AEZs, which shows a slight overestimation. CHIRPS v2.0 has an FBI value of 0.57 over desert AEZ, which means an underestimation of observed rainy day events. Conversely, MSWEP v2.8 underestimates the number of observed rainy day events over desert, tropical, temperate, and alpine AEZs. But, MSWEP v2.8 overestimates the number of observed rainy day events over sub-tropical AEZ. CSI value, which showed that the overall correspondence between the studied rainfall products and the observed rainfall occurrence events, was unsatisfactory over desert AEZs with a CSI value <0.5. But, over other AEZs, except CHIRPS v2.0 over alpine AEZ with a CSI value of 0.41, CSI values were >0.50 with the highest value of CSI recorded over sub-tropical AEZ for CHIRPS v2.0 and MSWEP v2.8 with a value of 0.82 and 0.86, respectively. In general, the performance of MSWEP v2.8 is superior than CHIRPS v2.0 over temperate, sub-tropical, tropical, and desert AEZs of Ethiopia by most/entire categorical performance measures, but both of them achieved comparable performance in the alpine AEZ.
3.3. Performance of rainfall products based on probability density function
compares the daily rainfall intensity classes of observed, CHIRPS v2.0, and MSWEP v2.8 data during 1991–2020 periods across five AEZs of Ethiopia. As mentioned in the methods part, the daily rainfall intensity classes were categorized into eight classes. The result showed that the frequency of non-rainfall (0–0.1 mm/day) intensity class was higher than other classes for the two rainfall products and the observed rainfall in all AEZs, except the case reported for MSWEP v2.8 in temperate AEZ. In temperate AEZ, the rainfall intensity classes of small rainfall (2.0–5.0 mm/day), slight rainfall (0.1–1.0 mm/day), and light rainfall (5.0–10 mm/day) daily rainfall intensity classes of MSWEP v2.8 accounted the highest coverage, which are representing 22.2, 21.8, and 20.8%, respectively. Moreover, the non-rainfall intensity class had the highest frequency in the desert AEZ than in other AEZs. For example, from 10,958 daily rainfall data during the period 1991–2020 periods, the observed rainfall frequency for non-rainfall class was 94% in the desert AEZ, while it was between 29.6 and 69% in other AEZs. Similarly, CHIRPS v2.0 had a frequency of 82% for this class in the desert AEZ and between 30.5 and 71.3% in the rest of the AEZs. MSWEP v2.8 had a frequency of 73% for this class in the desert AEZ and between 19.3 and 41% in the rest of the AEZs.
Figure 7. The PDF daily rainfall events of CHIRPS v2.0 and MSWEP v2.8 products against observed data at different intensity levels over desert, tropical, sub-tropical, temperate, and alpine AEZs of Ethiopia during 1991–2020 periods.
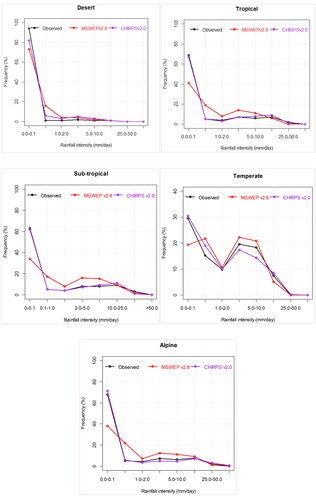
In general, from the PDF graph, the frequency of non-rainfall class was much higher than other classes across all AEZs of Ethiopia, except MSWEP v2.8 in temperate AEZ. Moreover, the MSWEP v2.8 and CHIRPS v2.0 frequency was lower than this class’s observed frequency, except CHIRPS v2.0 in temperate and alpine AEZs where the frequency of CHIRPS v2.0 is higher than the observed and MSWEP v2.8. CHIRPS v2.0 frequency of 0–0.1(mm/day) intensity class was closer/identical to the observed frequency, particularly in tropical, sub-tropical, and alpine AEZs. In general, the findings of this study indicated that the rainfall intensity detection skills of CHIRPS v2.0 are better than MSWEP v2.8 over the five studied AEZs in the majority of the rainfall intensity classes ().
4. Discussions
The better performance of CHIRPS v2.0 for simulating annual rainfall over the five AEZs of Ethiopia by entire/majority performance measure metrics in this study is aligned with the findings obtained in East Africa, who reported the superior performance of CHIRPS v2.0 for simulating annual rainfall (Ageet et al. Citation2022). In addition, Valencia et al. (Citation2023) also reported that CHIRPS v2.0 outperforms than MSWEP v2.8 for simulating annual rainfall over different elevation zones of Colombia (North Western South America). In contrast, a study undertaken in the Bale Eco-Region (Southern Ethiopia) reported the better performance of MSWEP v2.8 compared with CHIRPS v2.0 for estimating annual rainfall in the temperate, sub-tropical and tropical AEZs (Gashaw et al. Citation2023).
Our finding displayed the better performance of CHIRPS v2.0 for simulating Belg season (February-May) rainfall in all AEZs by most/entire performance measures statistics. CHIRPS v2.0 has also shown superior performance than MSWEP v2.8 for simulating Kiremt season (June-September) rainfall over the five AEZs by the whole performance statistics. Aligned with this finding, CHIRPS v2.0 has also shown improved performance than MSWEP v2.8 for simulating Kiremt (wet season) rainfall in temperate and tropical AEZs of the Bale Eco-Region, but MSWEP v2.8 outperforms CHIRPS v2.0 over the sub-tropical AEZ (Gashaw et al. Citation2023).
The superior performance of CHIRPS v2.0 at monthly temporal scale compared to MSWEP v2.8 in this study corresponds with Gashaw et al. (Citation2023) finding in the Bale Eco-Region (Southern Ethiopia), which revealed the improved performance CHIRPS v2.0 than MSWEP v2.8 in temperate, sub-tropical and tropical AEZs. The better performance of CHIRPS v2.0 compared to MSWEP v2.8 for estimating the monthly rainfall is also reported by Ageet et al. (Citation2022) for Equatorial East Africa. The superior performance of CHIRPS v2.0 compared to MSWEP v2.8 is also reported in Columbia, Northwestern South America (Valencia et al. Citation2023). The rainfall amount estimated by CHIRPS v2.0 at the monthly temporal scale becomes increasingly precise and closer to observed. Likewise, the better performance of CHIRPS v2.0 at the monthly scale compared to the annual timestep is also reported in another study in Ethiopia (Gashaw et al. Citation2023).
On daily basis, our finding indicated the better performance of MSWEP v2.8 than CHIRPS v2.0 in the five studied AEZs by entire/most performance measure statistics. This may be due to the fact that the MSWEP v2.8 dataset considers daily gauge data in the product generation process (Funk et al. Citation2019). The results of this study is also aligned with the findings obtained in the Bale Eco-Region in Southern Ethiopia (Gashaw et al. Citation2023). Dangol et al. (Citation2022) also found the superior performance of MSWEP v2.8 than CHIRPS v2.0 over the Arun River Basin (Nepal). In contrast, a study in the Equatorial East Africa indicated the superior performance of CHIRPS v2.0 than MSWEP v2.8 for simulating daily rainfall (Ageet et al. Citation2022). Of the considered temporal scales in this study, the performance of both rainfall products is comparatively lower at the daily timestep. This could be due to the difficulties in capturing variabilities at high temporal scales (Abebe et al. Citation2020). Reading this, Dinku et al. (Citation2018) described that the daily rainfall product is more vulnerable to errors due to the ability of satellite/reanalysis rainfall products generally not favorable on the daily timescale over complex terrain (Dinku et al. Citation2018).
The finding of our study also indicated that both of the rainfall products have overestimation problem over the alpine AEZ from daily to annual temporal scales. On the other hand, CHIRPS v2.0 have shown underestimation problem over the remining four AEZs from the daily to annual temporal scales, except its overestimation in the Belg and Kiremt seasons in tropical AEZ. Aligned with this study, underestimation of CHIRPS v2.0 at the monthly temporal scale was also reported for the lowlands (<1500 m a.s.l) and highlands (>1500 m a.s.l) parts of the Lake Tana sub-basin (Ethiopia). In contrast to our finding, CHIRPS v2.0 underestimated the Kiremt season rainfall over the highland and lowland parts of the Lake Tana sub-basin (Fenta et al. Citation2018). Our finding also indicated that MSWEP v2.8 overestimated rainfall over temperate AEZ in all studied temporal scales (daily to annual), except in Kiremt season which exhibited underestimation bias. Conversely, MSWEP v2.8 overestimated Kiremt rainfall over temperate AEZ in the Bale Eco-Region (Gashaw et al. Citation2023). In sub-tropical, tropical, and desert AEZs, however, MSWEP v2.8 underestimated rainfall at daily, monthly, and annual temporal scales. On a seasonal basis, MSWEP v2.8 overestimated and underestimated Belg and Kiremt rainfall, respectively both in sub-tropical and desert AEZs, but it underestimated rainfall in these seasons over tropical AEZ.
The performance of the studied rainfall products varies considerably from place to place. This may be due to Ethiopia’s complex topography and climate (Dinku et al. Citation2011, Citation2018). Aligned with this result, previous studies undertaken in Lake Tana sub-basin (Fenta et al. Citation2018) and Belese sub-basin (Belay et al. Citation2019) also reported the performance difference of CHIRPS v2.0 rainfall estimates over the highland and lowland areas. In addition, Gashaw et al. (Citation2023) also indicated performance variations of CHIRPS v2.0 and MSWEP v2.8 over the AEZs of the Bale Eco-Region. The findings also clearly indicated the poor performance of both of the rainfall products over the desert AEZ compared to the remaining AEZs.
Considering all categorical performance measures (POD, FAR, FBI, and CSI), MSWEP v2.8 is better than CHIRPS v2.0 over temperate, sub-tropical, tropical, and desert AEZs by most/entire metrics, but both MSWEP v2.8 and CHIRPS v2.0 attained comparable performance over the alpine AEZ. Regarding the specific indices, MSWEP v2.8 is superior than CHIRPS v2.0 in POD over desert and tropical AEZs, but CHIRPS v2.0 outperforms MSWEP v2.8 over the sub-tropical, temperate, and alpine AEZs. In terms of FAR, FBI, and CSI, MSWEP v2.8 is superior than CHIRPS v2.0 over the desert, tropical, sub-tropical, and temperate AEZs. Similarly, MSWEP v2.8 was achieved better POD and FBI than CHIRPS v2.0 over temperate, sub-tropical, and tropical AEZs of the Bale Eco-Region (Gashaw et al. Citation2023). However, CHIRPS v2.0 is better in terms of FAR in the Bale Eco-Region (Gashaw et al. Citation2023). A study by Ageet et al. (Citation2022) also showed the good performance of MSWEP v2.8 to detect rainfall occurrence over Equatorial East Africa.
Regarding the eight daily rainfall intensity classes, CHIRPS v2.0 performed better than MSWEP v2.8 for the majority of the intensity classes. A study over the upper Tana River basin also found that CHIRPS v2.0 has reliable performance at reproducing the occurrence frequency of daily events for different intensity ranges for the period 2007 to 2016 (Polong et al. Citation2023).
4. Conclusions
This study evaluated performances of CHIRPS v2.0 and MSWEP v2.8 rainfall estimates with observed rainfall data during 1991–2020 periods over the five AEZs of Ethiopia from daily to annual temporal scales. The findings revealed the superior performance of CHIRPS v2.0 compared to MSWEP v2.8 for estimating monthly, Belg season, Kiremt season, and annual rainfall over the five AEZs of the country by most/entire performance measure statistics (). On daily basis, however, the performance of MSWEP v2.8 outperforms the CHIRPS v2.0 estimates over all AEZs of Ethiopia by the entire/majority of the performance measure metrics. Concerning the detection capability of daily rainfall occurrence, the performance of MSWEP v2.8 is also superior than CHIRPS v2.0 over temperate, sub-tropical, tropical, and desert AEZs of Ethiopia by most/entire categorical performance measures, but both of them achieved comparable performance in the alpine AEZ. However, different rainfall intensity classes were better captured by CHIRPS v2.0 than MSWEP v2.8 overall AEZs by the majority of the intensity classes (). The study found the low performances of both rainfall products over the desert AEZ of the country compared to the remining AEZs. Therefore, employing MSWEP v2.8 for monthly, Belg season, Kiremt season, and annul temporal scale applications may contain higher uncertainties on the outputs compared to studies undertaken using CHIRPS v2.0 rainfall dataset. Likewise, using either of these rainfall products in the desert AEZ for any applications may provide results far from the actual conditions.
Table 8. Summary of overall performance of CHIRPS v2.0 and MSWEP v2.8 for simulating rainfall from daily to annual temporal scales over the five AEZs of Ethiopia in the majority/entire performance measure statistics.
Therefore, for both grid-based and station wise national level studies, we recommend CHIRPS v2.0 for monthly, Belg season, Kiremt season, and annual temporal scales and MSWEP v2.8 for daily time step studies. The findings of the study will be important for data developers of both rainfall products to improve the algorithms used and/or the numbers of stations used for producing the data in desert AEZ in particular and the remaining AEZs in general.
In this study, CHIRPS v2.0 is better than MSWEP v2.8 for estimating annual rainfall over the five AEZs of the country. Conversely, Gashaw et al. (Citation2023) reported the better performance of MSWEP v2.8 for estimating annual rainfall in temperate, sub-tropical, and tropical AEZs of the Bale Eco-Region compared to CHIRPS v2.0. On the other hand, MSWEP v2.2, which is the earlier version of MSWEP v2.8, outperforms both CHIRPS v2.0 and MSWEP v2.8 for estimating annual rainfall over Equatorial East Africa (Ageet et al. Citation2022). Therefore, this study recommends further studies on the following research areas: (1) evaluations of CHIRPS v2.0, MSWEP v2.1, and MSWEP v2.8 under hydrological models, and (2) evaluations of CHIRPS v2.0, MSWEP v2.1 and MSWEP v2.8 for simulating rainfall extremes and varying types of droughts over different AEZs at daily to annual temporal scales. Furthermore, since this study evaluated rainfall products only with a point-to-pixel approach that is attributed to the small number and sparsely distributed stations, which is the limitations of this study, we recommend grid-to-grid evaluations of these rainfall products in watershed/sub-basins where relatively higher numbers of stations are existed.
Supplemental Material
Download ()Acknowledgements
The authors acknowledge the Ethiopian Meteorology Institute (EMI) for supplying the long term observed rainfall data. We are also grateful to the producers of CHIRPS v2.0 and MSWEP v2.8 datasets for making the information available without charge. The authors are also grateful to the editor of the journal and the three anonymous reviewers for providing us constructive comments, which has improved the quality of the paper. The timely decision made by the editor of the journal is also highly appreciated.
Disclosure statement
No potential conflict of interest was reported by the author(s).
References
- Abebe SA, Qin T, Yan D, Gelaw EB, Workneh HT, Kun W, Liu S, Dong B. 2020. Spatial and temporal evaluation of the latest high-resolution precipitation products over the upper blue Nile river basin, Ethiopia. Water. 12(11):3072. doi: 10.3390/w12113072.
- Abraham T, Liu Y, Tekleab S, Hartmann A. 2022. Prediction at ungauged catchments through parameter optimization and uncertainty estimation to quantify the regional water balance of the Ethiopian rift valley lake basin. Hydrology. 9(8):150. doi: 10.3390/hydrology9080150.
- Ageet S, Fink AH, Maranan M, Diem JE, Hartter J, Ssali AL, Ayabagabo P. 2022. Validation of satellite rainfall estimates over equatorial East Africa. J Hydrometeorol. 23(2):129–151. doi: 10.1175/JHM-D-21-0145.1.
- Aksu H, Akgül MA. 2020. Performance evaluation of chirps satellite precipitation estimates over turkey. Theor Appl Climatol. 142(1–2):71–84. doi: 10.1007/s00704-020-03301-5.
- Andualem TG, Malede DA, Ejigu MT. 2020. Performance evaluation of integrated multi-satellite retrieval for global precipitation measurement products over Gilgel Abay watershed, Upper Blue Nile Basin, Ethiopia. Model Earth Syst Environ. 6(3):1853–1861. doi: 10.1007/s40808-020-00795-w.
- Awange JL, Hu KX, Khaki M. 2019. The newly merged satellite remotely sensed, gauge and reanalysis-based multi-source weighted-ensemble precipitation: evaluation over Australia and Africa (1981–2016). Sci Total Environ. 670:448–465. doi: 10.1016/j.scitotenv.2019.03.148.
- Ayehu GT, Tadesse T, Gessesse B, Dinku T. 2018. Validation of new satellite rainfall products over the Upper Blue Nile Basin, Ethiopia. Atmos Meas Tech. 11(4):1921–1936. doi: 10.5194/amt-11-1921-2018.
- Bathelemy R, Brigode P, Boisson D, Tric E. 2022. Rainfall in the greater and lesser antilles: performance of five gridded datasets on a daily timescale. J Hydrol Reg Stud. 43:101203. doi: 10.1016/j.ejrh.2022.101203.
- Beck HE, Wood EF, Pan M, Fisher CK, Miralles DG, Van Dijk AIJM, Mcvicar TR, Adler RF. 2019. Mswep v2 global 3-hourly 0.1° precipitation: methodology and quantitative assessment. Bull Am Meteorol Soc. 100(3):473–500. doi: 10.1175/BAMS-D-17-0138.1.
- Belay AS, Fenta AA, Yenehun A, Nigate F, Tilahun SA, Moges MM, Dessie M, Adgo E, Nyssen J, Chen M, et al. 2019. Evaluation and application of multi-source satellite rainfall product chirps to assess spatio-temporal rainfall variability on data-sparse western margins of Ethiopian highlands. Remote Sensing. 11(22):2688. doi: 10.3390/rs11222688.
- Belete M, Deng J, Wang K, Zhou M, Zhu E, Shifaw E, Bayissa Y. 2020. Evaluation of satellite rainfall products for modeling water yield over the source region of blue Nile basin. Sci Total Environ. 708:134834. doi: 10.1016/j.scitotenv.2019.134834.
- Beyene TD, Zimale FA, Gebrekristos ST, Nedaw D. 2023. Evaluation of a multi-staged bias correction approach on chirp and chirps rainfall product: a case study of the Lake Hawassa watershed. J Water Clim Change. 14(6):1847–1867. doi: 10.2166/wcc.2023.457.
- Cavalcante RBL, Ferreira DBDS, Pontes PRM, Tedeschi RG, Da Costa CPW, De Souza EB. 2020. Evaluation of extreme rainfall indices from chirps precipitation estimates over the Brazilian Amazonia. Atmos Res. 238:104879. doi: 10.1016/j.atmosres.2020.104879.
- Cheung WH, Senay GB, Singh A. 2008. Trends and spatial distribution of annual and seasonal rainfall in Ethiopia. Int J Climatol. 28(13):1723–1734. doi: 10.1002/joc.1623.
- Dangol S, Talchabhadel R, Pandey VP. 2022. Performance evaluation and bias correction of gridded precipitation products over Arun river basin in Nepal for hydrological applications. Theor Appl Climatol. 148(3–4):1353–1372. doi: 10.1007/s00704-022-04001-y.
- Dayal D, Pandey A, Gupta PK, Himanshu SK. 2023. Multi-criteria evaluation of satellite-based precipitation estimates over agro-climatic zones of India. Atmos Res. 292:106879. doi: 10.1016/j.atmosres.2023.106879.
- Degefu MA, Bewket W. 2023. Drought monitoring performance of global precipitation products in three wet seasons in Ethiopia: part I—quasi‐objective examination. Meteorol Appl. 30(4):e2143. doi: 10.1002/met.2143.
- Degefu MA, Bewket W, Amha Y. 2022. Evaluating performance of 20 global and quasi-global precipitation products in representing drought events in Ethiopia I: visual and correlation analysis. Weather Clim Extremes. 35:100416. doi: 10.1016/j.wace.2022.100416.
- Dinku T, Ceccato P, Connor SJ. 2011. Challenges of satellite rainfall estimation over mountainous and arid parts of East Africa. Int J Rem Sens. 32(21):5965–5979. doi: 10.1080/01431161.2010.499381.
- Dinku T, Ceccato P, Grover‐Kopec E, Lemma M, Connor SJ, Ropelewski CF. 2007. Validation of satellite rainfall products over East Africa’s complex topography. Int J Rem Sens. 28(7):1503–1526. doi: 10.1080/01431160600954688.
- Dinku T, Funk C, Peterson P, Maidment R, Tadesse T, Gadain H, Ceccato P. 2018. Validation of the chirps satellite rainfall estimates over Eastern Africa. Q J R Meteorol Soc. 144(S1):292–312. doi: 10.1002/qj.3244.
- Diro GT, Grimes DIF, Black E, O'neill A, Pardo-Iguzquiza E. 2009. Evaluation of reanalysis rainfall estimates over Ethiopia. Int J Climatol. 29(1):67–78. doi: 10.1002/joc.1699.
- Fenta AA, Yasuda H, Shimizu K, Ibaraki Y, Haregeweyn N, Kawai T, Belay AS, Sultan D, Ebabu K. 2018. Evaluation of satellite rainfall estimates over the lake tana basin at the source region of the blue Nile river. Atmos Res. 212:43–53. doi: 10.1016/j.atmosres.2018.05.009.
- Funk C, Peterson P, Landsfeld M, Pedreros D, Verdin J, Shukla S, Husak G, Rowland J, Harrison L, Hoell A, et al. 2015. The climate hazards infrared precipitation with stations–a new environmental record for monitoring extremes. Sci Data. 2(1):150066. doi: 10.1038/sdata.2015.66.
- Funk C, Peterson P, Peterson S, Shukla S, Davenport F, Michaelsen J, Knapp KR, Landsfeld M, Husak G, Harrison L, et al. 2019. A high-resolution 1983–2016 tmax climate data record based on infrared temperatures and stations by the climate hazard center. J Clim. 32(17):5639–5658. doi: 10.1175/JCLI-D-18-0698.1.
- Gashaw T, W. Worqlul A, Lakew H, Teferi Taye M, Seid A, Haileslassie A. 2023. Evaluations of satellite/reanalysis rainfall and temperature products in the bale eco-region (southern Ethiopia) to enhance the quality of input data for hydro-climate studies. Rem Sens Appl Soc Environ. 31:100994. doi: 10.1016/j.rsase.2023.100994.
- Guo B, Xu T, Yang Q, Zhang J, Dai Z, Deng Y, Zou J. 2023. Multiple spatial and temporal scales evaluation of eight satellite precipitation products in a mountainous catchment of south China. Rem Sens. 15(5):1373. doi: 10.3390/rs15051373.
- Gupta HV, Sorooshian S, Yapo PO. 1999. Status of automatic calibration for hydrologic models: comparison with multilevel expert calibration. J Hydrol Eng. 4(2):135–143. doi: 10.1061/(ASCE)1084-0699(1999)4:2(135).
- Hafizi H, Sorman AA. 2022. Assessment of 13 gridded precipitation datasets for hydrological modeling in a mountainous basin. Atmosphere. 13(1):143. doi: 10.3390/atmos13010143.
- Hailu BT, Fekadu M, Nauss T. 2018. Availability of global and national scale land cover products and their accuracy in mountainous areas of Ethiopia: a review. J Appl Rem Sens. 12(4):1. doi: 10.1117/1.JRS.12.041502.
- Jiang S-H, Wei L-Y, Ren L-L, Zhang L-Q, Wang M-H, Cui H. 2023. Evaluation of IMERG, TMPA, ERA5, and CPC precipitation products over mainland China: spatiotemporal patterns and extremes. Water Sci Eng. 16(1):45–56. doi: 10.1016/j.wse.2022.05.001.
- Kouakou C, Paturel J-E, Satgé F, Tramblay Y, Defrance D, Rouché N. 2023. Comparison of gridded precipitation estimates for regional hydrological modeling in West and Central Africa. J Hydrol Reg Stud. 47:101409. doi: 10.1016/j.ejrh.2023.101409.
- Lakew HB. 2020. Investigating the effectiveness of bias correction and merging MSWEP with gauged rainfall for the hydrological simulation of the Upper Blue Nile Basin. J Hydrol Reg Stud. 32:100741. doi: 10.1016/j.ejrh.2020.100741.
- Lemma E, Upadhyaya S, Ramsankaran R. 2019. Investigating the performance of satellite and reanalysis rainfall products at monthly timescales across different rainfall regimes of Ethiopia. Int J Rem Sens. 40(10):4019–4042. doi: 10.1080/01431161.2018.1558373.
- Li M, Lv X, Zhu L, Uchenna Ochege F, Guo H. 2022. Evaluation and application of MSWEP in drought monitoring in central Asia. Atmosphere. 13(7):1053. doi: 10.3390/atmos13071053.
- Liu C-Y, Aryastana P, Liu G-R, Huang W-R. 2020. Assessment of satellite precipitation product estimates over Bali island. Atmos Res. 244:105032. doi: 10.1016/j.atmosres.2020.105032.
- Malede DA, Agumassie TA, Kosgei JR, Pham QB, Andualem TG. 2022. Evaluation of satellite rainfall estimates in a rugged topographical basin over South Gojjam Basin, Ethiopia. J Indian Soc Rem Sens. 50(7):1333–1346. doi: 10.1007/s12524-022-01530-x.
- Mekasha A, Tesfaye K, Duncan AJ. 2014. Trends in daily observed temperature and precipitation extremes over three Ethiopian eco-environments. Int J Climatol. 34(6):1990–1999. doi: 10.1002/joc.3816.
- MOA. 1998. Agro-ecological zones of ethiopia. Natural Resources Management and Regulatory Department. With support of German Agency for Technical Cooperation (GTZ).
- Mohammed JA, Gashaw T, Worku Tefera G, Dile YT, Worqlul AW, Addisu S. 2022. Changes in observed rainfall and temperature extremes in the Upper Blue Nile Basin of Ethiopia. Weather Clim Extremes. 37:100468. doi: 10.1016/j.wace.2022.100468.
- Nashwan MS, Shahid S, Wang X. 2019. Assessment of satellite-based precipitation measurement products over the hot desert climate of Egypt. Rem Sens. 11(5):555. doi: 10.3390/rs11050555.
- Paredes-Trejo FJ, Barbosa HA, Lakshmi Kumar TV. 2017. Validating chirps-based satellite precipitation estimates in northeast Brazil. J Arid Environ. 139:26–40. doi: 10.1016/j.jaridenv.2016.12.009.
- Peña‐Guerrero MD, Umirbekov A, Tarasova L, Müller D. 2022. Comparing the performance of high‐resolution global precipitation products across topographic and climatic gradients of central Asia. Int J Climatol. 42(11):5554–5569. doi: 10.1002/joc.7548.
- Polong F, Pham QB, Anh DT, Rahman KU, Shahid M, Alharbi RS. 2023. Evaluation and comparison of four satellite-based precipitation products over the Upper Tana River Basin. Int J Environ Sci Technol. 20(1):843–858. doi: 10.1007/s13762-022-03942-1.
- Randriatsara HHRH, Hu Z, Xu X, Ayugi B, Sian K, Mumo R, Ongoma V. 2022. Evaluation of gridded precipitation datasets over Madagascar. Int J Climatol. 42(13):7028–7046. doi: 10.1002/joc.7628.
- Reddy NM, Saravanan S. 2023. Evaluation of the accuracy of seven gridded satellite precipitation products over the Godavari River Basin, India. Int J Environ Sci Technol. 20(9):10179–10204. doi: 10.1007/s13762-022-04524-x.
- Tadesse KE, Melesse AM, Abebe A, Lakew HB, Paron P. 2022. Evaluation of global precipitation products over Wabi Shebelle River Basin, Ethiopia. Hydrology. 9(5):66. doi: 10.3390/hydrology9050066.
- Valencia S, Marín DE, Gómez D, Hoyos N, Salazar JF, Villegas JC. 2023. Spatio-temporal assessment of gridded precipitation products across topographic and climatic gradients in Colombia. Atmos Res. 285:106643. doi: 10.1016/j.atmosres.2023.106643.
- Wedajo GK, Muleta MK, Awoke BG. 2021. Performance evaluation of multiple satellite rainfall products for Dhidhessa River Basin (DRB), Ethiopia. Atmos Meas Tech. 14(3):2299–2316. doi: 10.5194/amt-14-2299-2021.
- Wiwoho BS, Astuti IS, Alfarizi I, Sucahyo HR. 2021. Validation of three daily satellite rainfall products in a humid tropic watershed, Brantas, Indonesia: implications to land characteristics and hydrological modelling. Hydrology. 8(4):154. doi: 10.3390/hydrology8040154.
- WMO. 2009. Guidelines on analysis of extremes in a changing climate in support of informed decisions for adaptation 55.
- Wubaye GB, Gashaw T, Worqlul AW, Dile YT, Taye MT, Haileslassie A, Zaitchik B, Birhan DA, Adgo E, Mohammed JA, et al. 2023. Trends in rainfall and temperature extremes in Ethiopia: station and agro-ecological zone levels of analysis. Atmosphere. 14(3):483. doi: 10.3390/atmos14030483.
- Zhang X, Yang F. 2004. Rclimdex (1.0) user manual 23. Climate Research Branch Environment Canada; p. 22.