
Abstract
The use of drones and remote sensing in combination with geospatial analysis is a cost-efficient way to monitor energy distribution networks, especially those in fire-prone areas. This study investigated the use of image and photogrammetric analysis together with segmentation algorithms to assess vegetation height and volume in power line corridors in Southeast Queensland, Australia. Various fuel reduction techniques, including mega-mulching, spot sprays and cool mosaic burns, were implemented, and drone-generated models were employed to evaluate their effectiveness. The fuel hazard reduction and regrowth in terms of vegetation height and volume were recorded and analysed. Importantly, the study demonstrates a robust correlation (R2 = 0.9073; df = 1,16; F = 156; p < .001) between field observations and drone-derived models, affirming the efficacy of this method in assessing fuel heights. This validation suggests that the approach could represent a viable, cost-efficient option for future monitoring and management of energy distribution networks in fire-prone areas.
Introduction
Wildfires, commonly referred to as bushfires in Australia (Thorley et al. Citation2023) are a natural phenomenon due to the vegetation, climate and topographic conditions existing over substantial portions of the Australian continent (McGee and Russell Citation2003; Srivastava et al. Citation2021; Ross et al. Citation2023). Changes in global climate have increased the probability of extreme weather conditions, thereby increasing the likelihood of both more bushfires and fires of higher intensity (Abatzoglou and Williams Citation2016).
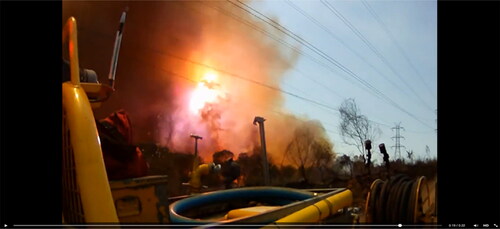
A consistent and dependable supply of electricity is vital for the effective function of a modern society dependent upon the provision of private and government services, and the energy requirements of industry and the general population (Rinaldi et al. Citation2001; Zhou et al. Citation2019). Bushfires near electrical and transmission installations can lead to direct damage to the towers, lines and associated distribution infrastructure (Sfetsos et al. Citation2021), interrupting the continuity of supply. Consequently, an important component of maintaining this reliability of supply is the effective management of power line corridors (Chang et al. Citation2007), where damage can originate from two main processes: ignition induced from vegetation-transmission lines contact and second, from surrounding fires, which either directly affect infrastructure or from smoke and ash ionizing the air gap between the vegetation and the transmission lines, causing an arcing pathway ().
Figure 1. Screenshot of a video provided by Ripley Valley Rural Fire Brigade from a flare-induced outage in Southeast Queensland (Source: Ripley Valley Rural Fire Brigade, 2013).
Traditionally, the monitoring of vegetation in and around power line corridors has relied on visual assessments of various metrics. These include assessments of vegetation density, canopy height from the ground, height from the canopy to the lowest catenary point and the horizontal distance from the outermost transmission lines to the edge of the corridor’s vegetation (Flood Citation2011; Matikainen et al. Citation2016). The accuracy of these ground-based surveys is dependent on the skills and experience of the personnel involved and the precision of measuring equipment (Wang et al. Citation2019). While these land-based surveys remain integral, they are inherently labour-intensive, and thus, costly. In comparison, aerial-based surveys, often conducted using helicopters or light aircraft, have sought to alleviate some of these challenges (Luque-Vega et al. Citation2014).
The advent of remote sensing technologies, including satellite imagery, airborne LiDAR and Unmanned Aerial Vehicle (UAV) photogrammetry, has revolutionized the landscape of natural resource management, environmental assessment and infrastructure monitoring. This technological progress extends to the evaluation of vegetation in power line corridors, where UAV-based photogrammetry has emerged as a particularly promising tool (Srivastava et al. Citation2013, Citation2021; Parker et al. Citation2015; Penglase et al. Citation2023). This technology leverages advances in drone capabilities and photogrammetry techniques to capture extensive imagery from multiple angles One such photogrammetric technique, ‘Structure from Motion’ (SfM) is used to generate low-cost, three-dimensional models using computer software capable of using a series of overlapping photographs taken of a target area at different angles by a UAV-mounted camera, resulting in a cohesive, digital 3D image of the area (Eltner and Sofia Citation2020). For vegetation studies, SfM modelling creates products such as orthomosaic and digital surface models (DSM). This enables the derivation of canopy height models (CHM) from DSMs, providing three-dimensional information about vegetation at the given site. The vegetation can also be classified using the red, green and blue components of the orthomosiac image.
Studies have investigated the use of remotely sensed data to map electrical infrastructure and associated fire risk. Munir et al. (Citation2019) conducted a field trial and subsequent study in Victoria and Queensland, using airborne LiDAR to map electrical network infrastructure and the surrounding vegetation, focusing on extracting power line pylons and lines at varying altitudes. Huang et al. (Citation2021) introduce an efficient dense matching approach for the 3D reconstruction of high-voltage transmission corridors with fine-scale power lines. It incorporates novel techniques such as random red-black checkerboard propagation, strategies for reducing matching cost computations and GPU-based depth map fusion, achieving high efficiency and maintaining power line reconstruction completeness in UAV-based inspections. This method outperforms Patch-Match-based methods and is significantly faster than Colmap, offering potential applications in fast UAV-based corridor inspection. (Jiang et al. Citation2017) investigated the use of unmanned aerial vehicles (UAVs) for outdoor data acquisition and accuracy assessment in transmission line inspection. They designed an oblique photogrammetric system with dual cameras and GNSS technology to achieve ground resolutions better than 3 cm. The study demonstrates that this approach, with fewer ground control points, yields absolute and relative accuracy in image orientation and model measurement better than 0.3 and 0.2 m, respectively. This cost-effective solution shows promise for accurate and efficient transmission line inspections. Furthermore, Zhang et al. (Citation2017) address the need for efficient safety inspections of power line corridors. They utilized a low-altitude UAV equipped with an optical digital camera and proposed a semipatch matching algorithm based on epipolar constraints to extract 3D point clouds. By automatically locating obstacles within power line corridors with an accuracy better than ±0.5 ms, their cost-effective method offers a reliable solution for practical power line inspection.
There are examples of algorithms to aid forest management using UAV-LiDAR point cloud data to detect early vegetation encroachments (Chen et al. Citation2022) and to devise a comprehensive system to extinguish fires (Elfgen et al. Citation2023). Similarly, a method of forest fire detection and tracking utilising drones and statistical algorithms is proposed (Yuan et al. Citation2015). Multispectral satellite imagery has also been successfully used to extract and map transmission lines, towers and other infrastructure (Jardini et al. Citation2007). Broadly, these studies have been used to either create DSMs of sufficient detail and accuracy to measure heights, or to employ reflectance values to classify and quantify vegetation types based on indices such as the Normalised Difference Vegetation Index (NDVI) (Haroun et al. Citation2021). However, for better characterization of fuel distribution for wildfires, high-resolution imagery is needed. UAV-based photogrammetry can provide these improved levels of resolution, thereby potentially reducing the risks involved when ascending steel transmission towers for visual inspections (Jordan et al. Citation2018). To date, most studies have focused on the mapping of electrical structures, right of way and vegetation encroachment (Matikainen et al. Citation2016), while minimal attention has been given to the vegetation underneath the transmission lines using UAV and photogrammetry techniques (Kim and Sohn Citation2013).
UAV-based photogrammetry enables efficient control methods that can vary according to the vegetation type, the location and terrain of the power line corridor (PLC) and the accessibility of machinery into a PLC. There are methods of vegetation control for such corridors (Çoban et al. Citation2019) that include mechanical methods (mega-mulching, bulldozing and targeted tree felling), chemical controls (spot foliar spraying directly onto unwanted plants, targeted chemical sprays for groups of vegetation, such as woody weeds and broadcast chemical spraying to remove larger tracts of vegetation), and burning during cooler times of the year to control low height flora, understory vegetation or to remove the mulch and grass layers (Eliott et al. Citation2020, Citation2021).
In response to the imperative of maintaining a reliable electricity supply amidst the escalating threat of bushfires, this study embarks on a clear and well-defined research aim. Our primary objective was to investigate the utility of image and photogrammetric analysis along with the application of segmentation algorithms for assessing vegetation height and volume in power line corridors within the fire-prone region of Southeast Queensland, Australia. Specifically, we aimed to evaluate the effectiveness of fuel reduction techniques, including mega-mulching, spot sprays and cool mosaic burns, using drone-derived models. By quantifying the impact of these techniques on fuel loads and vegetation within power line corridors, this research strives to contribute vital insights into the management of wildfire risk in critical energy distribution infrastructure and offer valuable guidance to authorities tasked with safeguarding these essential networks. Temporal monitoring is needed to aid the decision-making process of developing a constructive maintenance schedule to maintain minimal fuel load biomass whilst maintaining ground cover and biological diversity. However, there is little published information on the temporal mapping of post-treatment vegetation in power line corridors, despite the potential for remote sensing technologies to aid in providing useful information. This study provides methods for an economic solution for the temporal monitoring of fuel structure using drone-derived information. The outcome of this study will enable authorities to better manage vegetation in power line corridors to reduce wildfire risk.
Methods
Study site
The study site is located approximately 105 km north of Brisbane, Queensland in the Mapleton Falls National Park (MFNP, ), one of seven National Parks located in the Sunshine Coast region. The Sunshine Coast region has more National Parks, State Forests and Recreational Areas than any other region in Queensland. The MFNP is within the Blackall Ranges and is dominated by a variety of vegetation types, including eucalypt forests, rainforests, shrubby woodlands and grasslands. The Mapleton region had an annual total rainfall of 1239 mm for the 2020 calendar year (Queensland Government Citation2023) despite the long-term average rainfall calculated from a 118-year dataset being 1807 mm per year (Bureau of Meteorology (BOM) Citation2021). Powerlink Queensland currently manages 15,345 km of transmission lines connected through 147 substations, running from Cairns to the New South Wales - Queensland border (Powerlink Queensland Citation2021). The MFNP is part of that network and is maintained by Powerlink Queensland. The power line corridor used in the current study is approximately 2 km northwest of the Mapleton Day Use Area and comprises 210,000 m2 of bushland ().
Figure 2. Map showing the location of the tower spans within the power line corridor, Mapleton Falls National Park, Queensland, Australia.
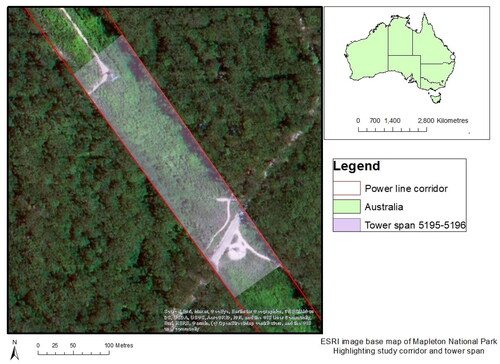
The power line corridor of the study area has an average width of 70 m and is approximately 3 km in length. The ground surface is undulating, with gradients varying across the park and within the corridor. The 275 kV transmission lines are suspended between steel lattice towers. Vegetation management within this corridor is performed using a combination of periodic mega-mulching, slashing, spot spraying, targeted tree felling and planned maintenance burns, all carried out in conjunction with Queensland Parks and Wildlife officers (Department of Environment and Science, 2021). The most recent treatments comprised of mega-mulching, conducted in August 2020, followed by a patchy cool burn in February 2021 over some, but not all of the area. Areas composed of steep gullies, rainforest vegetation or vegetation growing in watercourses were left untreated either to maintain watercourse bank stability, to leave the rainforest intact or due to the machines being unable to access gullies safely due to steep banks. The mulching treatments in August 2020 were timed to allow the current study to investigate changes in fuel structure and fuel loads associated with such management.
Data acquisition
The appropriate permits and approvals were sought and granted for conducting this UAV-based study. These included approvals and risk assessments from the University of the Sunshine Coast (USC), the Department of Environment and Science (DES), the Civil Aviation Safety Authority (CASA), the appointment of a suitably licenced qualified drone pilot and a site survey before the completion of inductions, a final risk assessment and approval from Powerlink Queensland to proceed with data collection (CASA Citation2023).
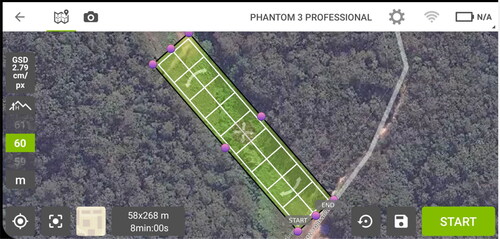
The remotely sensed images were obtained using a DJI Phantom 4 Professional drone, fitted with a 25 mm, 20MP, CMOS, mechanical optical shutter. All flight plans were of a PIX4D double-grid pattern (), following a forward, backward, left and right sequence and monitored using a Samsung tablet al.l missions were flown as per CASA guidelines, DES regulations, UniSC-approved risk assessments and Powerlink Queensland’s safety requirements for working within and around power lines. Each mission was flown at a minimum altitude of 60 m above ground level. This minimum altitude was set using the highest ground-level take-off point near the tower to ensure this was the lowest altitude point during the flight over undulating terrain. This method satisfied the minimum vertical distance requirement for the operation of a drone close to transmission lines. The forward camera angle for each mission was set at 60 degrees with a lateral and forward overlap of 80%. The imagery was stored in flight on a 32 Gb micro-SD card.
Figure 3. Screenshot image of the flight plan, from Pix4D, used to control the DJI drone for image capture. The image shows the flight plan for tower span 5195 to 5196.
Three missions were flown along the power line corridor. The first mission was flown pre-treatment, in June 2020. The first post-treatment missions were flown in October 2020, with the second post-treatment missions flown in May 2021.
Photogrammetry
The sequential overlapping 2D images collected from DJI Drone with camera model FC6310 were subjected to Structure from Motion (SfM), a photogrammetry technique, to derive a 3D model together with an orthomosaic of the study area. The process aligns all the overlapping images with aerial triangulation and bundle block adjustment using information estimated on interior and exterior camera orientation information.
The drone images were stored on a network storage facility and processed using the Agisoft Metashape Professional 1.7.1 software package that processed images collected by the drone into georeferenced spatial products. Metashape uses a standard photogrammetric workflow sequence, commencing with Image Alignment and concluding with three sets of DSMs and orthomosaics of the surveyed PLC, one pre-treatment (June 2022) and two post-treatment (October 2020 and May 2021). The Photo Alignment and Dense Point Cloud qualities were set to ‘high’. The analytic progression using Agisoft Metashape is summarised in . Metashape used metadata of each image from the exchangeable image file (EXIF) to calculate the initial values of sensor pixel size and focal length parameters for the autocalibration of the camera. EXIF files store metadata information for digital images taken by many devices such as digital cameras, smartphones and drones.
Table 1. Batch process settings used in Agisoft Metashape Professional 1.7.1 for drone image processing.
The resultant DSM and orthomosaic images were exported as .tiff files for further processing using ArcGIS.
Geospatial processing
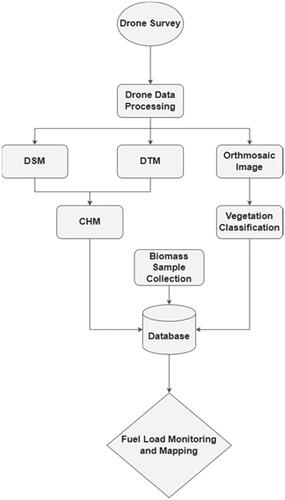
ArcGIS 10.8.1 software was used to process the imported DEM and orthomosaic .tiff images. The initial step was the creation of a Region of Interest (ROI) data layer. Masking removed irrelevant and extraneous data leaving clipped DSMs containing the towers, transmission lines and vegetation to the approximate edge of the corridor, whilst excluding the forested areas outside the corridor border. illustrates the methodology employed throughout the entire study.
Figure 4. Flow diagram showing different steps involved in this study.
The clipped DSM orthomosaic of the October 2020 image was georeferenced using a NEARMAP aerial image taken on the same day as the first post-treatment mission. The images relating to the pre-treatment (June 2020) and second post-treatment (May 2021) missions were co-registered to this image using the Spline Transformation facility of ArcGIS.
By careful selection of bare ground visible on these DSMs, terrain height values were extracted and interpolated to produce a Digital Elevation Model (DEM) of the study areas. LiDAR data gathered by the Sunshine Coast Council (SCC) in 2018 was used to test the accuracy of the DEMs.
The Canopy Height Models (CHM) for the three temporal images were generated using the formula: CHM = DSM − DEM.
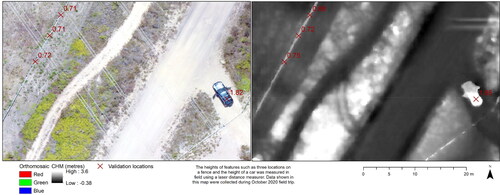
The heights derived in the CHMs were validated with field information during all field visits. Features such as permanent metallic fences and parked vehicles of the study team were used to ensure acceptable similarity between field-measured heights and the heights of the same feature in CHM ().
Figure 5. Validation of canopy height model heights with information collected in the field of known features.
R library: forest tools processing
A facility within this analytical program is Marker Controlled Watershed Segmentation (MCWS). This is an algorithm that delineates trees as individual units that can be converted to polygons with height statistics. By the creation of polygons to identify individual trees the total amount of pre-treatment vegetation within the ROI could be calculated and by comparing these values to the post-treatment values of October 2020 and May 2021 imagery, the amount of vegetation removal and regrowth could be determined.
Imagery classification
Once the imagery had been processed through Agisoft Metashape and ArcGIS 10.8.1, the orthomosaics were imported into ENVI 5.6 (64-bit) software. Supervised classification was performed using training data for each vegetation class, carefully selected in the orthomosaic images. Once all classes were accounted and selected for, the minimum distance algorithm was used to classify the vegetation into seven classes.
The percentage cover of the various classes within each temporal orthomosaic image was calculated. Comparison with pre-treatment data enabled regeneration to be qualified when combined with height data from the MCWS interpretation of the CHMs. This quantification was achieved using a 2-m buffer zone centred around the revisit points ( ).
Figure 6. Classified raster image showing classified areas and the 2-m buffer zones. (ArcGIS).
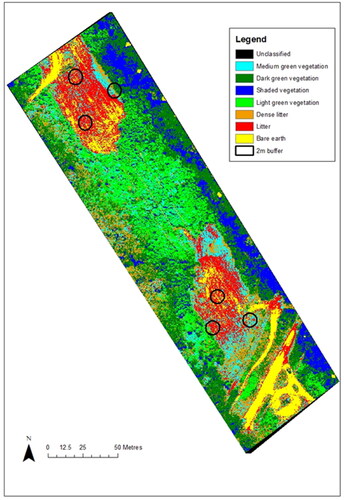
Table 2. Classes used for ENVI classification and the percentage of cover per class.
Vegetation data collection
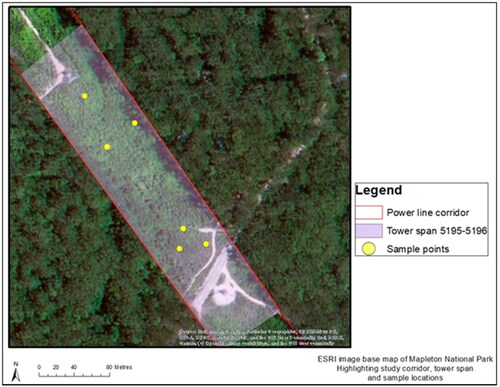
Fuel load structure data was collected over 8 months, commencing before a mega-mulching treatment and on two other separate sampling occasions post-treatment. Vegetation samples were collected from the PLC. Around each tower, three random base points were selected. Two of the three base points were in the treated areas. These points were ‘95n0’ which was near the tower adjacent to the main access road and ‘95n2’, located closest to the centre watercourse. The base point ‘95n1’ was in an untreated section of the corridor near its western edge. These base points are illustrated in . Each base point was marked with a labelled wooden stake to allow re-visits, and the GNSS position of each stake was recorded using a handheld Leica GNSS unit. Samples were taken using a 0.5 × 0.5 m quadrat frame, positioned 1 m from each base point and taken pre-treatment (before mega-mulching) and at three months and eight months post-treatment.
Data recorded included vegetation height and type. Biomass samples () were collected from each quadrat frame and classified as either standing vegetation (independently standing plants with a root structure) or litter (vegetation or debris that had no root structure), such as leaf litter and organic debris (e.g. mulched material) including sticks and twigs with a diameter of less than 1 cm.
Figure 7. Image showing the locations of each sample base point used for vegetation data collection.
shows the sampled and mean biomass of both the standing and litter matter collected in October 2020 and May 2021, in both the northern and southern sections of the tower span. There was a general trend of increased standing vegetation, with a decrease in litter, due to regrowth and the breakdown of litter over time in the treated areas. However, fuel biomass was highly variable across these limited sampling locations ().
Figure 8. Image showing how the subsample points were measured from the base points for sample collection.
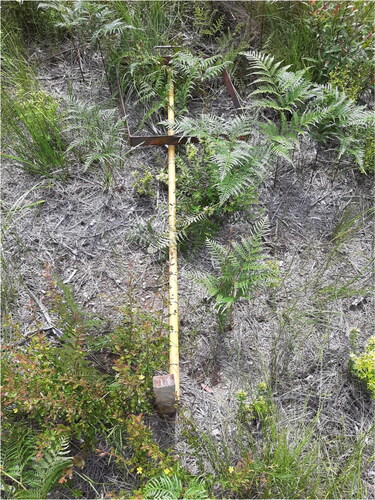
Table 3. Biomass of standing and ground vegetation across the tower span, in October 2020 and May 2021 in treated (T1 and T2) and untreated (UT) areas of the span.
Where trees >3 m were present, heights were measured using a TruPulse Laser Rangefinder and the position of trees surveyed was recorded using a handheld GNSS device. The height of vegetation that was 3 m in height or less was measured with a graduated height stick to the nearest 5 cm at each sample point.
The vegetation samples collected were placed in labelled, paper bags and weighed in the field at the time of collection. Samples were then stored and transported in a portable 12-volt fridge at a temperature of four degrees Celsius. In the laboratory, the samples were dried in a commercial-grade oven at 70 degrees Celsius and the final dry mass was recorded.
The volume of vegetation was measured in cubic metres (m3). MS Excel software was used to calculate mean values and standard errors.
Data analysis
Changes in height and volume were calculated for the periods between June 2020 to October 2020, October 2020 to May 2021 and June 2020 to May 2021, in treated (mulched) and untreated areas for the north and south ends of the tower span. The litter height values taken in the field were small, and during image analysis, it was realised that the software and CHM would not be able to accurately model these heights. Two-tailed t-tests with unequal variance were used to compare the differences in vegetation heights and volumes between treated and untreated areas over the study period using remotely sensed (RS) data. For the field observed data, the mean height and standard error (SE) were calculated and tabulated with the mean (RS) data. The field data (vegetation heights) were compared against the RS data, using simple least-squares regression analysis in MS Excel.
Results
Image analysis
From the aerial data collected by the drone, point clouds and orthomosaic images were produced, with the orthomosaic composite images including red, green and blue (RBG) bands. With the base data established, further processing allowed the generation of other data products, such as colourised dense point cloud data and DSMs. This enabled the creation of high-resolution raster data products; e.g. 0.0172 m for orthomosaics and 0.0215 m for digital surface model (DSM) and canopy height model (CHM) ().
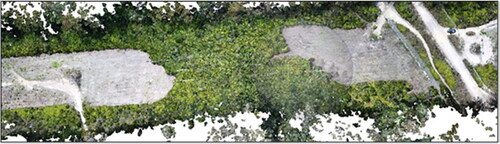
Figure 9. Colourised dense point cloud produced from drone-derived data in Agisoft Metashape, tower span 5195–5196.
Dense point cloud, orthomosaic and DSM raster images were produced for each date range (), all with similar quality outputs.
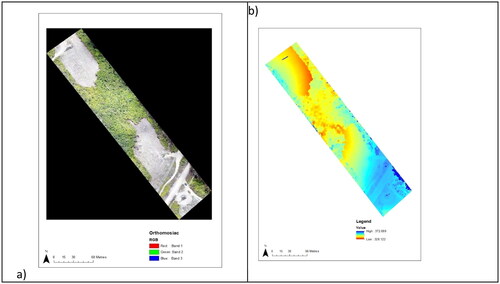
Figure 10. Drone-derived data produced (a) the orthomosaic image with RGB bands and (b) DSM.
Vegetation data
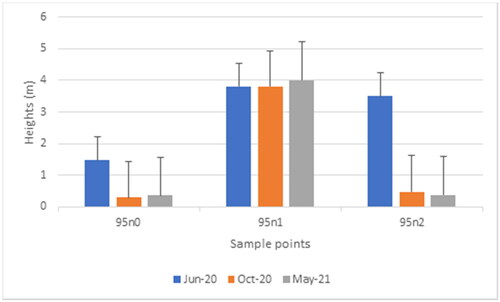
illustrates the mean vegetation heights for each revisit site for each sample date. In this case, point ‘95n1’ was the untreated sample point and hence there was conformity in vegetation heights over time, with some growth noted in May 2021. The June 2020 data shows the tallest vegetation, as this sampling was undertaken before mulching treatments. The decrease in vegetation heights between May 2020 and the following two sample times at points ‘95n0’ and ‘95n2’ was due to the mulching treatments.
Figure 11. Change in field-observed vegetation heights at each sample point at tower 5195. Sample points ‘95nl’ received no fuel-reduction treatment, whilst sample points ‘95n0’ and ‘95n2’ received mega-mulching treatments in August 2020.
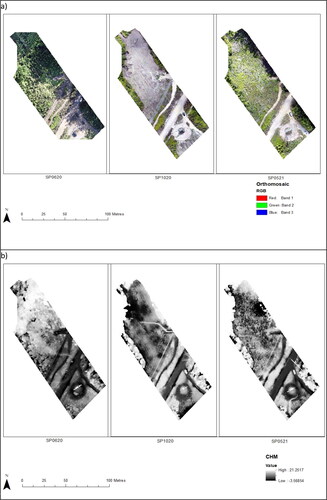
show the northern tower span scene, and depict the southern tower span scene orthomosaic images and the CHM, from pre-treated June 2020 to the first post-treatment flight of October 2020 to the final post-treatment flight of May 2021.
Figure 12. (a) Shows the orthomosaic RGB imagery of the northern tower span, June 2020, October 2020 and May 2021, (b) displays the CHM for the northern tower span (from L to R) June 2020, October 2020 and May 2021.
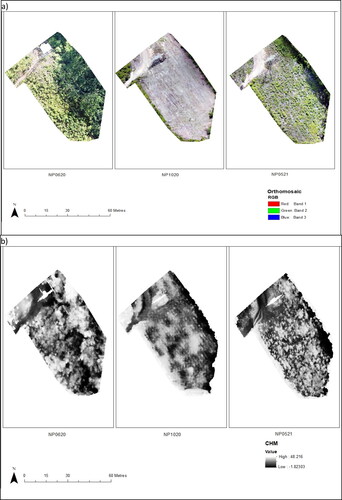
Figure 13. (a) Depicts the orthomosaic RGB images for their southern section (from L to R) in June 2020, October 2020 and May 2021, (b) depicts the CHM for the southern tower span in June 2020, October 2020 and May 2021.
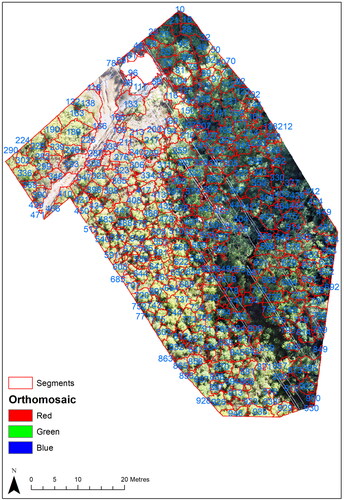
The use of MCWS is illustrated in , showing the segmentation patterns for both the north and south areas for June 2020, pre-treatment. In , there is a white section, an area of missing data. The MCWS segments derived from June 2020 images were used as geographic units (zones) that enabled the comparison of vegetation volume for both sections of the span, for the three dates. The number of segmentations varied with each date. For June 2020, there were 627 and 325 segments in the southern and northern sections, respectively. October 2020 southern and northern segmentations numbered 1600 and 657. The final orthomosaic contained 2310 and 1224 segments for the southern and northern sections of the tower span.
Figure 14. Orthomosaic image overlaid with the MCWS segments around individual trees in the northern sector of the tower span. The labels show unique identification numbers assigned to each segment.
A zonal statistics tool was used to calculate the average vegetation height for all the segments for all three dates together with the area of each segment. This enabled the estimation of volume for all the segments.
shows the change in vegetation heights and volumes over the study period. From June 2020 to October 2020 (), there was a significant decrease in vegetation heights and volumes following the mulching treatments. From October 2020 to May 2021 (), values in both treated and untreated areas were positive, indicating a period of vegetation regrowth in treated areas. From June 2020 to May 2021 (), we see that the effects of mega-mulching were still clear over the study’s 11-month time frame (i.e. the changes in height over that period in treated areas were negative).
Figure 15. Graphical representation of the change in vegetation heights and volumes in treated and untreated areas of both northern and southern tower span scenes June 2020 to October 2020(a and d); October 2020 to May 2021 (b and e); and June 2020 to May 2021(c and f).
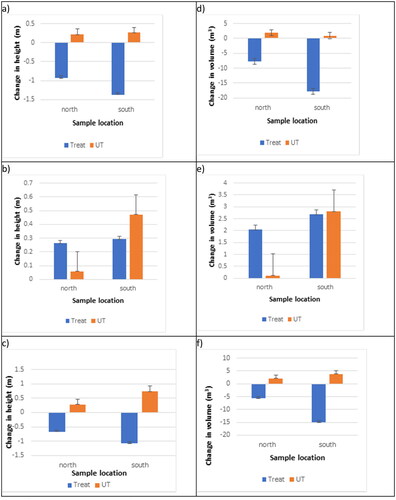
presents the two-tailed t-test results applied to the remote sensed segmentation data attained during processing. Between June 2020 and October 2020, there were significant height and volume changes in the vegetation in both the northern and southern sections of the tower span (). These differences were still evident over the study’s 11-month time frame (June 2020 to May 2021; ). There was no significant change in height between October 2020 and May 2021, suggesting vegetation growth was similar in both the treated and untreated areas of the northern and southern segments ().
Table 4. Two-tailed t-test analysis of the remote sensed segmentation data (change in vegetation height and volume over time) from the north and south scenes of the tower span.
There was strong agreement between the field and RS values of vegetation height (). illustrates this relationship (R2 = 0.9073; df = 1,16; F = 156; p < .001).
Figure 16. Simple least-squares regression analysis of the field and RS data, showing a strong relationship between the two datasets.
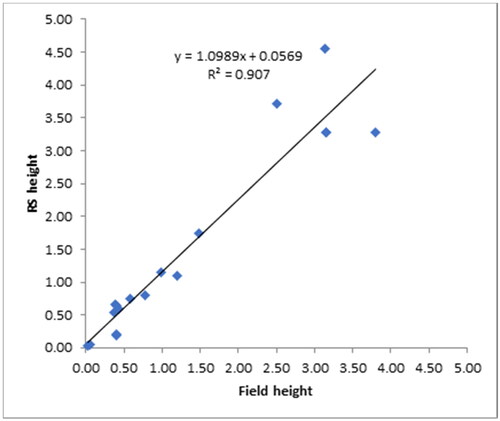
Table 5. Field observed measurement and RS calculated measurement for vegetation heights across the tower span.
Discussion
This study aimed to determine if the use of drone-derived photogrammetry and image analysis allows the mapping and monitoring of fuel structure underneath major transmission power lines with sufficient accuracy for use by the electricity industry. The power generation and supply industry dictate that vegetation must not exceed a minimum distance from the transmission lines (this distance varies depending on voltage carried, type of tower, rural or residential and many other variables). Previously, this distance required surveyors with specialist tools and time to conduct the surveys, and then, produce maps, or simply rely on visual estimations from experienced easement officers. The use of UAVs is ever-increasing and along with advances in image analysis software, is showing a plethora of potential applications, including the measurement of underlined vegetation.
Our study revealed that mega-mulching emerged as an effective way of removing bulk fuel loads quickly, particularly if planning requirements are for nonselective removal. As expected, there was a general trend towards positive growth within the treated areas during the study period, following mega-mulching ( and ). During the June 2020 to October 2020 period, there was a significant drop in vegetation height and volume ( ), indicated by both the field-observed measures and RS calculations (), due to the area being mega-mulched, leaving only a layer of mulch across the tower span. Between October 2020 and May 2021, there was a period of vegetation growth that was statistically similar in treated and untreated areas ( and ). Cool burns were also conducted, along with targeted spot-spraying operations to remove the undesired plants (e.g. exotic species and tall woody plants). Whilst not specifically recorded in this study, there was a noticeable increase in native grasses in the treated areas of the tower spans that were monitored in this study. This change in vegetation composition (from taller woody vegetation to shorter herbaceous vegetation) is a desirable outcome in terms of fuel hazard reduction. To determine a temporal scale for regrowth to that of pre-treated values, a longer period of monitoring is required. This would help inform management on the frequency of fuel reduction treatments needed in this particular environment.
Our results show that field-measured observations were similar to the values calculated from the RS data. There was greater variation between field values and RS values when the vegetation heights increased ( ). Studies by Wang et al. (Citation2021), using Landsat 8 OLI imagery and (Olive et al. Citation2020) who used machine learning to analyse LiDAR-derived CHM also demonstrated a similar result in taller vegetation. This may be partly due to inaccuracies in measuring taller vegetation with field assessment methods or may be due to the variation in the gradient of the corridor, with both studies conducted in irregular, uneven terrain. With an r2 = 0.91, this study is on par with other studies that have compared field data with LiDAR-derived CHMs (r2 = 0.85, r2 = 0.95) (Hopkinson et al. Citation2008, Citation2006) in forestry settings. When comparing the accuracy of UAV-RTK, UAV-LiDAR and UAV-UAV combinations for vegetation height assessments, Chen et al. (Citation2017) concluded that the most accurate method, particularly for densely vegetated areas, was the combination of UAV-LiDAR processed data. When comparing our study sites, there were noticeable similarities in density and terrain, with similar overall results (r2 = 0.84), using similar data collection techniques and software applications.
Initially, we tried to derive georeferenced CHMs from drone-derived DSM and LiDAR data. This proved ineffective for two reasons:
The pre-treated areas were so dense, that there was no viable way to lay GCPs that were visible from the drone images to georeference the orthomosiac and DSM; and The EXIF data in each drone image contained inaccurate altitude readings.
An image from NearMap, taken on the same date as the first post-treatment flight, was used to georeference the October 2020 orthomosiac/DSM, to which the other orthomosiac/DSM were co-referenced. This had the dual benefit of both georeferencing the drone-derived data and removing the inconsistencies in altitude data. Altitude discrepancy is a regular fault with the use of barometric altitude readings associated with the DJI drone used in this study (Agisoft Citation2023). Nevertheless, when performing the first pre-treated flights, GCPs on access roads (both major and minor roads, fire trails and larger game trails) should be used in future studies, and additional GCPs could be used in treated areas over time. This would aid in georeferencing orthomosiac/DSM maps. It is anticipated that this adaptation would allow for the development of an accurate CHM derived from the drone-derived DSM and DEM alone, without the need for LiDAR-derived CHM.
This drone-based study provided a good temporal comparison of vegetation growth in the study area, however, the lack of mapping understory vegetation, especially under dense canopy is a major limitation. Such limitations could be alleviated by the use of LiDAR scans but at a higher cost. Additionally, having a broader data set from the field, fuel heights and volumes, would have been beneficial and should be considered for any future study. A larger data set would allow a more robust comparison between field data and remotely sensed data. Data collection over a longer time would also be beneficial to track changes in vegetation growth post-treatment over different seasons and years. Whilst this would add to the processing and labour time, a clearer indication of regrowth rates within the corridor could guide future re-treatment periods and techniques.
The methods used in this study provide an economical way to collect routine information on vegetation beneath power line corridors. Such information can guide the timing of periodic prescribed burning or other methods such as mechanical fuel removal.
Recommendations and conclusions
It would be beneficial to further develop and simplify the workflow. Being able to develop a drone-derived CHM would provide this. This would negate the need for LiDAR data and reduce the computing time, programs and training required. As Powerlink and other electricity providers already use drones for infrastructure assessments, it makes sense to use drone-derived data for vegetation assessments and management. Future studies may also try to determine species composition from RS imagery. This is of interest where the goal is to retain or encourage specific low-growing species (e.g. native grasses) within the corridors. The methods used for this study, whilst being modified throughout the study, showed that by incorporating deep learning and LiDAR technology, it was possible to map the fuel structure underneath major transmission power lines with an acceptable level of accuracy. The outcome of the work is beneficial for those carrying out treatments of the vegetation beneath the transmission lines to reduce the risk associated with fire. Further, it will help in the development of effective forest fire mitigation, aid emergency services and provide cost-efficient ways to extinguish fires over larger regions. In the future, attempts will be made to develop data fusion techniques for better data visualization as well as for monitoring wildfire risk over much wider areas. Further research is needed to predict early fire risk surrounding power lines through the incorporation of deep learning techniques and thermal high-resolution datasets.
Authors’ contributions
Conceptualisation, J.S., T.L., H.S., P.S. and S.K.S.; methodology, J.S.; software, K.P. and S.K.S.; validation, K.P., T.L. and S.K.S.; formal analysis, J.S., T.L., H.S. and P.S. investigation, J.S., K.P. and T.L.; resources, University of the Sunshine Coast; data curation, J.S., K.P. and S.K.S.; writing—original draft preparation, J.S. and K.P.; writing—review and editing, J.S., K.P., T.L., H.S., P.S. and S.K.S.; visualisation, K.P.; supervision, T.L., P.S. and S.K.S.; project administration, J.S. All authors have read and agreed to the published version of the manuscript.
Acknowledgement
The authors would like to acknowledge the contribution and assistance of Stephen Martin (Powerlink Queensland) and Joel James (Powerlink Queensland).
Data availability statement
The data collected and analysed in this study remain the property of the University of the Sunshine Coast. Access to this data for approved use can be obtained via the corresponding author.
Disclosure statement
No potential conflict of interest was reported by the authors.
Additional information
Funding
References
- Abatzoglou JT, Williams AP. 2016. Impact of anthropogenic climate change on wildfire across western US forests. Proc Natl Acad Sci USA. 113(42):11770–11775. doi: 10.1073/pnas.1607171113.
- Agisoft. 2023. Working with DJI photos (altitude problem) [Accessed October 2023]. https://agisoft.freshdesk.com/support/solutions/articles/31000152491-working-with-dji-photos-altitude-problem-.
- Bureau of Meteorology (BOM). 2021. Bushfire weather [accessed October 2023]. http://www.bom.gov.au/weather-services/fire-weather-centre/bushfire-weather/index.shtml.
- CASA. 2023. Drone rules [accessed October 2023]. https://www.casa.gov.au/drones/drone-rules.
- Chang SE, McDaniels TL, Mikawoz J, Peterson K. 2007. Infrastructure failure interdependencies in extreme events: power outage consequences in the 1998 Ice Storm. Nat Hazards. 41(2):337–358. doi: 10.1007/s11069-006-9039-4.
- Chen S, McDermid G, Castilla G, Linke J. 2017. Measuring vegetation height in linear disturbances in the boreal forest with UAV photogrammetry. Remote Sens. 9(12):1257. doi: 10.3390/rs9121257.
- Chen Y, Lin J, Liao X. 2022. Early detection of tree encroachment in high voltage powerline corridor using growth model and UAV-borne LiDAR. Int J Appl Earth Obs Geoinf. 108:102740. doi: 10.1016/j.jag.2022.102740.
- Çoban S, Balekoğlu S, Özalp G. 2019. Change in plant species composition on powerline corridor: a case study. Environ Monit Assess. 191(4):200. doi: 10.1007/s10661-019-7341-3.
- Elfgen M, Burghardt F, Grädener E, Wohlgemuth V. 2023. Comprehensive drone system for deployment in disaster scenarios with focus on forest fire fighting. In: Wohlgemuth V, Naumann S, Behrens G, Arndt HK, Höb M, editors. Advances and new trends in environmental informatics. Cham: Springer International Publishing; p. 149–164. doi: 10.1007/978-3-031-18311-9_9.
- Eliott M, Lewis T, Venn T, Srivastava SK. 2020. Planned and unplanned fire regimes on public land in south-east Queensland. Int J Wildland Fire. 29(5):326. doi: 10.1071/WF18213.
- Eliott MG, Venn TJ, Lewis T, Farrar M, Srivastava SK. 2021. A prescribed fire cost model for public lands in south-east Queensland. For Policy Econ. 132:102579. doi: 10.1016/j.forpol.2021.102579.
- Eltner A, Sofia G. 2020. Structure from motion photogrammetric technique. In: Tarolli P, Mudd SM, editors. Development in earth surface process; Vol. 23, Elsevier; p. 1–24. doi: 10.1016/B978-0-444-64177-9.00001-1.
- Flood M. 2011. Workflow challenges on airborne LiDAR electrical transmission project. Photogramm Eng Remote Sens. 77:438–443.
- Hopkinson C, Chasmer L, Hall RJ. 2008. Using airborne LiDAR to examine forest growth. Remote Sens Environ. 112(3):1168–1180. doi: 10.1016/j.rse.2007.07.020.
- Hopkinson C, Chasmer L, Lim K, Treitz P, Creed I. 2006. Towards a universal lidar canopy height indicator. Can J Remote Sens. 32(2):139–152. doi: 10.5589/m06-006.
- Huang W, Jiang S, He S, Jiang W. 2021. Accelerated multi-view stereo for 3D reconstruction of transmission corridor with fine-scale power line. Remote Sens. 13(20):4097. doi: 10.3390/rs13204097.
- Jardini MGM, Jardini JA, Magrini LC, Masuda M, Le Silva PR, Quintanilha JA, Beltrame AMK, Jacobsen RM. 2007. Vegetation control of transmission lines right-of-way. 2007 3rd International Conference on Recent Advances in Space Technologies, Istanbul, Turkey. IEEE. p. 660–665. doi: 10.1109/RAST.2007.4284075.
- Jiang S, Jiang W, Huang W, Yang L. 2017. UAV-based oblique photogrammetry for outdoor data acquisition and offsite visual inspection of transmission line. Remote Sens. 9(3):278. doi: 10.3390/rs9030278.
- Jordan S, Moore J, Hovet S, Box J, Perry J, Kirsche K, Lewis D, Tse ZTH. 2018. State‐of‐the‐art technologies for UAV inspections. IET Radar Sonar Navig. 12(2):151–164. doi: 10.1049/iet-rsn.2017.0251.
- Kim HB, Sohn G. 2013. Point-based classification of power line corridor scene using Random Forests. Photogramm Eng Remote Sens. 79(9):821–833. doi: 10.14358/PERS.79.9.821.
- Luque-Vega LF, Castillo-Toledo B, Loukianov A, Gonzalez-Jimenez LE. 2014. Power line inspection via an unmanned aerial system based on the quadrotor helicopter. MELECON 2014 - 2014 17th IEEE Mediterranean Electrotechnical Conference, Beirut, Lebanon. IEEE. p. 393–397. doi: 10.1109/MELCON.2014.6820566.
- Haroun FME, Deros SNM, Baharuddin MZB, Md Din N. 2021. Detection of vegetation encroachment in power transmission line corridor from satellite imagery using support vector machine: a features analysis approach. Energies. 14(12):3393. doi: 10.3390/en14123393.
- Matikainen L, Lehtomäki M, Ahokas E, Hyyppä J, Karjalainen M, Jaakkola A, Kukko A, Heinonen T. 2016. Remote sensing methods for power line corridor surveys. ISPRS J Photogramm Remote Sens. 119:10–31. doi: 10.1016/j.isprsjprs.2016.04.011.
- McGee TK, Russell S. 2003. “It’s just a natural way of life…” an investigation of wildfire preparedness in rural Australia. Environ Hazards. 5(1):1–12. doi: 10.1016/j.hazards.2003.04.001.
- Munir N, Awrangjeb M, Stantic B. 2019. An automated method for individual wire extraction from power line corridor using LiDAR data. 2019 Digital Image Computing: Techniques and Applications (DICTA). IEEE. p. 1–8. doi: 10.1109/DICTA47822.2019.8946085.
- Olive K, Lewis T, Ghaffariyan MR, Srivastava SK. 2020. Comparing canopy height estimates from satellite-based photogrammetry, airborne laser scanning and field measurements across Australian production and conservation eucalypt forests. J For Res. 25(2):108–112. doi: 10.1080/13416979.2020.1735671.
- Parker BM, Lewis T, Srivastava SK. 2015. Estimation and evaluation of multi-decadal fire severity patterns using Landsat sensors. Remote Sens Environ. 170:340–349. doi: 10.1016/j.rse.2015.09.014.
- Penglase K, Lewis T, Srivastava SK. 2023. A new approach to estimate fuel budget and wildfire hazard assessment in commercial plantations using drone-based photogrammetry and image analysis. Remote Sens. 15(10):2621. doi: 10.3390/rs15102621.
- Powerlink Queensland. 2021. Network [accessed October 2023]. https://www.powerlink.com.au/network.
- Queensland Government. 2023. SILO-Australian climate data from 1889 to yesterday. [accessed October 2023]. https://www.longpaddock.qld.gov.au/silo/point-data/.
- Rinaldi SM, Peerenboom JP, Kelly TK. 2001. Identifying, understanding, and analysing critical infrastructure interdependencies. IEEE Control Syst Mag. 21:11–25. doi: 10.1109/37.969131.
- Ross T, Srivastava SK, Shapcott A. 2023. Investigating the relationship between fire severity and post-fire vegetation regeneration and subsequent fire vulnerability. Forests. 14(2):222. doi: 10.3390/f14020222.
- Sfetsos A, Giroud F, Clemencau A, Varela V, Freissinet C, LeCroart J, Vlachogiannis D, Politi N, Karozis S, Gkotsis I, et al. 2021. Assessing the effects of forest fires on interconnected critical infrastructures under climate change. Evidence from South France. Infrastructures. 6(2):16. doi: 10.3390/infrastructures6020016.
- Srivastava SK, King L, Mitchell C, Wiegand A, Carter RW, Shapcott A, Russell-Smith J. 2013. Ecological implications of standard fire-mapping approaches for fire management of the World Heritage Area, Fraser Island, Australia. Int J Wildland Fire. 22(3):381. doi: 10.1071/WF11037.
- Srivastava SK, Lewis T, Behrendorff L, Phinn S. 2021. Spatial databases and techniques to assist with prescribed fire management in the south-east Queensland bioregion. Int J Wildland Fire. 30(2):90. doi: 10.1071/WF19105.
- Thorley J, Srivastava SK, Shapcott A. 2023. What type of rainforest burnt in the Southeast Queensland’s 2019/20 bushfires and how might this impact biodiversity. Austral Ecol. 48(3):616–642. doi: 10.1111/aec.13293.
- Wang H, Seaborn T, Wang Z, Caudill CC, Link TE. 2021. Modelling tree canopy height using machine learning over mixed vegetation landscapes. Int J Appl Earth Obs Geoinf. 101:102353. doi: 10.1016/j.jag.2021.102353.
- Wang Y, Lehtomäki M, Liang X, Pyörälä J, Kukko A, Jaakkola A, Liu J, Feng Z, Chen R, Hyyppä J. 2019. Is field-measured tree height as reliable as believed – A comparison study of tree height estimates from field measurement, airborne laser scanning and terrestrial laser scanning in a boreal forest. ISPRS J Photogramm Remote Sens. 147:132–145. doi: 10.1016/j.isprsjprs.2018.11.008.
- Yuan C, Liu Z, Zhang Y. 2015. UAV-based forest fire detection and tracking using image processing techniques. 2015 International Conference on Unmanned Aircraft Systems (ICUAS), Denver, CO, USA. IEEE. p. 639–643. doi: 10.1109/ICUAS.2015.7152345.
- Zhang Y, Yuan X, Fang Y, Chen S. 2017. UAV low altitude photogrammetry for power line inspection. IJGI. 6(1):14. doi: 10.3390/ijgi6010014.
- Zhou M, Li KY, Wang JH, Li CR, Teng GE, Ma L, Wu HH, Li W, Zhang HJ, Chen JY, et al. 2019. Automatic extraction of power lines from UAV LiDAR point clouds using a novel spatial feature. ISPRS Annals of the Photogrammetry, Remote Sensing and Spatial Information Sciences (IV-2/W7), Munich, Germany. p. 227–234. doi: 10.5194/isprs-annals-IV-2-W7-227-2019.