
 ?Mathematical formulae have been encoded as MathML and are displayed in this HTML version using MathJax in order to improve their display. Uncheck the box to turn MathJax off. This feature requires Javascript. Click on a formula to zoom.
Abstract
Understanding the macroscopic spatial-temporal behaviour of hikers plays an important role in targeted planning, marketing and management for regional hiking tourism development. The southeastern margin of Qinghai-Tibet Plateau, with abundant outdoor tourism resources and several World Heritage Sites, was chosen as the study area, and the development characteristics of hiking tourism and the spatial-temporal behaviour of its hikers were explored by seasonal intensity index, kernel density analysis, line density analysis and K-means clustering with volunteered geographic information (VGI). The results showed that hikers differed significantly from traditional tourists in terms of travel time, travel mode and destination choice, which provide vital implications for sustainable policy-making and tourism management in general and in the southeastern margin of Qinghai-Tibet Plateau in particular.
1. Introduction
Tourist spatial-temporal behaviour is the spatial movement behaviour and time allocation behaviour of tourists during recreational travel (Huang Citation2011). It has long been an important element in tourism research. Analysing the temporal and spatial behaviour of tourists can provide insight into tourist preferences and needs, and provide a basis for the planning and management of tourism destinations (Goličnik and Ward Thompson Citation2010). Exploring the places tourists like to visit most, the time they spend in each place, and the differences in attractions preferred by different target groups allows for market segmentation, more diverse and targeted offerings, and increases tourist satisfaction (Holyoak Citation2009). It also creates a distinctive and competitive tourism product to improve the economic efficiency of the destination. Information about tourist flows and area use can avoid unnecessary congestion and conflict by evacuating and diverting tourists, and ensure tourist safety (Manning and Valliere Citation2001; Ostermann Citation2009). Understanding the spatial and temporal behaviour of visitors means grasping the distribution of visitor flow in the scenic area, so as to assess the ecological carrying capacity and provide reference for scenic area protection and management (Orellana and Wachowicz Citation2011).
Since the 1970s, the behaviour of hiking tourism has received global attention. Unlike traditional tourism such as sightseeing and vacation, hiking tourism has its own special characteristics in terms of travel motives and goals, and places to visit. From 2018 to 2021, hiking consistently ranked as the second most popular outdoor activity in the United States. However, in 2022, it overtook running to become the most popular outdoor activity in the country. (Outdoor Industry Association Citation2022; Outdoor Industry Association Citation2023). In Europe, British hikers are divided into two types: the serious and the casual. In Asia, the favourite hiking destinations of Changsha college students in China are natural landscape, quiet villages and ancient cities and towns in order of preference, and the time of travel is mainly winter and summer (Ye Citation2016). In general, because hiking is not limited to a single point or space, but rather moves throughout the territory, the spatial dimensions of the experience go far beyond most other types of tourism, and its travel behaviour is more complex (Adler Citation1989; Urry Citation2007; Quinlan Cutler et al. Citation2014). Therefore, it is necessary to accumulate studies on the spatial-temporal behaviour of hikers in many hiking hotspots around the world in order to further summarize the general behaviour patterns of hikers and enrich the related theories. Although hiking behaviour studies have accumulated in North America (Spencer et al. Citation1999; Hochmair et al. Citation2012; Fondren and Brinkman Citation2022), Europe (Davies Citation2018; Gómez-Martín Citation2019; Zürcher et al. Citation2020), Oceania (Chhetri Citation2015; Wolf et al. Citation2018; Smith et al. Citation2023) and other continents with relatively large hiking markets and their countries, there is a relative lack in Asian countries.
Research on the spatial-temporal behaviour of hiking tourists has been conducted using traditional research methods such as interviews, questionnaires and direct observation (Cui et al. Citation1997; Farías Torbidoni Citation2011; Xie and Fan Citation2017). To analyse the long-term development of hiking in a region, it is crucial to gather multi-year data with substantial sample sizes. For instance, the 2021 Outdoor Industry Association report undertook an extensive research by conducting 18,000 online interviews, which is a labour-intensive process (Outdoor Industry Association Citation2021). Methods such as literature analysis and comparative analysis are also utilized in similar research. Nevertheless, these approaches may result in biased results due to insufficient or outdated data (Huang Citation2005). On-site observation methods including on-site monitoring and surveys are employed to explore the spatial-temporal distribution and preferences of hiking tourism. Studies employing these methods have yielded substantial findings, albeit demanding significant labour and resources. To study the time-space distribution regularities in Mount Tai, continuous monitoring for three days in each season was needed, with hourly statistics on the inflow and outflow of visitors at the scenic area and the population changes at key scenic spots within the area. Research personnel were required to conduct surveys and inspections at various times and locations during each day. To investigate hikers’ spatial preferences for different areas and trails, on-site surveys were conducted at three conservation areas, and 569 structured interviews were carried out in the field (Cui et al. Citation1997). This phase of data collection and processing demands significant effort, and the descriptions provided by hikers may have inherent biases. While collecting data within micro-scale areas like conservation zones remains feasible, the challenges significantly escalate when dealing with broader, macro-scale regions (Farías Torbidoni Citation2011). In comparison, the combination of GPS data and GIS technology can provide more reliable, accurate and precise data (Shechter and Lucas Citation1978; Potter and Manning Citation1984; Gimblett et al. Citation2003; Hallo et al. Citation2005), enrich the research methods and perspectives of tourists’ spatial-temporal behaviour, and provide the possibility of quantitative research based on big data. For example, when Huang and Xia studied the spatial-temporal behaviour of Beijing backpackers using GPS trajectories, they pointed out that the travel season of backpackers was mainly in spring, and most backpackers were eager to travel to ancient villages (Huang and Xia Citation2016). The most common research today is to combine GPS data with visitor characteristics, explore the behaviour patterns of different visitor groups and their influencing factors using Markov chains, sequence alignment analysis and cluster analysis, and combine the results with the planning and management of the study area to make reasonable recommendations (Yu Citation2011; Shoval et al. Citation2015; Liang et al. Citation2019; Ruiz Reina Citation2021). However, the collection of GPS data by traditional methods such as sensors has its limitations. For instance, the GPS collection process is complicated and requires a lot of labour and resources, and the quality and accuracy of GPS data are easily affected by the sensing technology and terrain (Hallo et al. Citation2005; Lai et al. Citation2007; Stopher and Greaves Citation2007). In addition, in vast areas without clear boundaries and proper entrances, it becomes very challenging to retrieve or locate GPS devices (Xu et al. Citation2019).
In the Web 2.0 era, portable GPS terminal devices like smartphones have become rapidly popular, and the way to obtain geographic information has undergone a revolutionary transformation (Wang et al. Citation2018). In 2007, Goodchild first introduced the concept of ‘volunteered geographic information (VGI)’, personal geographic information created, collected and disseminated through websites. With the core idea that ‘everyone acts as a sensor’, VGI continues to evolve, providing a large amount of reliable and real-time synchronized data for the study of spatial-temporal behaviour of hiking tourists (Goodchild Citation2007). In the era when almost everyone carries a smartphone, VGI data can be easily collected using outdoor apps commonly used by hikers. Users can use their smartphones’ built-in GPS to tag their favourite locations in real-time, record the routes they have taken, and seamlessly upload all this information to the app and the corresponding website. Such open platforms allow researchers to effortlessly obtain thousands of data entries using web scraping techniques. This approach is highly convenient and yields data that is more genuine and objective, which is challenging to achieve through traditional methods. Researchers have obtained VGI such as hiking trajectories, photos, tags and users’ own characteristics based on platforms such as Twitter, Flickr, Panoramio and Two Step Road for the study of spatial-temporal distribution and spatial movement patterns of hiking tourists, and have achieved rich research results (Jeong Citation2014; Figueroa-Alfaro and Tang Citation2017; Yun et al. Citation2018; Wang and Fang Citation2021). Yun and Kang et al. analysed the spatial-temporal distribution of hiking tourists in Bukchon Hanok of Korea by season based on VGI using GIS and statistical methods, and the results showed that hiking tourists spent more time in commercial areas or on the main roads leading to the study area, while most streets in residential areas had lower spatial-temporal use density (Yun et al. Citation2018). Xu Xin and Hu Jing used VGI from Six Feet platform in China to study the spatial-temporal behaviour of visitors to Wuhan city parks by different modes of travel, and found that hikers were more flexible with more freedom and a wider range of activities, and some hikers choose to take informal roads; Liu and Wang et al. put up with three microscopic spatial-temporal patterns of ‘day climbing’, ‘night climbing’ and ‘all-day sightseeing’ (Liu et al. Citation2022). However, those studies mostly analyse the spatial-temporal behaviour of hiking tourists inside scenic areas with clear boundaries, yet in real life hikers often move outside the restricted spaces of parks and scenic areas (Bielański et al. Citation2018).
The Qinghai-Tibet Plateau has long been a well-known destination for global outdoorsmen, and in recent years (Zhou Citation2009), its southeastern edge has attracted a large number of outdoor tourists, especially hikers, with its more favourable environment and resources. Specifically, Northwest Yunnan is one of China’s earliest hiking tourist destinations known for the Three Parallel Rivers area as a World Heritage Site. In the 1980s, a large number of international students went there according to the description of Tiger Leaping Gorge by American geographer Rock. Since then, the Tiger Leaping Gorge emerged and evolved into one of the top ten classic hiking routes in the world within a decade or so (Zhu Citation2007). Thanks to its unique tourism resources, hiking tourism in Northwest Yunnan has developed rapidly, with Shangri-La, Dali and Lijiang becoming high-profile hiking destinations with a sizeable hiking market in China and the world (Zhu Citation2006; Huang et al. Citation2016). However, it is not clear when the hikers start, where they come from, which destinations they choose in the vast area of Northwest Yunnan, etc. Local governments and residents are unable to provide services and guidance to cater to the demands of hikers. There is an urgent need to understand basic conditions including spatial-temporal behaviour of hiking tourists to provide a theoretical basis and reference for policy formulation, planning and management of regional hiking tourism development, in order to maintain the harmony of human–land relations as well as sustainable development of the region. Therefore, this study collects VGI and analyses hiking tourists’ spatial-temporal behaviour in Northwest Yunnan, aiming to reveal (1) the development characteristics of hiking tourism in the last thirteen years in Northwest Yunnan, (2) the seasonal behaviour characteristics and intra-day behaviour patterns of hiking tourists, (3) the distribution of hiking points of interest and their changes and (4) popular hiking routes and their changes in Northwest Yunnan.
2. Materials and methods
2.1. Study area: Northwest Yunnan, China
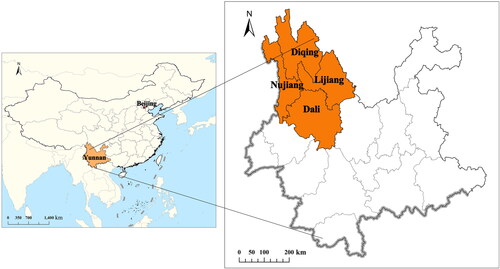
Northwest Yunnan is located in the southwest border of China and at the southeast edge of the Qinghai-Tibet Plateau. It consists of Dali Bai Autonomous Prefecture, Diqing Tibetan Autonomous Prefecture, Nujiang Lisu Autonomous Prefecture and Lijiang City, with a total of 24 counties. The diverse vertical climate and a three-dimensional ecological environment in Northwest Yunnan have given birth to its unique tourism resources (Ming and Tong Citation2016). Up to now, there are one World Natural Heritage (Three Parallel Rivers), one World Cultural Heritage (Old Town of Lijiang) and one Memory of the World (Dongba Culture) in Northwest Yunnan. Moreover, it has three national scenic spots (Dali, Three Rivers and Jade Dragon Snow Mountain), four national historical and cultural cities (Dali City, Lijiang City, Weishan County and Jianchuan County), four national nature reserves (Gaoligong Mountain, Baima Snow Mountain, Cangshan Mountain & Erhai Sea and Yunlong Tianchi) and seven national forest parks (Dongshan Mountain, Baotai Mountain, Feilai Temple, Xinsheng Bridge, Lingbao Mountain, Weibao Mountain and Qinghua Cave). In addition, Northwest Yunnan also owns four national AAAAA class scenic spots (Yulong Snow Mountain, Lijiang Ancient City, Three Pagodas of the Chongsheng Temple, Pudacuo National Park), one world biosphere reserve (Gaoligong Mountain) and three world geoparks or national geoparks (Dali Cangshan Mountain, Yulong Snow Mountain, Liming Scenic Area of Laojun Mountain) (Wang Citation2021).
Since the twentieth century, hiking tourism in Northwest Yunnan has grown rapidly, with hiking destinations covering Lijiang, Shangri-La and Dali. Nearly 20 classic hiking routes have been formed, and each of them has its own characteristics. Especially, Tiger Leaping Gorge has been listed as a world-class hiking route for many times (Zhu Citation2007). However, the field survey revealed that there are still problems regarding the insufficient hiking facilities, inconsistent service quality and poor guidance and management. Meanwhile, hikers’ relatively specific spatial-temporal behaviour remains unknown. Therefore, taking Northwest Yunnan as an example to study the spatial-temporal behaviour of hiking tourists in China is somewhat representative. shows the location of Northwest Yunnan.
Figure 1. Location of the study area.
2.2. Data
The data for this study were mainly in the type of VGI obtained from the outdoor travel website 2bulu.com (http://www.2bulu.com/). 2bulu is currently the most popular outdoor tourism resource sharing and community interaction platform among outdoor enthusiasts in China. It boasts the largest outdoor tourism GPS trajectory database in China. Hikers can use the 2bulu Outdoor Assistant mobile app on their phones to reference hiking routes uploaded by other users, real-time track their own journeys, mark points of interest, add photos, text descriptions, and synchronize all this data with the website and app. Since all data are voluntarily uploaded by users, this largely ensures the authenticity of the data and reflects user preferences. Moreover, the large user base and extensive data samples on the platform collectively represent the choices and behaviours of the majority of hiking enthusiasts nationwide, thereby providing a holistic perspective on the characteristics of hikers.
We used Python to crawl the trajectories and points of interests uploaded by hikers in each prefecture of Northwest Yunnan through the website 2bulu.com. To ensure data quality, a raw data of 9929 GPS trajectories as well as 180,599 points were subjected to a thorough cleansing process. To avoid inaccurate or wrong information, we filtered the data from 1 January 2010 to 31 December 2022. We also removed data from outside the study area or not for leisure tourism purposes, and eliminated abnormal (speed over 15 km/h), duplicate and incomplete data. After using the ‘join’ tool of ArcGIS to connect hiking trajectories to their attributes, points of interest and user attribute data, we obtained 3363 trajectories, 118,287 points and 775 user’s information.
2.3. Methods
2.3.1. Kernel density analysis
Kernel density method is an important spatial analysis method in GIS to evaluate the degree of spatial clustering and dispersion of elements (Xu et al. Citation2019). In this study, it was used to analyse the aggregation of interest point distribution of hiking tourists in Northwest Yunnan. Based on the number of GPS points per square meter (m2), it determines the density of features in a neighbourhood and generates raster maps utilizing the vector data input (Silverman Citation1986). The kernel density estimator is mathematically defined as (Seaman and Powell Citation1996):
(1)
(1)
where
is the number of points,
is the bandwidth or the radius,
is a kernel density function,
is a vector of coordinates that define the location where the function is estimated and
are vectors of coordinates that define each observation
In calculation, the search radius is a very significant factor because it specifies the distance around the point (Yun et al. Citation2018), while the kernel size exerts negligible impacts on the results (Koutsias et al. Citation2014). The choice of the search radius depends largely on the purpose for which the density estimate is used. If it aims to explore the data and suggest models and hypotheses about them, it would be sufficient to choose the radius subjectively by visual inspection (Silverman Citation1986). The kernel density tool in Arcgis10.4 provides a default search radius calculated based on the spatial configuration and number of input points, which is robust to spatial outliers (ArcMap Guidelines for Kernel Density Citation2021). In this research, we set the image element size to 10 m and the search radius to 1000 m by reference to the default value in order to explore the gathering area of the interest points distribution in each of the three phases.
2.3.2. Line density analysis
The line density method was used to identify popular hiking routes in Northwest Yunnan. The principle of line density analysis is to (1) construct the raster of specific image size to cover the study area, (2) for each grid, calculate the ratio of the sum of the lengths of all hiking trajectories included in a circle of a specific radius from the centre point to the area of the circle (3) take the ratio as the value of the grid (4) visualize the different raster value intervals by displaying them in different colours (Sørensen and Sundbo Citation2014). In this study, the line density analysis method was used with the image element size of 50 m and the search radius of 500 m.
2.3.3. Seasonal intensity index
Seasonal Intensity Index, often referred as the Seasonal Strength Index or Seasonality Index, is a statistical measure used to assess the strength or intensity of a specific season within a given context or field. It is commonly used in various domains, such as meteorology, economics, marketing and tourism to analyse and understand the seasonal variations and fluctuations in data (Qin and Tang Citation2014). In the field of tourism, the seasonal intensity index is employed using monthly data as the fundamental unit to examine the seasonal variations in tourism patterns. It finds common application in studies concerning temporal distribution, such as delving into the seasonal variations in the influx of inbound tourists in China (Fang et al. Citation2014), exploring the seasonality of self-driving tourists in Tibet (Liu et al. Citation2019), and examining the temporal concentration of total tourism revenue in Sichuan Province over different years (Qin and Tang Citation2014). The seasonal intensity index with the month as the study unit is calculated by the formula (He et al. Citation2021):
(2)
(2)
where
represents the seasonal intensity index of tourism;
is the share of monthly hiking tourists in the whole year. The larger the
the more obvious the seasonal differences in the number of hiking visitors, and the more
converges to zero, the more uniform the time distribution throughout the year.
This study calculated the proportion of hiking tourists in different months to the total annual count and subsequently computes the seasonal intensity index to reveal the strength of seasonal fluctuations in hiking tourism of Northwest Yunnan.
2.3.4. K-means clustering
K-means clustering, also known as fast clustering method, is a more common clustering method in non-systematic clustering (Qian et al. Citation2012). This kind of clustering has the advantages of fast processing speed, low memory consumption and small computation, and is more suitable for clustering analysis with large sample size. It divides the data into K classes, determines the initial cluster centres first and iterates continuously until the changes in the class cluster centres stabilize or reach the expected number of iterations (Ma et al. Citation2021).
In this article, K-means clustering was used to classify the intra-day time patterns of hiking tourists in Northwest Yunnan, and the specific steps were as follows:(1) Considering the research needs, specify the number of classifications K as three, randomly select three objects in the data, and use the selected data points as the initial clustering centres; (2) include each point in the nearest class according to the proximity principle, and then calculate the average value of each class as the new cluster centre; (3) Repeat step (2) until the clustering converges, the cluster centre stops changing, the iterative procedure comes to an end, all the data are sorted into the appropriate clusters, and the clustering is finished.
3. Results and discussion
3.1. Temporal behaviour of hikers
3.1.1. Interannual Behavioural characteristics
The time distribution of the obtained hiking trajectories in Northwest Yunnan spanned 13 years from January 2010 to December 2022. The number of hiking trajectories for each year was counted, and the results are shown in .
Figure 2. Annual change in the number of hikers’ trajectories.
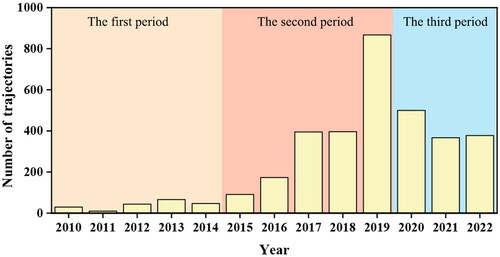
From the year of 2010 to 2014, the number of hiking trajectories in Northwest Yunnan was fluctuating. Since the application of VGI in hiking tourism was still in its initial stage during this period (Wang et al. Citation2018), the number of trajectories was generally low and did not exceed double digits. Thus, this period was considered as the first stage of hiking tourism development in Northwest Yunnan. The number of trajectories increased rapidly during 2015–2019, which was the second stage. In 2015, the number of trajectories quadrupled compared to five years earlier. Then, 2016 saw a sudden increase in the number of trajectories to 173, nearly double the number of the previous year. The number of 2018 and 2017 is basically the same, and in 2019, the number of trajectories doubled again to 867, making it the year with most trajectories ever. According to calculation, both 2017 and 2019 approximately double the previous year. However, most likely caused by the epidemic of COVID-19, the number of hiking trajectories dropped by about 40% in 2020 and 26.6% in 2021. Probably with the improvement of the epidemic situation, the number remained at about 370 in 2021 and 2022.
Overall, according to the changes in the number of trajectories and the realistic background of hiking tourism in Northwest Yunnan, the development of hiking tourism over the past thirteen years in Northwest Yunnan can be divided into three stages: the first stage (2010–2014), the second stage (2015–2019) and the third stage (2020–2022). Despite the fluctuations in the third stage partially due to COVID-19, hiking tourism in Northwest Yunnan showed a positive trend in the long run. Targeted marketing plans should be formulated to guide and stimulate the demand of hiking tourists, mitigate the impact of the epidemic, and promote the early recovery of hiking tourism.
The interannual behavioural characteristics of hikers reflect at some extent the development characteristics of hiking tourism in the last decades. Compared with previous studies using methods like comparative analysis and on-site research, this paper based on VGI reveals more objective results with less labours. Conducting research on time behaviours that span across years, seasons and even down to a daily level is challenging due to data acquisition difficulties. This study extends the research on the phased development of VGI in hiking tourism, making it a typical example, especially in the study of regional hiking tourism trends.
3.1.2. Seasonal and monthly behavioural characteristics
A total of 3363 hiking trajectories were counted in months over a 13-year period. The seasonal intensity index for each year of hiking tourism in Northwest Yunnan was calculated based on the number of trajectories in different months from 2010 to 2022, which ranged from 8.247 to 8.248, indicating some seasonal differences in hiking tourism in Northwest Yunnan.
As shown in , there were more than 100 hiking trajectories in Northwest Yunnan monthly, suggesting the study area was hiking hotspots in the past decade. Two small peaks (trajectories > 350) were found in May–June and September–October, respectively. Climate could be one factor, while the temperature in these two peaks is relatively suitable (8–18 °C) and rainfall is relatively low (60–900 mm monthly) (Liu et al. Citation2018; Yue et al. Citation2022). The seasonal characteristics of the landscape in each hiking destination may be another factor. For example, buckwheat flowers bloom and stellera flowers turn red from September to October, when Yubeng Village turn into a sea of flowers with mesmerizing scenery and rich colour layers. By contrast, the number of hikers is low in January and February. On the one hand, due to the high altitude of most areas in Northwest Yunnan, the low temperatures in winter causes heavy snowstorms and icy roads, which is uncomfortable and dangerous for hiking. On the other hand, the Chinese New Year, which takes place during this period, is the most important traditional festival in China. Most Chinese tend to be busy with family reunions to give up hiking during the Chinese New Year.
Figure 3. Monthly change in the number of hikers’ trajectories.
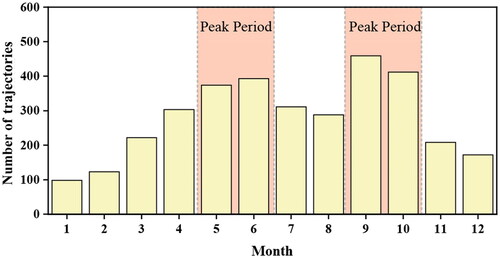
Understanding these seasonal patterns can assist local authorities and businesses in optimizing their promotional strategies and resource allocation during the peak months. Adequate preparations should be made to accommodate the surge in visitors during these periods like maintaining hiking trails to ensure trail safety and improving lodging facilities and services to meet heightened demand of hikers. Marketing initiatives and promotional campaigns can be strategically timed to coincide with these peak periods. Emphasizing the favourable weather conditions and unique experiences available during these months can attract a larger tourist influx. It is imperative to manage the environmental impact resulting from increased foot traffic during peak times. Implementing measures like waste management and visitor education is essential to safeguard the natural environment.
3.1.3. Intraday behavioural characteristics
is a line chart created based on 3363 hiking trajectories corresponding to departure and arrival times. It is intended to illustrate the peak departure and arrival times within a day, similar to rush hours during commuting. The x-axis represents departure or arrival times, and the y-axis represents the number of trajectories corresponding to different times. Among them, the dark blue line represents the number of trajectories associated with departure times, while the orange line represents the number of trajectories associated with arrival times.
Figure 4. Numbers of trajectories in different departure time and arrival time of hikers.
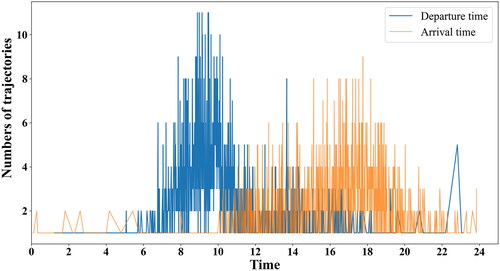
The overall departure time of hikers in Northwest Yunnan was comparatively concentrated, and there exist three departure peaks. The first peak was from 7:00 to 10:00, especially at around 9:00, which is in line with most common daily routines in Chinese (Duanmu and Chai Citation2021). The sharp decline in the number of departures around 12 O’clock may be attributed to the rising temperature and the lunchtime break. The second departure peak was around 14:00, usually when people were well-slept and refreshed after having had a lunch break. The third peak was between 22:00 and 23:00. Hikers of this type were usually night climbers, engaging in activities such as nighttime exploration and sunrise watching (Liu et al. Citation2022). The arrival time was relatively scattered, with distribution from 10:00 onwards.
In order to better identify the hiking temporal patterns, we used the method of K-Means clustering to classify the intra-day behaviour patterns of hikers in Northwest Yunnan, based on the standardized data consist of departure time, arrival time and residence time of each trajectory, and the clustering results are provided in .
Table 1. Final cluster centres.
Taking Liu and Wang et al.’s classification of micro-temporal patterns of tourists into ‘day climbing’, ‘night climbing’ and ‘all-day sightseeing’ as a reference (Liu et al. Citation2022), this article divided the temporal behaviour patterns of hiking tourism in Northwest Yunnan into three categories: ‘day hikers’, ‘morning hikers’ and ‘night hikers’. Day hikers covered more than half (55.89%) of the visitors. They had a more casual schedule of activities, with departure and arrival times during the day, and took relatively short time due to the faster pace of travel during the day. Morning hikers, accounting for 42%, usually started around 9:00 and finished before lunchtime. Night hikers, which accounted for less than 2% of hikers, often started one to two hours before sunset and ended the trek around 3:00. Watching the sunset and camping were the main activities during this type of hike and it took longer due to the increased difficulty at night.
The daily behavioural patterns of hiking tourists hold significant implications for policy formulation, tourism management and marketing strategies. In the planning of tourism activities, it becomes crucial to provide tailored hiking services that cater to different hiking modes. This, in turn, offers valuable insights for the allocation and scheduling of personnel within hiking areas. With the majority of hikers being ‘day hikers’, personnel should primarily focus on daytime operations. However, the presence of nighttime hikers introduces specific considerations, such as ensuring nighttime safety and the provision of necessary supplies. These considerations may encompass the deployment of nighttime patrol personnel and the provision of nighttime reception services. In areas with safety concerns, strategies like regulating entry and exit times for hiking areas or implementing reservation-based visitor limits can effectively manage visitor flows. These measures play a pivotal role in ensuring the safety of hiking tourists and enhancing their overall experience.
3.2. Spatial behaviour of hikers
3.2.1. Large-scale spatial behaviour: hiker sources
depicts the residences of the hikers in Northwest Yunnan. On the national level, the source of hikers in Northwest Yunnan was somewhat dispersed and distributed in most parts of the country, with more tourists from southeastern China and less from northwestern China. The dividing line between the dense and sparse areas of its source roughly coincided with the Hu Huanyong population dividing line. The places hikers often come from were municipalities such as Beijing (accounting for 10.89%), Shanghai (3.47%) and Chongqing (1.65%), provincial capitals such as Hangzhou (2.81%), Chengdu (2.15%), Xi’an (1.65%), Wuhan (1.49%) and Changsha (1.32%), as well as Shenzhen (9.08%), Guangzhou (7.26%), Zhuhai (1.65%) and other cities in the Pearl River Delta, and areas in neighbouring provinces such as southern Sichuan, western Guizhou and central Guangxi were also distributed. Within Yunnan, the main source of hiking visitors came from Kunming (14.03%), the province capital, followed by the four prefectures of Northwest Yunnan: Dali (8.25%), Lijiang (3.14%), Diqing (2.15%) and Nujiang (1.82%), then Baoshan (1.16%) in western Yunnan.
Figure 5. The national source of hikers in Northwest Yunnan.
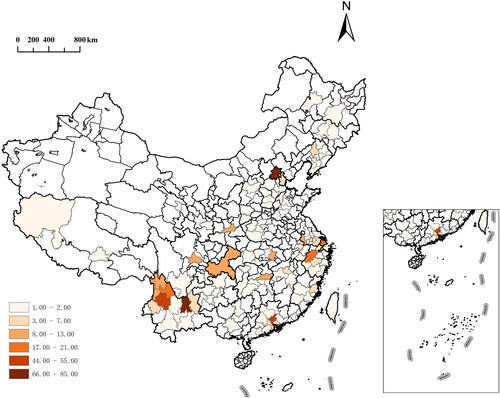
There are two possible reasons for this pattern of distribution. First, the municipalities, provincial capitals and the Pearl River Delta in China are economically developed and have large populations. Hiking tourism started early in these places and gained great popularity, having become a way of life for many local residents. Second, it follows the law of distance decay. Hiking from cities in the adjacent provinces with shorter distances to destinations in Northwest Yunnan might save time and transportation costs.
Understanding the primary regions from which hiking tourists originate can assist local governments in formulating more targeted policies. Most tourists come from economically developed cities and the surrounding areas of Northwest Yunnan. The government can consider collaborating with tourism agencies in these cities, participating in promotional events and expos to showcase hiking destinations in Northwest Yunnan. Additionally, the government can incentivize tourists from nearby cities to hike in Northwest Yunnan through policy incentives, such as offering discounted ticket prices and distributing tourism shopping vouchers. Geographic source information of hikers can also inform marketing management strategies. If the majority of hikers originate from a specific region, marketing teams can focus their efforts on promoting and advertising in that region, including placing advertisements in local media and collaborating with local travel agencies.
3.2.2. Distribution of hiking points of interest and their changes
In order to study how the spatial distribution of hiking tourism in Northwest Yunnan have changed from 2010, we used the kernel density tool to analyse the density of hiking interest points in three periods: the first stage (2010–2014), the second stage (2015–2019) and the third stage (2020–2022), as displayed in .
Figure 6. The kernel density of hiking interest points in three stages.
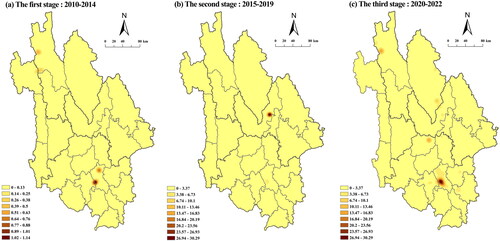
During the initial period, the distribution of hiking points of interest was more concentrated, with four gathering cores: Cangshan Mountain in Dali City, Shuanglang in Dali City, Yubeng in Deqin County and Biluo Snow Mountain in Deqin and Gongshan County. During the second stage, the distribution was more concentrated with overall density values increasing significantly and the clustering trend further enhanced. There only existed two gathering areas with high density values: the Jade Dragon Snow Mountain as the main gathering area and Dali City Cangshan Mountain as the secondary gathering area. The hiking tourism of the former witnessed the golden period in this phase. Meanwhile, Meili Snow Mountain was no longer a gathering core, probably due to the construction of the Shangri-La-Deqin highway, which made it difficult for tourists to reach the area for hiking. During the third stage, four clusters of hiking interest points were presented, namely Dali Cluster, Jianchuan Cluster, Lijiang- Shangri-La Cluster and Deqin Cluster, with new gathering points such as Jinniu in Binchuan County, Caohai in Heqing County and Luoji Township in Shangri-La. Hiking tourism in Dali Bai Autonomous Prefecture blossomed across the region, with Cangshan Mountain once again becoming the main gathering core, surrounded by new towns along the Erhai Sea such as Xiaguan Town, Yinqiao Town, Xizhou Town and Shuanglang Town. Haba Snow Mountain also became the main gathering core, extending to the south of Tiger Leaping Gorge. With the addition of Yulong Snow Mountain as a secondary gathering core, Lijiang- Shangri-La Cluster was formed. In Deqin County, the village of Yubeng also became the main gathering core, and with the addition of a new sub-core on the northern slope of Meili, the Deqin cluster was formed. Except for Nujiang, all the prefectures of Northwest Yunnan had different densities of clusters, with an overall spatial distribution pattern of ‘core - periphery’ structure.
In general, Northwest Yunnan has experienced, respectively, a ‘4 - core’ pattern, a ‘2 - core’ pattern and a ‘core-periphery structure’ distribution pattern. During the decade, Dali Cangshan Mountain and Yubeng of Deqin County have been the gathering cores for the distribution of hiking interest points, and these gathering areas should be given priority consideration in hiking tourism planning. By contrast, there were few hiking interest points near national and even world-class tourist sites such as Gaoligong Mountain, Baima Snow Mountain, Yunlong Tianchi and Pudacuo, where hiking hotspots have not formed yet. It indicates that most of the hiking tourism resources in Northwest Yunnan have not yet been discovered and utilized by hikers. Planners should pay attention to these emerging areas, explore their potential to attract more tourists, and diversify the tourism offerings.
3.2.3. Popular hiking routes and their changes
To identify the most popular routes in Northwest Yunnan, a total of 3363 trajectories were analysed using the line density tool for three phases: the first stage (2010–2014), the second stage (2015–2019) and the third stage (2020–2022), and their results are shown in , and respectively..
Figure 7. The line density of hiking trajectories: the first stage.
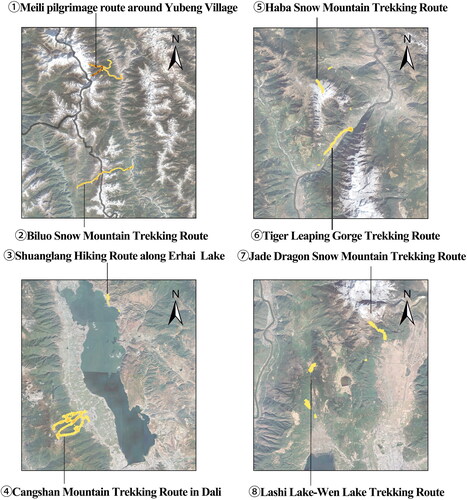
Figure 8. The line density of hiking trajectories: the second stage.
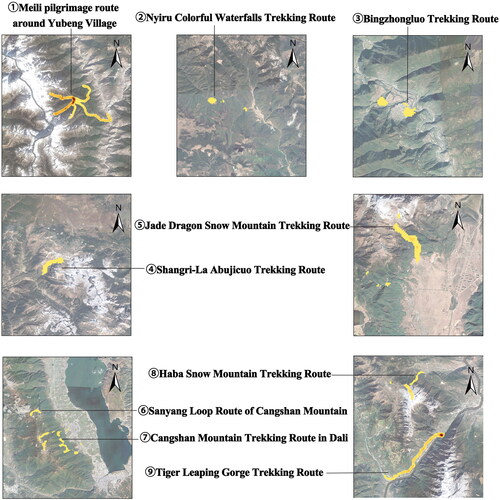
Figure 9. The line density of hiking trajectories: the third stage.
According to , there were eight popular hiking routes in the first stage. The higher the density value, the darker the colour and the more popular the route. These routes included Meili pilgrimage route around Yubeng Village, Biluo Snow Mountain Trekking Route, Shuanglang Hiking Route along Erhai Lake, Cangshan Mountain Trekking Route in Dali, Haba Snow Mountain Trekking Route, Tiger Leaping Gorge Trekking Route, Jade Dragon Snow Mountain Trekking Route, and Lashi Lake-Wen Lake Trekking Route. Especially, the line density values of the three mountain climbing routes including Meili pilgrimage route around Yubeng Village, Cangshan Mountain Trekking Route in Dali and Biluo Snow Mountain Trekking Route were listed in the top three. In addition, a total of six of the eight trekking routes were mountainous type, with mountaineering as the major activities, showing that hikers at this phase favoured mountaineering-type trekking routes. Meili pilgrimage route around Yubeng Village consisted of four branches: Upper Yubeng Village – Xiaonong Base Camp – Xiaonong Pass – Ice Lake, Upper Yubeng Village – Lower Yubeng Village – Holy Waterfall, Upper Yubeng Village – Lower Yubeng Village – Ninong Grand Canyon, Xidang Village – Nanzong Pass – Upper Yubeng Village. The line density picture of Cangshan Mountain Trekking Route was within the scope of today’s Dali-Cangshan Global Geopark. Biluo Snow Mountain Trekking Route ran southwest-northeast, spanning two townships, namely, Pengdang Township and Yanmen Township.
According to , there were nine popular hiking routes in the second stage such as Meili pilgrimage route around Yubeng Village, Nyiru Colourful Waterfalls Trekking Route, Bingzhongluo Trekking Route, Shangri-La Abujicuo Trekking Route, Jade Dragon Snow Mountain Trekking Route, Sanyang Loop Route of Cangshan Mountain, Cangshan Mountain Trekking Route in Dali, Haba Snow Mountain Trekking Route, and Tiger Leaping Gorge Trekking Route. Meili pilgrimage route around Yubeng Village in this phase added a new section from Upper Yubeng Village to the Holy Lake, which had not been developed yet. Due to its steep slope and rugged road, it took at least 8 h round trip, making it the most challenging hiking route among the existing ones in Yubeng. The constant rise of such new routes reflects the adventurous spirit and willingness to take risks among hikers. Biluo Snow Mountain trek declined at this stage and failed to become a popular trekking route. Possibly due to the inaccessibility caused by the backward transportation and the substitutability of a large number of similar trekking destinations, Biluo Snow Mountain lost its popularity among the original hiking tourists in this phase. Tiger Leaping Gorge Trekking Route extended from the beginning of the Middle Tiger Leaping to the southwest to Qiaotou, containing the Upper Tiger Leaping and Middle Tiger Leaping. The Middle Tiger Leaping had rapid currents and spectacular scenery, and was popular with hiking tourists for its thrilling experience. The Upper Tiger Leaping was popular with tour groups since it had the iconic Tiger Leaping Rock and relatively complete hiking trails. Therefore, the extension of the Tiger Leaping Gorge trekking route reflected to some extent the popularization trend of trekking tourism and the lowering of the trekking threshold, which means that the increasing number of novice hikers join the ranks and choose simpler and safer routes to get started.
After 2016, the density map of Cangshan Mountain hiking routes changed to a ‘π’ shaped bar, from a northeast-southwest (from the base to the top) direction to a northwest-southeast (through seven peaks) direction, indicating that the hiking routes were less concentrated with more diverse route choices. In addition, Dali-Cangshan Global Geopark was inaugurated in April 2015, while during 2015–2019, Cangshan Mountain Trekking Route in Dali were extended in several directions to the southeast, northeast and southwest, clearly exceeding the scope of Cangshan Mountain World Geopark. It implied that hikers preferred to explore less developed and sparsely populated country-type hiking destinations. In comparison, developed scenic areas were less pure and original for hikers, which posed a challenge to the development and management of hiking destinations. Sanyang Peak Loop Route of Cangshan Mountain was also added to the original route of Cangshan Mountain. It was also challenging with a total distance of about eight kilometres and a hiking elevation gain of about 1500 m. Jade Dragon Snow Mountain extended the original hiking line up to the Grand Canyon and down to Yuhu Village, forming the Yuhu Village-Locust Dam-Liusha Slope-Grand Canyon trekking route, and adding the Yushui Village - the First Peak of Jade Dragon Snow Mountain route in the southwest direction at the foot of the mountain. The Haba Snow Mountain trekking route extended to the northeast at higher altitudes and gave rise to the new trekking route around Heihai Lake to its northwest. Compared to the first stage, some new popular trekking routes emerged during the second stage that were not based on the original routes, such as Bingzhongluo Trekking Route, Nyiru Colourful Waterfalls Trekking Route, and Shangri-La Abujicuo Trekking Route.
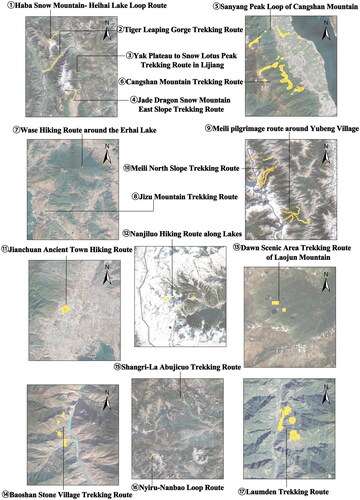
shows 17 popular hiking routes during the third stage, consisting of 11 major routes (Haba Snow Mountain- Heihai Lake Loop Route, Tiger Leaping Gorge Trekking Route, Yak Plateau to Snow Lotus Peak Trekking Route in Lijiang, Jade Dragon Snow Mountain East Slope Trekking Route, Sanyang Peak Loop of Cangshan Mountain, Cangshan Mountain Trekking Route in Dali, Meili pilgrimage route around Yubeng Village, Meili North Slope Small Circle Trail, Baoshan Stone Village Trekking Route, Shangri-La Abujicuo Trekking Route and Nyiru-Nanbao Loop Route) and 6 isolated hiking routes (Wase Hiking Route around the Erhai Lake, Jizu Mountain Trekking Route, Jianchuan Ancient Town Hiking Route, Nanjiluo Hiking Route along Lakes, Dawn Scenic Area Trekking Route of Lijiang Laojun Mountain and Laumden Trekking Route).
Meili North Slope Trekking Route consisted of two new popular sections in this phase. The Pojun Small Loop (Yagong Village - Pojun Camp - Yagong Village) was the most popular route, even more popular than the long-standing No. 1 Meili pilgrimage route around Yubeng Village. Pojun Small C Route (Yagong-Pojun-Yunnan-Tibet Border Pass-Merry Water) was also a very popular emerging route in recent years. In general, trekking in Meili North Slope was much more arduous than that in Yubeng. Jade Dragon Snow Mountain East Slope Trekking Route (Yuhu Village-Ganhe Dam-Ganhaizi Pass) emerged after the expansion at the last stage. The Snow Lotus Peak at the northeastern foot of Jade Dragon Snow Mountain was gradually being favoured by hikers due to its proximity and easiness to climb, while Yushui Village – the First Peak of Jade Dragon Snow Mountain Route became no longer popular at this stage. The overall shape of the line density map of Cangshan Mountain Trekking Route in Dali did not change much during this period, just extending to the east and west to include the ancient city of Dali. The east-west hiking route extended eastward, closer to the town of Dali at the foot of the mountain, indicating that some hikers chose to hike at the foot of the mountain for leisure, or started recording their hiking trajectories from the base. The line density of Sanyang Peak Loop was significantly higher. It extended to the northeast, covering the main road of Yinqiao to which it belongs. It indicated that increasing hikers chose Yinqiao Town as the starting or ending point of the hike, which may be related to the upgrading of facilities in Yinqiao Town according to the field research.
The Nyiru Trekking Route developed from a point distribution centred on Nyiru village during the second stage to two trekking routes, Nyiru Nanbao Loop (Nyiru Village – Nanbao Ranch) and Nyiru Colourful Waterfalls Trekking Route. Haba Snow Mountain Trekking Route was connected to the nearby Heihai Lake Trekking Route to form a loop. The Abu Jizo trekking route in the northeast side of Shangri-La’s Little Zhongdian was gradually spreading in all directions with a significant increase in density values due to its stunning scenery, enjoyable experience, and relatively easy level of difficulty. Known for the unique architecture and magnificent landscape, Baoshan Stone Village Trekking Route in the north of Lijiang City and on the banks of Jinsha River was also favoured by hikers during this period. In addition, a number of isolated popular trekking routes were formed throughout Northwest Yunnan during this period and were distributed in a scattered pattern, such as Wase Hiking Route around the Erhai Lake, Jizu Mountain Trekking Route and Jianchuan Ancient Town Hiking Route. Most of these isolated hiking routes formed late with few numbers of trajectories, or they were for leisure purpose with short distances that required less equipment and professional skills.
There are five hiking routes always with high popularity among hikers in Northwest Yunnan, including Meili pilgrimage route around Yubeng Village, Tiger Leaping Gorge Trekking Route, Haba Snow Mountain Trekking Route, Jade Dragon Snow Mountain Trekking Route and Cangshan Mountain Trekking Route in Dali. Most of the trekking routes are based on a famous tourist site like mountains and develop around them, but there are also some routes that have developed independently by virtue of their own attractiveness. At the same time there are some routes that are no longer popular due to poor proximity, poor facility support and lack of competitiveness. Routes that have consistently been popular among hikers should receive special attention in tourism planning. The government and tourism managers can allocate more resources to enhance the facilities, services and overall visitor experience on these routes. With a significant influx of hiking tourists, the protection of the natural environment becomes paramount. Planners and managers need to ensure controlled visitor numbers and implement measures to reduce negative impacts on the ecological systems of these areas. Understanding the potential of emerging hiking routes can assist tourism planners and marketing teams in attracting more visitors and diversifying tourism products. These new routes may require additional investment and improvements in facilities and services to meet visitor demands. For routes located in remote areas with limited support and low competitiveness, the government can consider measures to enhance their accessibility and attractiveness. This may involve improving transportation links, providing more convenience facilities, and conducting promotional activities. Cross-regional collaborative planning can encourage visitors to explore broader regions. By connecting multiple gathering areas that share similar paths, it can promote visitor flow and enhance the overall competitiveness of the entire tourism region.
4. Conclusion
This study analysed the temporal and spatial behaviour characteristics of hiking tourism in the southeastern margin of Qinghai-Tibet Plateau by crawling the VGI from the 2bulu platform, and found that the dramatic increase in the number of hikers required great attention to their spatial-temporal behaviours. The temporal behaviours of hikers gave great implications for policy-making and tourism marketing. The development of hiking tourism in the southeastern margin of Qinghai-Tibet Plateau consisting of three stages presented an upward trend despite temporary fluctuations caused by the pandemic. It was implied that the government should implement policies to stimulate tourist demand, mitigate pandemic effects and accelerate hiking tourism recovery. Certain seasonality existed in hiking travellers’ trips, with peak periods in May–June and September–October each year, and low number of hiking tours in Northwest Yunnan from January to February. The intra-day behaviour patterns were explored by clustering analysis that most of the hikers were ‘day hikers’ (55.89%), followed by ‘morning hikers’ (42.19%) and ‘night hikers’ (1.92%). The identification of temporal patterns guides local authorities and businesses in allocating resources accordingly and launching hiking products and services appropriately during both inter-annual and intra-day peak periods.
According to the kernel density analysis, the hiking interest areas mainly include the Dali cluster, Lijiang-Tiger Leaping Gorge cluster and Deqin cluster. According to the line density analysis, there were five hiking routes always with high popularity among hikers in Northwest Yunnan, including Meili pilgrimage route around Yubeng Village, Tiger Leaping Gorge Trekking Route, Haba Snow Mountain Trekking Route, Jade Dragon Snow Mountain Trekking Route and Cangshan Mountain Trekking Route in Dali. It was found that the source of hiking tourism in the southeastern margin of Qinghai-Tibet Plateau was somewhat dispersed and distributed in most parts of the country, and the dividing line between the dense and sparse areas of its source roughly coincided with the Hu Huanyong population dividing line. Hikers in the southeastern margin of Qinghai-Tibet Plateau preferred the hiking routes with mountain climbing as the main activity. It was particularly interesting to note that hikers there favoured off-the-beaten-path countryside and secret areas, and once a hiking destination was developed as a scenic area, hikers often chose to explore around, created new routes or even abandoned their original hiking destination. Understanding the spatial distribution of interest points and popular routes can assist local governments in formulating more targeted policies in terms of regional collaboration and incentive measures. It also provides information for tourism planners about key regions and programs as well as their developing measures.
In conclusion, this study reveals the indispensability of clarifying the spatial-temporal behaviour of hikers in the southeastern margin of Qinghai-Tibet Plateau, which provides significant reference for the sustainable growth in the southeastern margin of Qinghai-Tibet Plateau. Whereas, considering the uncontrollability of the uploading process and the inevitable errors of VGI, it is necessary to validate the results of this study by combining traditional questionnaires and interviews in further studies. Furthermore, this region contains many hiking destinations where hikers might have their specific microscopic spatial-temporal behavioural characteristics of hikers in the Northwest Yunnan, so it can be studied in more detail and depth in the future.
Disclosure statement
The authors declared that they have no conflicts of interest in this work.
Data availability statement
The data that support the findings of this study are available on request from the lead author.
Additional information
Funding
References
- Adler J. 1989. Origins of sightseeing. Ann Touris Res. 16(1):7–29. doi: 10.1016/0160-7383(89)90028-5.
- ArcGIS Desktop: ArcMap Guidelines for Kernel Density. 2021. California, USA: Esri Company; [accessed 2023 July 11]. https://desktop.arcgis.com/en/arcmap/latest/tools/spatial-analyst-toolbox/kernel-density.htm#.
- Bielański M, Taczanowska K, Muhar A, Adamski P, González L-M, Witkowski Z. 2018. Application of GPS tracking for monitoring spatially unconstrained outdoor recreational activities in protected areas – A case study of ski touring in the Tatra National Park, Poland. Appl Geogr. 96:51–65. doi: 10.1016/j.apgeog.2018.05.008.
- Chhetri P. 2015. A GIS methodology for modelling hiking experiences in the Grampians National Park, Australia. Tour Geogr. 17(5):795–814. doi: 10.1080/14616688.2015.1083609.
- Cui F, Zhang J, Yang Y. 1997. About the time-space distribution regularities of tourism demands and the features of tourists behaviors in MT. Tai tourist region. Econ Geogr. 3:62–67.
- Davies N. 2018. Who walks, where and why? Practitioners’ observations and perspectives on recreational walkers at UK tourist destinations. Ann Leis Res. 21(5):553–574. doi: 10.1080/11745398.2016.1250648.
- Duanmu YB, Chai YW. 2021. Time use research of workers’ daily activities in Beijing: a comparison between 2007 And 2017. Hum Geogr. 36(2):136–145.
- Fang Y, Huang Z, Hou B, Wang F. 2014. The periodic and fluctuant characteristics of Chinese inbound tourists and its influence mechanism. Geogr Res. 33(10):1942–1955.
- Farías Torbidoni EI. 2011. Managing for recreational experience opportunities: the case of hikers in protected areas in Catalonia, Spain. Environ Manage. 47(3):482–496. doi: 10.1007/s00267-010-9606-z.
- Figueroa-Alfaro RW, Tang Z. 2017. Evaluating the aesthetic value of cultural ecosystem services by mapping geo-tagged photographs from social media data on Panoramio and Flickr. J Environ Plann Manage. 60(2):266–281. doi: 10.1080/09640568.2016.1151772.
- Fondren KM, Brinkman R. 2022. A comparison of hiking communities on the Appalachian and Pacific Crest Trails. Leis Sci. 44(4):403–420. doi: 10.1080/01490400.2019.1597789.
- Gimblett R, Lynch J, Daniel T, Ribes L, Oye G. 2003. Deriving artificial models of visitors from dispersed patterns of use in the Sierra Nevada Wilderness, California. J Nat Conserv. 11(4):287–296. doi: 10.1078/1617-1381-00060.
- Goličnik B, Ward Thompson C. 2010. Emerging relationships between design and use of urban park spaces. Landsc Urban Plan. 94(1):38–53. doi: 10.1016/j.landurbplan.2009.07.016.
- Gómez-Martín MB. 2019. Hiking tourism in Spain: origins, issues and transformations. Sustainability. 11(13):3619. doi: 10.3390/su11133619.
- Goodchild MF. 2007. Citizens as sensors: the world of volunteered geography. GeoJournal. 69(4):211–221. doi: 10.1007/s10708-007-9111-y.
- Hallo JC, Manning RE, Valliere W, Budruk M. 2005. A case study comparison of visitor self-reported and GPS recorded travel routes. Proceedings of the 2004 Northeastern Recreation Research Symposium; March 31–April 2; Bolton Landing, New York. Newtown Square (PA): USDA Forest Service, Northeastern Research Station.
- He B, Liu K, Xue Z, Liu J, Yuan D, Yin J, Wu G. 2021. Spatial and temporal characteristics of urban tourism travel by taxi-a case study of Shenzhen. IJGI. 10(7):445. doi: 10.3390/ijgi10070445.
- Hochmair HH, Cucinella J, Stein TV. 2012. Identification of environmental, managerial, and sociodemographic correlates of hiker volume on the Florida National Scenic Trail. Am J Health Promot. 27(1):e37–e46. doi: 10.4278/ajhp.110401-QUAN-142.
- Holyoak N. 2009. Modelling self-drive tourist travel patterns in desert Australia. In The 32 Australasian transport research forum e ATRF 2009. Auckland, New Zealand
- Huang Q, Ou G, Liu X. 2016. Research on sports tourism resources in Northwest Yunnan. Sports Cult Guid. 9:123–127.
- Huang Q, Xia L. 2016. Inspection of spatial-temporal behavior of backpackers in Beijing based on trajectory. Wireless Pers Commun. 87(4):1337–1356. doi: 10.1007/s11277-015-3056-0.
- Huang X. 2005. Comparative study on international and domestic characteristics of hiking. World Reg Stud. 3:72–79.
- Huang X. 2011. Tourists spatial-temporal behavior study. Beijing, China: China Travel & Tourism Press.
- Jeong YH. 2014. Analyzing behavior tracking and movement patterns of walking tourists in urban village streets using smart phone application. Journal of Tourism Sciences. 38(5):37–58.
- Koutsias N, Balatsos P, Kalabokidis K. 2014. Fire occurrence zones: kernel density estimation of historical wildfire ignitions at the national level, Greece. J Maps. 10(4):630–639. doi: 10.1080/17445647.2014.908750.
- Lai PC, Li CL, Chan KW, Kwong KH. 2007. An assessment of GPS and GIS in recreational tracking. J Park Recreat Adm. 25(1):128–139.
- Liang J, Zhao M, Shen P. 2019. Clustering of rural hiking tourism communities in city outskirts based on GPS data. Tour Trib. 34(8):129–140.
- Liu Q, Wang L, Liu Y, Sun J. 2018. The decline in radial growth of Larix potaninii in Northwest Yunnan and its driving factors under the background of climate warming. Clim Environ Res. 23(5):513–523.
- Liu W, Wang B, Yang Y, Mou N, Zheng Y, Zhang L, Yang T. 2022. Cluster analysis of microscopic spatio-temporal patterns of tourists’ movement behaviors in mountainous scenic areas using open GPS-trajectory data. Tourism Manage. 93:104614. doi: 10.1016/j.tourman.2022.104614.
- Liu Y, Bao J, Huang Y, Zhang Z. 2019. Study on spatio-temporal behaviors of self-driving tourists based on GPS data: a case study of Tibet. World Reg Stud. 28(1):149–160.
- Ma W, Wang J, Ma Y, Zhang J. 2021. An improved K-means clustering method for DBH extraction from point cloud. Sci Surv Mapp. 46(9):122–129.
- Manning RE, Valliere W. 2001. Coping in outdoor recreation: Causes and consequences of crowding and conflict among community residents. J Leis Res. 33(4):410–426. doi: 10.1080/00222216.2001.11949952.
- Ming Q, Tong S. 2016. Yunnan geography. Beijing, China: Beijing Normal University Publishing Group.
- Orellana D, Wachowicz M. 2011. Exploring patterns of movement suspension in pedestrian mobility. Geogr Anal. 43(3):241–260. doi: 10.1111/j.1538-4632.2011.00818.x.
- Ostermann F. 2009. Indicators for socially sustainable park use: results from a case study.
- Potter FI, Manning RE. 1984. Application of the wilderness travel simulation model to the Appalachian Trail in Vermont. Environ Manage. 8(6):543–550 doi: 10.1007/BF01871580.
- Qian K, Bao W, Li C, Si W. 2012. Application of K-mean cluster analysis in flood forecasting. Water Resour Power. 30(5):41–44.
- Qin H, Tang Y. 2014. Study of tourism seasonality in Sichuan Province based on seasonality index. Resour Dev. 30(3):374–377.
- Quinlan Cutler S, Carmichael B, Doherty S. 2014. The Inca Trail experience: does the journey matter? Ann Touris Res. 45:152–166. doi: 10.1016/j.annals.2013.12.016.
- Outdoor Industry Association. 2021. 2021 Outdoor participation trends report. https://www.outdoorswa.org.au/wp-content/uploads/2023/05/.
- Outdoor Industry Association. 2022. 2022 Outdoor participation trends report. https://www.outdoorswa.org.au/wp-content/uploads/2023/05/.
- Outdoor Industry Association. 2023. 2023 Outdoor participation trends report. https://outdoorindustry.org/resource/2023-outdoor-participation-trends-report/.
- Ruiz Reina MA. 2021. Spatio-temporal clustering: neighbourhoods based on median seasonal entropy. Spatial Stat. 45:100535. doi: 10.1016/j.spasta.2021.100535.
- Seaman DE, Powell RA. 1996. An evaluation of the accuracy of kernel density estimators for home range analysis. Ecology. 77(7):2075–2085. doi: 10.2307/2265701.
- Shechter M, Lucas RC. 1978. Simulation of Recreational Use for Park and Wilderness Management. Baltimore (MD): johns Hopkins.
- Shoval N, McKercher B, Birenboim A, Ng E. 2015. The application of a sequence alignment method to the creation of typologies of tourist activity in time and space. Environ Plann B Plann Des. 42(1):76–94. doi: 10.1068/b38065.
- Silverman BW. 1986. Density estimation for statistics and data analysis. New York (NY): Chapman and Hall.
- Smith I, Velasquez E, Norman P, Pickering C. 2023. Effect of the COVID-19 pandemic on the popularity of protected areas for mountain biking and hiking in Australia: insights from volunteered geographic information. J Outdoor Recreat Tour. 41:100588. doi: 10.1016/j.jort.2022.100588.
- Sørensen F, Sundbo J. 2014. Potentials for user-based innovation in tourism: the example of GPS tracking of attraction visitors. Handbook of research on innovation in tourism industries. Cheltenham, Northampton: Edward Elgar; p. 132–150.
- Spencer DM, Kim DK, Nelson CM, Holecek DF. 1999. Characteristics and behaviour of tourists who use trails. Curr Issues Tour. 2(2–3):174–196. doi: 10.1080/13683509908667850.
- Stopher PR, Greaves SP. 2007. Household travel surveys: where are we going? Transp Res Pt A-Policy Pract. 41(5):367–381. doi: 10.1016/j.tra.2006.09.005.
- Urry J. 2007. Mobilities. Cambridge: Polity Press.
- Wang H. 2021. Research on the network structure of tourism flow in Northwest Yunnan based on digital footprint [master’s thesis]. Yunnan, China: Yunnan Normal University.
- Wang Q, Wang C, Wang D. 2018. VGI technology research progress and its application in tourism industry. Areal Res Dev. 37(5):89–94 + 117.
- Wang Z, Fang Z. 2021. Spatial behavior patterns and evolution characteristics of hikers based on GPS data: a case study of the Wugong Mountain in Jiangxi Province. Areal Res Dev. 40(6):118–122 + 146.
- Wolf ID, Brown G, Wohlfart T. 2018. Applying public participation GIS (PPGIS) to inform and manage visitor conflict along multi-use trails. J Sustain Tourism. 26(3):470–495. doi: 10.1080/09669582.2017.1360315.
- Xie Y, Fan Y. 2017. Tourist experience on a body perspective: grounded theory analysis on trekking writings and interviews. Hum Geogr. 32(4):129–137.
- Xu D, Cong L, Wall G. 2019. Tourists’ spatio-temporal behaviour and concerns in park tourism: giant Panda National Park, Sichuan, China. Asia Pac J Tour Res. 24(9):924–943. doi: 10.1080/10941665.2019.1653336.
- Ye Q. 2016. Research on college students’ hiking behaviors intention and its influencing factors [master’s thesis]. Yuelu, China: Hunan Normal University.
- Yu P. 2011. Markov chain analysis of tourist spatial-temporai behavior [master’s thesis]. Dalian, China: Dongbei University of Finance and Economics.
- Yue W, Chen F, Yuan Y, Yu S, Gao Z, Zhao X. 2022. The decline in radial growth of Larix potaninii in Northwest Yunnan and its driving factors under the background of climate warming. Acta Ecol Sin. 42(6):2331–2341.
- Yun HJ, Kang DJ, Lee MJ. 2018. Spatiotemporal distribution of urban walking tourists by season using GPS-based smartphone application. Asia Pac J Tour Res. 23(11):1047–1061. doi: 10.1080/10941665.2018.1513949.
- Zhou H. 2009. Special tourism development study of Qinghai-Tibet Plateau [master’s thesis]. Qinghai, China: Qinghai Normal University.
- Zhu X. 2006. PPT strategy and backpacker tourism-a case study of Northwest Yunnan Province. Hum Geogr. 3:62–66.
- Zhu X. 2007. Backpacker tourism: theoretical and empirical study based on China [dissertation]. Shanghai, China: East China Normal University.
- Zürcher S, Jackowski C, Schön CA. 2020. Circumstances and causes of death of hikers at different altitudes: a retrospective analysis of hiking fatalities from 2003–2018. Forensic Sci Int. 310:110252. doi: 10.1016/j.forsciint.2020.110252.