
 ?Mathematical formulae have been encoded as MathML and are displayed in this HTML version using MathJax in order to improve their display. Uncheck the box to turn MathJax off. This feature requires Javascript. Click on a formula to zoom.
Abstract
Under the combined action of the expansion of the chemical industry zone and urban boundaries, urban areas exposed to danger are also increasing. As containers for chemical storage, storage tanks are potential sources of hazards. Conducting target detection for hazard risk analysis is essential. YOLOv5, a single-stage algorithm with good performance, accurately identifies most storage tanks with clear contours and evident positions; however, the identification effect is not good for storage tanks with small targets or unclear boundaries. This study proposes an optimized model based on the YOLOv5 model. First, the Coordinate Attention (CA) mechanism is introduced to make the model focus on the effective information of the target. Second, to improve the detection effect of small targets, the model adds a small target detection head and performs multiscale target detection. Finally, the EIOU loss function is employed instead of the CIOU loss function in the original model to improve the algorithm’s accuracy and speed. Experimental results show that the optimized model significantly improves the detection effect on small targets compared with the original YOLOv5 model. The number of small targets detected by the optimized model is significantly increased compared with the original model, and the size of the smallest targets detected by the optimized model is reduced by about twice compared with the original model. The model’s accuracy, recall rate, and mean average precision ([email protected]) are improved, which can be better applied to the detection of storage tanks.
1. Introduction
With societal progression and city development, the scale of the city is constantly expanding, and the distance between dangerous chemical enterprises or chemical industry zones distant from the city and the city is constantly decreasing. Under the combined action of the expansion of the chemical industry zone and urban boundaries, urban areas exposed to danger are also increasing. Because a large number of flammable and explosive substances are stored in enterprises that constitute the hazardous source of hazardous chemicals, after an accident occurs, the consequences are serious and unavoidably affect the urban area. For potential hazard source target detection, similar to storage tank detection, conducting hazard analysis and accident risk prevention is important.
Recently, with the rapid development of high-resolution remote sensing image-processing technology, research on object recognition based on remote sensing images has made significant progress. Deep learning, a recently booming development method, has evident advantages over traditional methods. The convolutional neural network (convolutional neural network, CNN) especially has considerable advantages in terms of image feature extraction. The storage tank is used to store oil and gas containers. Based on their architectural characteristics, they can be divided into aboveground, underground, and peak tanks, and depending on the material, they can be divided into metal and non-metallic tanks. Metal tanks are generally divided into vertical cylindrical, horizontal cylindrical, and spherical types, according to their shapes. Metal oil tanks are widely used because of their advantages, such as low cost, ease of leakage, and ease of maintenance. The most commonly used are cylindrical oil tanks with an arch tank (fixed roof tank) and a floating roof tank, which were also the main research objects in this study.
With the continuous improvement in GPU performance and the infinite expansion of computer storage capacity, deep learning technology has undergone unprecedented development. In the field of target detection, the current mainstream algorithms are mainly divided into one- and two-stage algorithms. The core idea of the two-stage target detection algorithm is first to generate candidate regions through common region selection algorithms and then perform feature extraction and regression classification in the candidate regions based on convolutional neural networks. Such algorithms have high accuracy but relatively slow detection speeds. Typical algorithms include the R-CNN (Girshick et al. Citation2014), Fast R-CNN (Girshick Citation2015), Faster RCNN (Ren et al. Citation2017), and Mask R-CNN (He et al. Citation2020). The single-stage object detection algorithm does not directly generate the region of interest. However, it treats the object detection task as a regression task for the entire image and uses a convolutional neural network to directly predict the position and category of the object for an image. The advantage of this algorithm is that it runs quickly, but it is usually not as good as two-stage detection algorithms, such as the SSD (Liu et al. Citation2016) and Yolo series (Redmon et al. Citation2016; Redmon and Farhadi Citation2017, Citation2018; Bochkovskiy and Wang Citation2020).
In order to realize the feature fusion between multisource data and improve the information extraction ability of the model in complex scenes, domestic and foreign scholars have done a lot of researches. Wang et al. (Citation2023) proposed a method based on multiscale interactive information extraction (MIFNet) for hyperspectral and synthetic aperture radar (SAR) image classification, developed a global dependence fusion module (GDFM) based on a multiscale interactive information extraction (MIIE) block to realize the fusion of multi-source data and obtain richer scale information. Zhang et al. (Citation2023) proposed a spatial-logical aggregation network (SLA-NET) with morphological transformation for tree species classification, which effectively embedded morphological operators with trainable structuring elements. Roy et al. (Citation2023) proposed WilDect-YOLO, a deep learning (DL)-based automated high-performance detection model for real-time endangered wildlife detection. Residual blocks were introduced into the CSPDarknet53 backbone network, and DenseNet blocks were integrated to improve in preserving critical feature information. The accuracy of detection of endangered wildlife is due to the current state-of-the-art models. Jiang et al. (Citation2022) proposed Multiple Graph Learning Neural Networks (MGLNN) for multiple graph learning and multi-view semi-supervised classification, and developed a general algorithm to optimize/train the proposed MGLNN model, which is superior to other related methods.
Many studies have focused on identifying the storage tank targets. The standard Hough transform (Duda and Hart Citation1972) is a pioneering method for detecting circular targets; however, this method has a large memory consumption and low timelines. Subsequent modifications were made, including improving the Hough transform based on a gradient graph (Zhao et al. Citation2015) and using a Sobel operator to optimize the extraction of edge information (Ma Citation2005). Machine learning and CNNs have been widely used for object detection in remote sensing images. Jiang (Citation2020) optimized a Faster R-CNN network by improving the feature extraction network and increasing the number of anchor frames; the detection accuracy of the oil storage tank was improved by 6.39% compared with the original network. Hao et al. (Citation2022) constructed a multistage target detection network, MMSNet, embedded with mask branches to detect and segment oil storage tanks. Li et al. (Citation2023) optimized the YOLOv5 model and proposed the TCS-YOLO model, which exhibited better recognition accuracy. Zhu et al. (Citation2012) extracted image blocks of oil storage tanks from remote sensing images based on a potential semantic analysis model and then used the Hough transform and template matching to detect the round top of oil storage tanks.
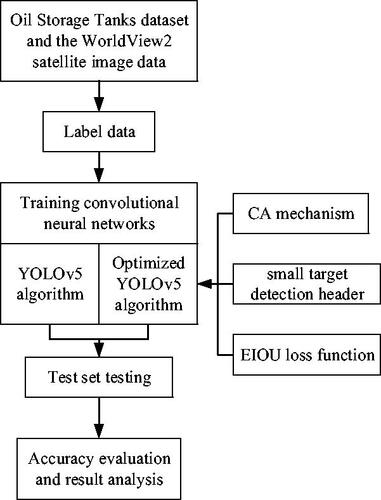
These studies have made notable achievements in different aspects; however, limitations remain in the detection of small targets and targets with unclear edges. In this study, the YOLOv5 algorithm was selected and improved on this basis, the CA mechanism (Hou et al. Citation2021) was introduced into the network structure, a small target detection header was added, and the EIOU (Zhang et al. Citation2022) loss function was used to replace the CIOU (Chen et al. Citation2023) loss function to achieve better results in small target detection and target detection with fuzzy edges. is the framework flow chart for this paper.
Figure 1. The framework flow chart of this paper.
2. Optimized model
2.1. YOLO algorithm
The YOLO algorithm is a single-stage detection algorithm that was proposed by Redmon et al. (Citation2016). This transforms the target detection problem into a regression problem. The core idea is to divide the image into a grid that predicts the category and confidence of the target; thus, the detection speed is very fast. In 2017, the team proposed YOLO9000, which can detect more than 9,000 objects in real time. The network backbone of YOLO9000 is Darknet-19, which has made many improvements, including the addition of a standardized BN layer and the introduction of an anchor mechanism. YOLOv3 is a classical single-stage detection algorithm. It replaced the backbone network with Darknet-53 and performed up sampling and dimensional splicing operations on the last layers of the network prediction, significantly improving the detection effect and accuracy. The YOLOv4 algorithm was improved by Bochkovskiy et al. (Citation2020) based on YOLOv3. A cross-stage partial network (CSPNet) (Wang et al. Citation2020) was combined with the Darknet-53 network to form CSPDarknet-53 as the network backbone. The feature extraction network consists of a pyramid-pool structure (SPP) (He et al. Citation2015) and a path aggregation network (PANet) (Liu et al. Citation2018). Training strategies were also used to train the backbone. Examples include mosaic data enhancement, self-adversarial training, DropBlock regularization, class-label smoothing, and the CIOU loss function.
YOLOv5 maintains its network structure of YOLOv4. The network model can be divided into the input, backbone, neck, and output models. A network structure diagram of YOLOV5 is shown in . However, YOLOv4 uses only the CSP structure in the backbone network, whereas YOLOv5 adds the CSP structure to the neck and replaces SPP with SPPF. Based on the size of the model, there are four versions of YOLOv5: YOLOv5s, YOLOv5m, YOLOv5l, and YOLOv5x. The weights, depths, and widths of the four models were increased successively. The YOLOv5s model was used in this study. shows the parameters of the YOLOv5 series network structure.
Figure 2. YOLOv5 network structure.
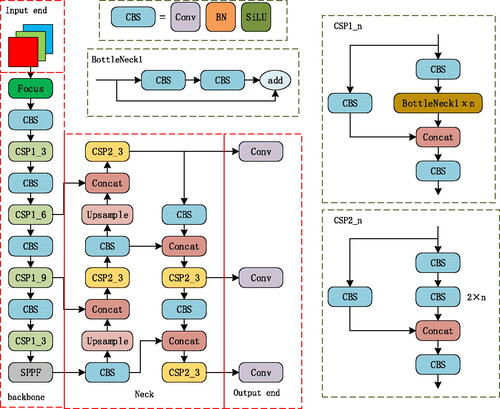
Table 1. Depth and width multiple parameters of different YOLOv5 network structures.
In the input part, YOLOv5 uses mosaic data enhancement operation to improve model training speed and network accuracy and uses adaptive anchor frame calculation and adaptive image scaling methods. Mosaic data enhancement is applied to the training stage, and the main function is to enrich the learning sample. The adaptive anchor frame calculation function is used to calculate the difference between the best anchor frame and the original anchor frame, then calculate the difference between the real frame and the predicted frame and update the network parameters by reverse iteration. Adaptive picture scaling is to scale the original picture to a unified standard size and then send it to the network for detection.
The backbone of YOLOv5 comprises focus, CONV, C3, and SPPF layers. The focus layer is a slicing operation on the feature map at the input end, reducing the width and height of the image to half of the original and increasing the number of channels by four times. The main function of the focus layer is to reduce the CUDA memory and increase the detection speed. However, YOLOv5, after v6.0, replaced the focus structure with a 6 × 6 convolution layer, which is more efficient for some existing GPU devices. The CONV layer adopts a CBL structure and consists of a Conv2d convolution layer, BatchNrom2d normalization function, and Sigmoid Linear Units (SiLU) activation function. The C3 layer was improved by the CSPNet structure, which contains three convolution layers and several bottleneck modules. It divides the feature graph into two parts, one of which performs convolution operations, and the other is spliced with the part that has completed the convolution operation. YOLOv5 designed two CSP structures: the CSP1_X structure is used in the backbone network, and the CSP2_X structure is used in the neck region. The SPPF structure is an improved SPP structure, which can solve the multiscale problem of the target to a certain extent; however, the efficiency of the SPPF structure is higher.
The neck part of YOLOv5 adopts a combination of feature pyramid networks (FPN) (Lin et al. Citation2017) and path aggregation networks (PAN). The FPN structure is top-down and fuses high-level feature information with low-level feature information via up sampling. The PAN structure adds a bottom-up path based on the FPN such that the bottom information is better integrated into the top layer, and the information of different detection layers is better integrated.
The output of YOLOv5 uses the CIOU loss function and non-maximum suppression (nms) to enhance the detection ability of blocked targets.
2.2. Optimized YOLOv5 algorithm
2.2.1. Introduction of CA mechanism
The attention mechanism originates from the study of human vision; in cognitive science, humans selectively focus on important information and ignore unimportant information. The attention mechanism in a neural network allocates computing resources to more important tasks in the case of limited computing power and solves the problem of resource overload. Coordinate Attention is a flexible and lightweight attention mechanism that considers both channel and location information and can embed vertical and horizontal location information into channel attention, enabling the CNN to pay attention to a wide range of location information without excessive computation. In the process of oil storage tank target detection, the occlusion problem between the storage tank boundaries will inevitably occur, which will affect the accuracy of detection. Therefore, it is considered to introduce attention mechanism to increase the expressiveness of the target object, focus on the important features in the image and suppress the useless features.
The implementation of the CA mechanism is shown in , which can be regarded as two parallel processes. The left and right parts show the attention situation in the high and wide directions, respectively.
Figure 3. CA mechanism module structure diagram.
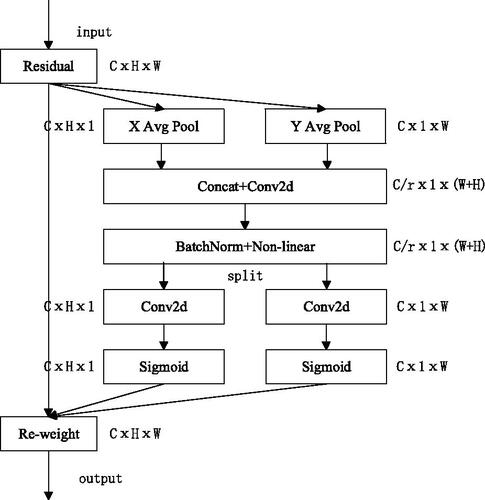
First, the feature graphs of the input dimensions generate the feature graphs of
and
by average pooling in the two directions of height and width, respectively. For a given input
the pooling convolution kernels
and
perform average pooling for each channel in the horizontal and vertical directions, respectively. Therefore, the output expression of the
channel with height h is shown as Equationequation (1)
(1)
(1) , and the output expression of the
channel with width
is shown as Equationequation (2)
(2)
(2) .
(1)
(1)
(2)
(2)
where
is the tensor of intermediate characteristics for arbitrary input.
Subsequently, the feature gaps from both directions are transposed to the same dimension and spliced. Subsequently, a shared 1 × 1 convolution is used to transform To reduce the number of network parameters, the dimensions are reduced to the original
and Equationequation (3)
(3)
(3) is as follows:
(3)
(3)
where
represents the intermediate feature graph as the shape of
represents the scaling coefficient,
represents the nonlinear activation function, and [·, ·] represents the join operation of spatial dimension. Figure
is then segmented into two separate vectors along the spatial dimension and transposed to generate vector
with dimensions
and vector
with dimensions
After two 1 × 1 convolutions,
and
are adjusted to the same channel number as in the input feature graph. Thus, the feature graphs
with dimension
and
with the dimension
are obtained. The attention weights in the height direction
and in the width direction
of the feature graph are obtained using the sigmoid activation function. The formulas are defined as follows:
(4)
(4)
(5)
(5)
Finally, the feature graphs with attention weights in the height and width directions are obtained by expanding and
The final output of the CA module can be expressed as shown in Equationequation (6)
(6)
(6) :
(6)
(6)
2.2.2. Adding a small target detection header
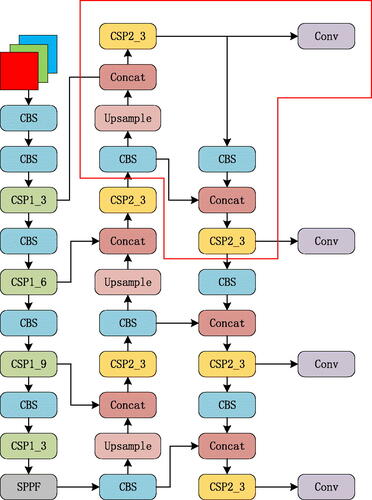
The original YOLOv5 model had three detection heads, which were used to predict the feature images of three scales at 8, 16, and 32 down sampling points. The dimensions of the feature images after the three types of down sampling were 80 × 80, 40 × 40, and 20 × 20, which were used to detect 8 × 8, 16 × 16, and 32 × 32 targets, respectively. Because the down sampling multiple is relatively large, it is difficult for the deep feature map to learn the feature information of small targets. Therefore, the detection of small storage tanks and storage tanks with fuzzy boundaries does not perform well. In view of this phenomenon, adding a small target detection layer to the original network structure is a good choice to increase the inclusiveness of the model to the scale. Thus, the network focuses more on smaller storage tank targets. After two rounds of up sampling in the original neck network, an up sampling operation was added to obtain a 160 × 160 feature graph, which was fused with the second-layer feature graph of the backbone network. A small target-detection head was then added to the detection layer. Finally, four detection heads were used to perform multiscale target detection. The improved network structure is shown in , in which the part selected in the red box represents the added structure.
Figure 4. The network structure after adding the small target detection header.
2.2.3. Loss function improvement
The loss function determines the gap between the predicted results of the model and the actual data, which is very important in the training process. Choosing the appropriate loss function is conducive to obtaining a better model as well as accelerating convergence in the training process. The training mainly includes three losses: localization, confidence, and classification losses. The total loss function is the weighted sum of the three. The positioning loss function used by YOLOv5-v4.0 and earlier versions is the GIOU (Rezatofighi et al. Citation2019) loss function, whose calculation formula is as follows:
(7)
(7)
In Equationequation (7)(7)
(7) ,
represents the prediction box,
represents the real box, and
represents the smallest external rectangular box of the two rectangular boxes. The IOU is the ratio of the intersection and union of the predicted and true frames.
The positioning loss function was used by YOLOv5-4.0 and, later, the CIOU function. The CIOU loss function considers three geometric parameters: the overlapping area, center distance, and aspect ratio, and is calculated as follows:
(8)
(8)
(9)
(9)
(10)
(10)
(11)
(11)
In Equationequations (8)–(10), and
represent the center of the prediction box and real box, respectively,
is the Euclidean distance between these two points,
represents the diagonal length of the smallest outer rectangle covering the prediction and real boxes,
is the parameter used to balance the proportions,
and h indicate the width and height of the prediction box, respectively,
and
indicate the width and height of the real box, respectively. EquationEquation (11)
(11)
(11) represents the CIOU loss.
To a certain extent, the CIOU can speed up the regression speed of the prediction box, but once it converges to the linear ratio of the height and width of the prediction box to the real box, the width and height of the prediction box cannot increase or decrease simultaneously. The EIOU loss function separates the impact factors of the aspect ratio of the prediction frame from the real frame, and the length and width of the prediction frame are calculated to solve the problems that exist in the CIOU. The EIOU is calculated as follows:
(12)
(12)
where
and
represent the width and height of the smallest external rectangle covering the predicted and real boxes, respectively.
The SIOU (Du et al. Citation2021) loss function further considers the vector angle between the real and predicted frames and consists of four parts: angle, distance, shape, and IOU costs. The final regression loss function is as follows:
(13)
(13)
where
represents the IOU cost, Δ is used to calculate the Angle and distance costs, and Ω is used to calculate the shape cost.
3. Experimental results and discussion
3.1. Experimental environment and dataset
The operating systems used in this experiment were Windows 10, CUDA11.2, and cnDNN8.1.1. The GPU used was an NVIDIA Quadro RTX 8000 with a dedicated memory of 48 GB. The YOLOv5 model was based on the Pytorch1.8.0 deep learning framework, and the programming language was Python. The settings of the training parameters of the optimization algorithm are listed in .
Table 2. Training parameter setting.
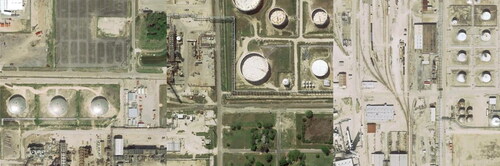
The dataset used in this experiment was obtained from the dataset of Oil Storage Tanks shared by Karl Heyer on the Kaggle platform (https://www.kaggle.com/datasets/towardsentropy/oil-storage-tanks) and from part of the WorldView2 satellite image data. The Oil Storage Tanks dataset contains 100 satellite images of industrial areas worldwide from Google Earth. The WorldView2 satellite image is a four-band bundle image with a spatial resolution of 0.5 m from parts of Suzhou, covering an area of 48 km2. After these image data were cut and labeled with LabelMe, 1060 images were obtained as the dataset used in the experiment, containing a total of 9169 oil storage tank targets. According to a ratio of 3:1, the dataset was randomly divided into training and verification sets, in which 792 images were used as the training set, containing 6276 storage tank targets, and 268 images were used as the verification set, containing 2893 storage tank targets. Part of the WorldView2 image data is shown in , and part of the oil storage tank image dataset is shown in .
Figure 5. WorldView2 satellite image.
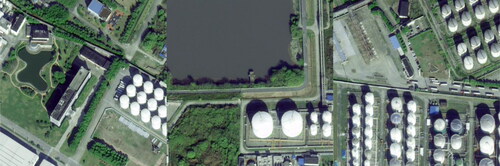
Figure 6. Partial images in the oil storage tanks dataset.
3.2. Evaluation index
Accuracy P (Precision), Recall R (Recall), and mean precision (mAP) were used to evaluate the performance of the model. AP in the mAP calculation refers to the area enclosed by a curve, where R is the horizontal axis, and P is the vertical axis. The calculation formula is as follows:
(14)
(14)
(15)
(15)
(16)
(16)
(17)
(17)
where true positive (TP) refers to a positive sample that is correctly allocated, false positive (FP) refers to a positive sample that is incorrectly allocated, and false negative (FN) refers to a negative sample that is incorrectly allocated. The [email protected] indicates the average AP for all categories when the IOU threshold is 0.5.
3.3. Experimental results
3.3.1. Experimental results by adding the CA module
The CA is a simple and flexible plug-and-play module that can be added to different locations in the YOLOv5 network. In this study, comparative experiments were conducted on the performance of adding CA modules to a model at different positions. The CA modules were added before the SPPF module and after the C3 module in the neck. The experimental results are listed in .
Table 3. The effect of CA module addition in different locations on model performance.
As shown in , the introduction of the CA attention module at different positions improved the performance of the model. By adding the CA attention module before and after the C3 module, the Precision, Recall, and [email protected] of the original model increased by 0.6%, 0.2%, and 0.5%, respectively.
3.3.2. Experimental results by adding small target detection head
A small target detection head was added to the oil storage tank detection experiment, and the detection results were compared with those of the original model, as shown in and .
Figure 7. YOLOv5 after adding a small target detection layer effect for comparison.
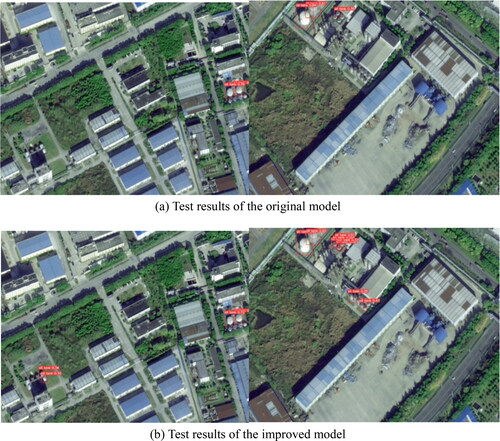
Table 4. YOLOv5 Adds a small target detection layer effect.
As shown in , the model with the addition of a small-target detection layer significantly improved the detection effectiveness of small targets. Smaller storage tanks were also detected, as shown in . As shown in , the evaluation indicators of the improved model increased to a certain extent compared to those of the original model, and the overall effectiveness of the model was better.
3.3.3. Experimental results by employing loss function CIOU
In terms of loss function improvement, considering the YOLOv5s model as an example, the GIOU, EIOU, and SIOU losses were used as positioning loss functions for comparison with the default CIOU loss of the original model to study the impact of the loss functions on the prediction results of the model. The results are summarized in .
Table 5. The influence of different positioning loss functions on the experimental results.
As presented in , when the GIOU loss was used as a positioning loss function, the Precision, Recall, and [email protected] decreased by 0.5%, 0.2%, and 0.4%, respectively, resulting in a degraded model performance. When SIOU loss was used as a positioning loss function, the Precision, Recall, and [email protected] of the original model were increased by 0.3%, 0.9%, and 0.4%, respectively, and the performance was better than that of the original model. When EIOU loss was used as a positioning loss function, the Precision, Recall, and [email protected] of the original model were increased by 0.5%, 2%, and 1.1%, respectively. The performance of the EIOU loss was better than that of the original model, as well as that of the model using SIOU loss as a positioning loss function. In conclusion, the use of the EIOU loss function as a positioning loss function can improve the accuracy of the target detection and achieve better results.
3.3.4. Experimental results of the optimized model and discussion
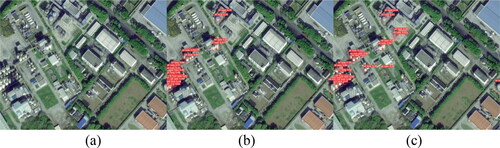
All improvements were applied to the YOLOv5 model, and the corresponding weight model was obtained through training. The weight models trained using the original YOLOv5 algorithm and the improved YOLOv5 algorithm were used to detect images containing the oil storage tank target. show the detection effectiveness for typical images. These figures (a) represent the original input images, (b) the test results of the original YOLOv5 model, and (c) the test results of the optimized YOLOv5 model. The original YOLOv5 model had a good detection performance for oil storage tanks with large volumes and clear boundaries; however, some cases of detection failures were observed, especially for small and dense oil storage tanks. The optimized YOLOv5 algorithm used in this study significantly addresses this problem to a great extent. As shown in , the optimized YOLOv5 algorithm successfully detected more small, dense oil storage tanks. In , the optimized YOLOv5 algorithm detected more small oil storage tanks with unclear edges, and their positioning were accurate.
Figure 8. Comparison of dense small target detection effect.
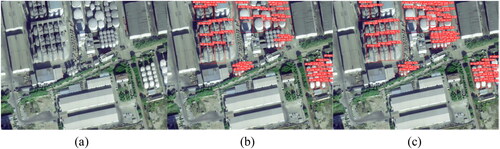
Figure 9. Image 1 of the detection effect of the small target with a fuzzy edge.
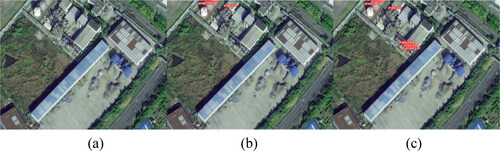
Figure 10. Image 2 of the detection effect of the small target with a fuzzy edge.
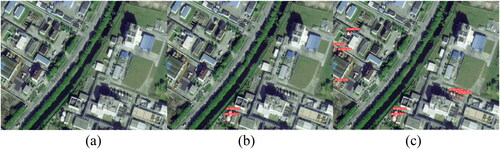
Figure 11. Image 3 of the detection effect of the small target with a fuzzy edge.
To evaluate the optimization effectiveness of each improvement module, 268 images (Section 3.1) were used for the ablation experiments. The same hyperparameters were used for each group of experiments, and the accuracy P (Precision), Recall R(Recall), and [email protected] were used as indicators to evaluate each model, where [email protected] represents the mean accuracy for all classes with an IOU threshold of 0.5. The experimental results are listed in . A comparison of PR curves is provided in .
Figure 12. PR curve comparison diagram.
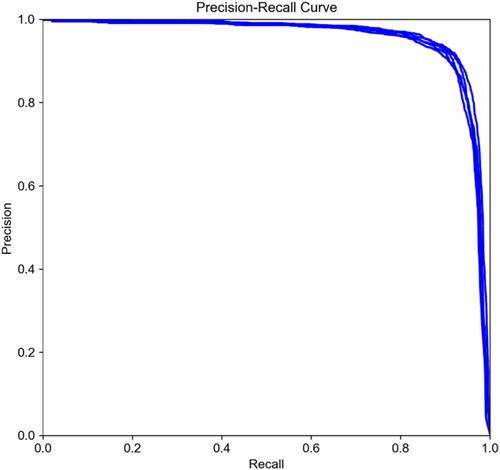
Table 6. Ablation experiment.
The single application of each module generated positive optimization to the final result, the improvement of the EIOU loss function contributed to the improvement of the model recall rate, and the addition of the CA attention module significantly contributed to the improvement of model accuracy (). When the two improvement modules were applied simultaneously, the Precision, Recall, and [email protected] of the model increased by 0.8%, 1.6%, and 1%, respectively, and the model performance was almost the best. However, the addition of a small target detection head did not improve the overall performance of the model, which may be due to insufficient sample size of small targets in the dataset used for training.
4. Conclusion
Considering the limitation of the YOLOv5 algorithm and its low accuracy in detecting small and dense targets, this study proposed an optimized model by introducing a CA mechanism, adding a small target detection layer, and an adjustment loss function to improve the detection ability of the tank target for small and dense targets. Simultaneously, the generalizability of the model was enhanced. Experimental results showed that the optimized model significantly improved the detection performance of small and dense targets and was superior to the YOLOv5 model in terms of accuracy, recall rate, and average detection accuracy. This enhances the identification of storage tanks of different sizes in practice. The primary conclusions are as follows.
Considering the problem of the unclear edge of the target, by the introduction of CA, the attention is shifted from the overall information of the target to the two dimensions of width and height to further enhance the image information and weaken the problem of unclear edge.
Adding a small target detection header makes the network focus on smaller storage tank targets and perform multiscale target detection. The experimental results showed that smaller storage tanks were detected compared with the original model.
The EIOU loss function separates the impact factors of the aspect ratio of the prediction and real frames, preventing the width and height of the prediction box from increasing or decreasing simultaneously when converging to the linear ratio of the height and width of the prediction and real boxes. Employing this as a positioning loss function in the model can improve the accuracy of target detection and achieve better results.
Experiments showed that the above improvements generated a positive impact on the model performance, and the Precision, Recall and [email protected] of the model were increased by 0.8%, 1.6% and 1%, respectively. Compared with the original model, the optimized model could detect more small targets of the same size, and the size of the smallest target that could be detected is about twice as small as the original model.
Meanwhile, the optimized model also has some weaknesses, for example, the overall accuracy, recall rate and average accuracy improvement are not obvious. This may be due to insufficient sample size of small targets in the dataset used for training. In future studies, the model can be trained with datasets containing more small targets to verify the advantages of the optimized model.
Future research can also further reduce the complexity of the model, improve its detection speed to ensure accuracy, and train and detect larger and more complex datasets such that the model can adapt to target detection in more complex environments. Future research will also use more advanced models such as YOLOv7 and YOLOv8 to improve the overall performance of target detection of oil storage tanks.
Disclosure statement
No potential conflict of interest was reported by the author(s).
Data availability statement
The first author may provide the required data upon reasonable request ([email protected]).
Additional information
Funding
References
- Bochkovskiy A, Wang CY, Liao HY Mark. 2020. YOLOv4: optimal speed and accuracy of object detection. https://arxiv.org/pdf/2004.10934.pdf
- Chen D, Miao DQ. 2023. Control distance IOU and control distance IOU loss for better bounding box regression. Pattern Recognit. 137. doi: 10.1016/j.patcog.2022.109256.
- Du SJ, Zhang BF, Zhang P, Xiang P. 2021. An improved bounding box regression loss function based on CIOU loss for multi-scale object detection. 2021 IEEE 2nd International Conference on Pattern Recognition and Machine Learning (PRML); Chengdu, China. p. 92–98. doi: 10.1109/PRML52754.2021.9520717.
- Duda RO, Hart PE. 1972. Use of the Hough transformation to detect lines and curves in pictures. Commun ACM. 15(1):11–15. doi: 10.1145/361237.361242.
- Girshick R. 2015. Fast R-CNN. 2015 IEEE International Conference on Computer Vision (ICCV); Santiago, Chile. p.1440–1448. doi: 10.1109/ICCV.2015.169.
- Girshick R, Donahue J,Darrell T, Malik J. 2014. Rich feature hierarchies for accurate object detection and semantic segmentation. 2014 IEEE Conference on Computer Vision and Pattern Recognition; Columbus, OH, United states. p. 580–587. doi: 10.1109/CVPR.2014.81.
- Hao ZH, Zhang XY, Chen ZC, Lu KX. 2022. Port storage tanks of target extraction based on convolution neural network. J Beijing Univ Information Sci Technol (Nat Sci Ed). 37(2):8–14. doi: 10.16508/j.carolcarrollnki.11-5866/n.2022.02.002.
- He KM, Gkioxari G, Dollár P, Girshick R. 2020. Mask R-CNN. IEEE Trans Pattern Anal Mach Intell. 42(2):386–397. doi: 10.1109/TPAMI.2018.2844175.
- He KM, Zhang XY, Ren SQ, Sun J. 2015. Spatial pyramid pooling in deep convolutional networks for visual recognition. IEEE Trans Pattern Anal Mach Intell. 37(9):1904–1916. doi: 10.1109/TPAMI.2015.2389824.
- Hou QB, Zhou DQ, Feng JS. 2021. Coordinate attention for efficient mobile network design. 2021 IEEE/CVF Conference on Computer Vision and Pattern Recognition (CVPR); Nashville, TN, USA. p. 13708–13717. doi: 10.1109/CVPR46437.2021.01350.
- Jiang B, Chen S, Wang B, Luo B. 2022. MGLNN: semi-supervised learning via multiple graph cooperative learning neural networks. Neural Netw. 153:204–214. doi: 10.1016/j.neunet.2022.05.024.
- Jiang YF. 2020. Research on building extraction method of high-resolution remote sensing image based on Convolutional neural network [D]. Jiaozuo: Henan University of Science and Technology. doi: 10.27116/dcnki.GJZGC.2020.000185.
- Li X, Te R, Yi F, Xu G. 2023. CTS-YOLO model for global oil storage tank inspection. Optics and Precision Engin. 31(2):246–262. doi: 10.37188/OPE.20233102.0246.
- Lin TY, Dollár P, Girshick R, He KM, Hariharan B, Belongie S. 2017. Feature pyramid networks for object detection. 2017 IEEE Conference on Computer Vision and Pattern Recognition(CVPR 2017); Honolulu, HI, United states. p. 936–944. doi: 10.1109/CVPR.2017.106.
- Liu S, Qi L, Qin HF, Shi JP, Jia JY. 2018. Path aggregation network for instance segmentation. 2018 IEEE/CVF Conference on Computer Vision and Pattern Recognition; Salt Lake City, UT, USA. p. 8759–8768. doi: 10.1109/CVPR.2018.00913.
- Liu W, Anguelov D, Erhan D, Szegedy C, Reed SE, Fu CY, Berg A. 2016. SSD: singleshot multibox detector. European Conference on Computer Vision (ECCV 2016); Amsterdam, The Netherlands. p. 21–37. doi: 10.1007/978-3-319-46448-0_2.
- Ma W. 2005. Oil depot recognition in remote sensing image [D]. Nanjing: Nanjing University of Science and Technology.
- Redmon J, Divvala S, Girshick R, Farhadi A. 2016. You only look once: unified, real-time object detection. 2016 IEEE Conference on Computer Vision and Pattern Recognition (CVPR); Las Vegas, NV, USA. p. 779–788. doi: 10.1109/CVPR.2016.91.
- Redmon J, Farhadi A. 2017. YOLO9000: better, faster, stronger. 2017 IEEE Conference on Computer Vision and Pattern Recognition (CVPR); Honolulu, HI, USA. p. 6517–6525. doi: 10.1109/CVPR.2017.690.
- Redmon J, Farhadi A. 2018. YOLOv3: an incremental improvement. arXiv:1804.02767. doi: 10.48550/arXiv.1804.02767.
- Ren SQ, He KM, Girshick R, Sun J. 2017. Faster R-CNN: towards real-time object detection with region proposal networks. IEEE Transactions on Pattern Analysis and Machine Intelligence. 39(6):1137–1149. doi: 10.1109/TPAMI.2016.2577031.
- Rezatofighi H, Tsoi N, Gwak J,Sadeghian A, Reid I, Savarese S. 2019. Generalized intersection over union: A metric and a loss for bounding box regression. 2019 IEEE/CVF Conference on Computer Vision and Pattern Recognition (CVPR); Long Beach, CA, USA. p. 658–666. doi: 10.1109/CVPR.2019.00075.
- Roy AM, Bhaduri J, Kumar T, Raj K. 2023. WilDect-YOLO: an efficient and robust computer vision-based accurate object localization model for automated endangered wildlife detection. Ecol Inf. 75:101919. doi: 10.1016/j.ecoinf.2022.101919.
- Wang CY, Liao HY Mark, Wu YH, Chen PY, Hsieh JW, Yeh IH. 2020. CSPNet: A New Backbone that can Enhance Learning Capability of CNN. 2020 IEEE/CVF Conference on Computer Vision and Pattern Recognition Workshops: IEEE/CVF Conference on Computer Vision and Pattern Recognition Workshops (CVPRW 2020); Seattle, WA, USA. p.1571–1580. doi: 10.1109/CVPRW50498.2020.00203.
- Wang JJ, Li W, Gao YH, Zhang MM, Tao R, Du Q. 2023. Hyperspectral and SAR image classification via multiscale interactive fusion network. IEEE Transact Neural Networks and Learning Syst. 34(12):10823–10837. doi: 10.1109/TNNLS.2022.3171572.
- Zhang MM, Li W, Zhao XD, Liu H, Tao R, Du Q. 2023. Morphological transformation and spatial-logical aggregation for tree species classification using hyperspectral imagery. IEEE Trans Geosci Remote Sens. 61. doi: 10.1109/TGRS.2022.3233847.
- Zhang YF, Ren WQ, Zhang Z, Jia Z, Wang L, Tai T. 2022. Focal and efficient IOU loss for accurate bounding box regression. Neurocomputing. 506:146–157. doi: 10.1016/j.neucom.2022.07.042.
- Zhao W, Yang HP, Shen ZF, Luo JC. 2015. Oil tanks extraction from high resolution imagery using a directional and weighted hough voting method. J Indian Soc Remote Sens. 43(3):539–549. doi: 10.1007/s12524-014-0440-2.
- Zhu CX, Liu B, Zhou YH, Yu QZ, Liu XZ, Yu WX. 2012. Framework design and implementation for oil tank detection in optical satellite imagery. 2012 IEEE International Geoscience and Remote Sensing Symposium; Munich, Germany. p. 6016–6019. doi: 10.1109/IGARSS.2012.6352236.