
 ?Mathematical formulae have been encoded as MathML and are displayed in this HTML version using MathJax in order to improve their display. Uncheck the box to turn MathJax off. This feature requires Javascript. Click on a formula to zoom.
Abstract
Assessing the impact of floods on crop cultivation is critical for ensuring food security and resilience in flood-prone regions. This study relied on cloud-free imagery from Landsat to construct six vegetation indices. These indices were used to conduct a comparative analysis of the flood disaster of 2022 in Pakistan. A random forest classifier was employed on pre-flood images to identify agricultural zones. A model was developed using two indices, Brightness (DBSI) and Wetness (TCW), along with the vegetative index of crop vigor (MSAVI), during the pre-flood months of 2021. The model’s accuracy was validated and exhibited an RMSE of 0.03 in predicting MSAVI values. The model was used to forecast MSAVI during post-flood periods. Spatial analysis identified approximately 30-47% of the study area as ‘Suitable’ and 46-64% as 'Highly suitable’ for early recultivation of Rabi Crops. The approach helps in planning for fast agricultural recovery in the aftermath of floods.
1. Introduction
Natural disasters, such as floods of great magnitude, can have catastrophic consequences on agricultural activities, posing immense challenges to food security and economic stability in affected regions (Dao et al. Citation2019; Rahman and Di Citation2020; Samela et al. Citation2022). Among the countries frequently grappling with such disasters is Pakistan, which experienced devastating floods in 2022 that severely impacted Balochistan and Sindh Provinces (Qamer et al. Citation2023). The two provinces of Balochistan and Sindh in Pakistan witnessed 590% and 726% higher rainfall, respectively, in August 2022 than usual for that month (Nanditha et al. Citation2023). As a result, the subsequent flood that year had a detrimental impact on the country’s economy. Out of nearly 2.06 and 4.9 million hectares of land used for agriculture in those two provinces alone, almost 0.49 and 1.94 million hectares were affected, respectively (Qamer et al. Citation2023).
The flood hit the crucial season of crops in the Kharif and Rabi seasons (Qamer et al. Citation2023). While the Kharif crops are grown in summer, starting with sugarcane in February, cotton in March-May, rice in June-July, and maize in July–August, the Rabi season begins in October and concludes in April (Haider and Ullah Citation2020). Major Rabi crops include wheat and fodder (Ahmad et al. Citation2021). During the Kharif season, rice wheat, maize wheat, cotton wheat, and sugarcane wheat are some common cropping systems (Syed et al. Citation2022). Because of the floods, the damage to major Kharif crops of rice, cotton, and sugarcane collectively suffered a direct loss of USD 1.30 billion (Qamer et al. Citation2023). This has resulted in a sudden disruption to the normal economic process and a severe hardship for many people in the region. The affected areas in these provinces are still reeling from the devastation after a year, and the recent economic condition in the country is making it harder to mitigate the disaster effectively (Waseem and Rana Citation2023). The effects of the flood continued into the Rabi season in terms of a delayed crop calendar, resulting in reduced opportunity to recover. In the wake of this disaster, the efficient identification of suitable agricultural zones for early crop resumption becomes paramount to support recovery efforts and bolster agrarian resilience.
Over the past few decades, remote sensing technologies have revolutionized disaster assessment and management, offering valuable insights into land cover changes, agricultural conditions, and the impact of natural disasters on various ecosystems (Rahman and Di Citation2017; Gumma et al. Citation2022; Kurniawan et al. Citation2022). These technologies enable the collection of information from a distance, using aerial and satellite sensors, which have proven to be particularly useful in monitoring large-scale events such as floods, wildfires, and earthquakes (Barmpoutis et al. Citation2020; Zhu et al. Citation2022). Remote sensing has become an integral part of disaster response and recovery efforts, aiding in the identification of affected areas, assessing damages, and facilitating informed decision-making by authorities and policymakers (Sanyal and Lu Citation2004; Tralli et al. Citation2005). Numerous studies have demonstrated the efficacy of remote sensing in disaster assessment and its applications in agricultural monitoring (Wójtowicz et al. Citation2016; Khanal et al. Citation2020; Pal et al. Citation2022). For instance, satellite-based data have been used to monitor land cover changes and land use patterns over time, providing valuable information about the spatial extent of different land cover types, including agricultural areas (Yuan et al. Citation2005; Frimpong et al. Citation2023). Researchers have used various satellite sensors, such as those on the Landsat, Sentinel, and MODIS platforms, to track vegetation dynamics, crop health, and soil moisture levels, which are crucial indicators for agricultural productivity and resilience (Nguy-Robertson and Gitelson Citation2015; Chandna and Mondal Citation2020).
In the context of flood disaster management, remote sensing has proved instrumental in assessing the extent of flooding and its impact on agricultural land (Chau et al. Citation2013; Saha and Agrawal Citation2020). Using multi-temporal satellite imagery, researchers can compare pre and post-disaster conditions, allowing them to identify areas affected by flood-waters and estimate the magnitude of the damage (Chen et al. Citation2014; Ghaffarian et al. Citation2021; Hinge et al. Citation2024). Studies have shown that remote sensing can effectively delineate flood extent, assess flood risk zones, and prioritize relief efforts for the affected population, including farmers who heavily rely on agriculture for their livelihoods (Rahman and Di Citation2017). Moreover, remote sensing offers real-time or near-real-time data, enabling rapid responses to disasters and supporting the coordination of emergency services (Sanyal and Lu Citation2005; Dewan et al. Citation2007). During and immediately after a flood event, satellite imagery can be used to assess the accessibility of roads and infrastructure, identify safe evacuation routes, and locate potential sites for temporary shelters and distribution centers (Sadiq et al. Citation2022; Zhu et al. Citation2022). This information is critical for disaster management agencies to allocate resources and provide timely assistance to affected communities efficiently.
This study presents a novel methodology aimed at identifying suitable areas for Rabi crop cultivation following the recession of floodwaters, utilizing remote sensing images. The primary aim is to facilitate an early path to recovery and mitigate the loss of Rabi crop production in potential future similar disasters. The research was guided by two main objectives. Firstly, it aimed to gain a comprehensive understanding of the disaster’s impact by analyzing various remote sensing indices during the transition from a pre-flood year to a flood year. Secondly, the study sought to propose a method for identifying Rabi crop suitability areas immediately after a flood event, achieved through examining the area’s long-term land cover and the remote sensing indices. This study contributes valuable insights that could significantly aid disaster response efforts and agricultural recovery strategies by employing remote sensing technologies and geospatial analysis. The identified suitable areas for Rabi crop cultivation are pivotal in facilitating the early resumption of farming activities, bolstering resilience, and mitigating the adverse consequences of future flood disasters.
2. Material and method
2.1. Study area
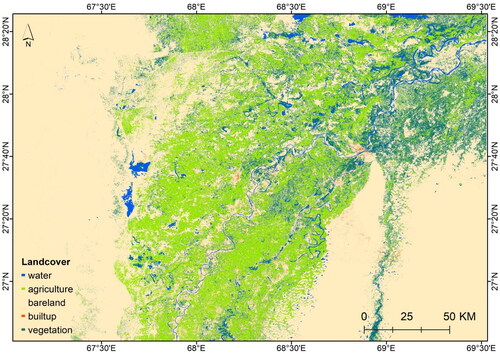
The study area, located within Balochistan and Sindh Provinces in Pakistan, spans approximately between the coordinates of 67°0’00′’ − 69°30’00′’E longitude and 26°0’00′’ − 28°20’00′’N latitude. It encompasses districts such as Nasirabad, Jhal Magsi, Jafarabad, Shikarpur, Larkana, Dadu, Naushahro Firoz, Nawab Shah, Khairpur, Sukkur, and Jacobabad (). Geographically diverse, the region ranges from arid inland areas to coastal regions, with varied climates and topography.
Figure 1. The study area.
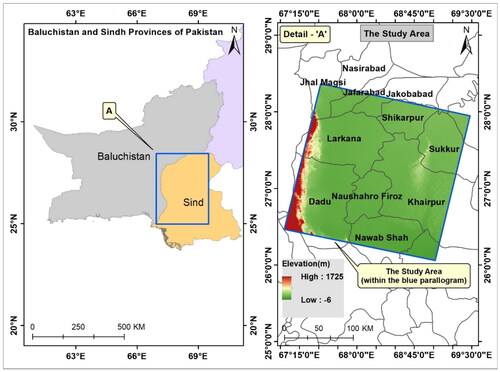
Balochistan, known for its climatic diversity, experiences temperatures ranging from around 24 °C to 42 °C, with extremes recorded at −18.3 °C and 52 °C in Quetta and Sibbi, respectively (Khan et al. Citation2021). Annual rainfall averages 18.6 cm, with variations across seasons and regions. The province’s geology comprises ancient Triassic layers, revealing diverse tectonometallic and sedimentary basins, including the Sulaiman and Balochistan basins, remnants of the Neotethys ocean (Khalid & Khanoranga, Citation2019). Significant mineral resources are found within its borders. Sindh, characterized by hot and arid climates, sees average temperatures of about 33.2 °C in summer and 17.5 °C in winter. Rainfall is scarce, with less than 250 mm annually, and coastal regions benefit from sea breezes (Zahid et al. Citation2017). Geological features include fertile plains formed by clay deposited by the Indus River, which is critical for sustaining the region’s thriving farming industry.
Topographically, the study area features diverse landscapes, including plains, steep slopes, and riverine areas. Soil erosion during floods is a significant challenge, particularly on steep slopes, impacting agricultural productivity. Effective soil and water management practices are essential for mitigating erosion and preserving soil fertility. Thus, the study area’s geographical and climatic diversity and unique geological characteristics pose challenges and opportunities for sustainable development and disaster resilience. Understanding these dynamics is crucial for implementing effective mitigation measures and enhancing resilience against natural disasters.
2.2. Methodology
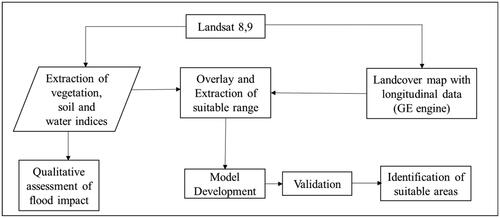
The overall methodology presented in shows the main steps involved in assessing the impact of floods and identifying suitable agricultural areas for Rabi crop cultivation using remote sensing imagery and indices. The vegetation, soil, and water indices were strategically aligned to capture critical aspects of vegetation health and soil conditions during varying flood phases pre-flood, flood, and post-flood. Each index serves a distinct purpose in providing insights into the dynamic changes experienced by the agricultural landscape are explained below:
Figure 2. A Schematic diagram of the overall methodology.
2.2.1. Data acquisition and index derivation
Landsat 8 and 9 images were downloaded at the beginning of the Rabi crop season for three years (2021, 2022, 2023) during the pre-flood, flood, and post-flood periods. The downloaded data were surface reflectance images and not top-of-atmosphere (TOA) data, which have undergone atmospheric correction as part of the standard processing pipeline. Hence, the downloaded images were directly used for the analysis without any additional corrections. The details of the data are provided in .
Table 1. Detail of the landsat 8,9 OLI-TIRS images with less than 1% cloud used for the impact analysis of floods and construction of indexes.
From the processed images, vegetation, brightness, and wetness indices were derived. The indices used were Modified Soil Adjusted Vegetation Index (MSAVI), Tasseled Cap Brightness Index (TCB), Tasseled Cap Wetness Index (TCW), Dry Bare Soil Index (DBSI), Normalized Difference Soil Index (NDSI), and Normalized Difference Water Index (NDWI).
2.2.2. Tasseled cap transformation (TCT)
TCT is a mathematical method used to transform the spectral information of satellite data into spectral indicators (Crist Citation1985). It was developed for Landsat images and is designed to understand crop development in spectral space (Crist and Cicone Citation1984). The transformation converts the original six spectral bands into six new bands, the first three representing brightness, greenness, and wetness, and the last three containing noise and ambient effects.
2.2.3. Tasseled cap brightness (TCB)
TCB reflects the overall brightness of the surface and is associated with the amount of sunlight reflected by the surface. Higher TCB values indicate brighter areas and lower values indicate darker areas. We calculate the TCB using the band weighting suggested by Crist (Citation1985).
2.2.4. Tasseled cap wetness (TCW)
TCW indicates the amount of moisture present in the soil and vegetation. Higher TCW values are associated with wetter conditions; lower values represent drier conditions. We calculate the TCW using the band weighting suggested by Crist (Citation1985).
2.2.5. Modified soil adjusted vegetation index (MSAVI)
It has been demonstrated that empirically obtained Normalized Difference Vegetation Index (NDVI) products are unstable, changing with soil color, soil moisture, and saturation effects from dense vegetation (Qi et al. Citation1994). A soil adjustment factor L was added to the denominator of the Normalized Difference Vegetation Index (NDVI) equation to create the Soil Adjusted Vegetation Index (SAVI), which was created to reduce the effects of soil on canopy spectra (Huete Citation1988; Qi et al. Citation1994) as shown in EquationEquation 1(1)
(1) .
(1)
(1)
where L is a backdrop adjustment factor for canopies. There is no longer a need for extra calibration for various soils when an L value of 0.5 in reflectance space has been discovered to reduce soil brightness variances.
For optimal adjustment of the soil effect, however, the L factor should vary inversely with the amount of vegetation present. A modified SAVI (MSAVI) that replaces the constant L in the SAVI equation with a variable L function was proposed (Qi et al. Citation1994). This is the basis of the index used in this research, as bare soil interference predominantly affects the agricultural area where the flood occurred.
2.2.6. Normalized difference soil index (NDSI)
The NDSI is sensitive to variations in soil moisture content, texture, and organic matter content, making it useful for monitoring soil moisture and soil properties in agricultural and environmental applications. It has been used with Landsat™ data to detect signature changes in un-mixing coastal marsh from satellite images (Rogers and Kearney Citation2004). For Landsat™, it is represented by EquationEquation 2(2)
(2) . For Landsat 8 and 9, B4 and B5 in EquationEquation 2
(2)
(2) had to be replaced by B5 and B6, respectively.
(2)
(2)
2.2.7. Dry bare soil index (DBSI)
An index that could help identify the bareness of the land before and after floods are DBSI. It is useful for distinguishing between the bareness of land and built-up areas. It is argued that the Digital Number (DN) of bareness and built-up classes is low in band 6 and high in band 3, and inspection of the Landsat 8 bands suggests that differentiation of these classes could be based on spectral values in the SWIR1 and Green bands (Rasul et al. Citation2018). The index is adopted from Rasul et al. (Rasul et al. Citation2018) and is as explained in EquationEquation 3(3)
(3) .
(3)
(3)
In this study, DBSI is used to explore the condition of soil brightness in the respective months of pre and post-flood periods. Overall, the MSAVI index indicated vegetation cover, while the TCB and DBSI indices provided insight into topsoil humidity and the reflectance of freshly deposited soil due to floodwaters. On the other hand, the three wetness indices, TCW, NDSI, and NDWI, were used to assess the long-term effects of water stagnation in flood-affected areas. The research assumed that the floods not only inundated crops but also had long-lasting impacts due to overland and underground waterlogging, which could be inferred from the wetness indices.
2.3. Land cover mapping and identification of agricultural areas
A landcover map of the area was produced using Landsat 8 and 9 images of less than 1% cloud cover from the period coinciding the Rabi season from three years of 2018-20 using Random Forest Classification (Gislason et al. Citation2006) in Google Earth Engine. The classes considered were ‘Water body’, ‘Bare land’, ‘Agricultural area’, ‘Vegetation’ and ‘Built Up Area’. Of the total Region of Interest (ROI)s, 80% was used for training the model, and the remaining 20% for testing the classified map. In the end, the accuracy was checked using a confusion matrix of the classes under classified and predicted classes. This map was used as a basis for identifying the agricultural areas.
2.4. Model formulation and identifying suitable areas for Rabi crops
The identified agricultural areas from the land cover map were overlaid with the six different indices to obtain the respective range of values for each index corresponding to the areas of rabi crop growth. A linear regression model was constructed using the range of values for the indices.
The formulation of the linear regression model involved using the MSAVI values from the non-flood months of the Rabi season in 2021 as the dependent variable. The six vegetation indices, namely MSAVI, TCB, DBSI, NDSI, TCW, and NDWI, were taken as the independent variables. To identify the most influential variables on MSAVI, individual scatterplots were created to compare MSAVI with each of these indices. This preliminary analysis helped identify the indices highly correlated with MSAVI during the crop growth period. Principal Component Analysis (PCA) was applied to the data to further refine the selection of important variables. PCA is a statistical technique used to reduce the dimensionality of a dataset while preserving most of its variability (Bro and Smilde Citation2014). In this case, PCA was used to identify the most critical variables explaining the variability in MSAVI during the rabi season.
The model was then tested for accuracy using the MSAVI values for January and February 2022. The Root Mean Square Error (RMSE) and Coefficient of Determination (R2) were calculated to assess the model’s accuracy. After validating the model, it was applied to predict MSAVI during the post-flood period.
Where is the predicted value of y
Where is the mean value of y
3. Results
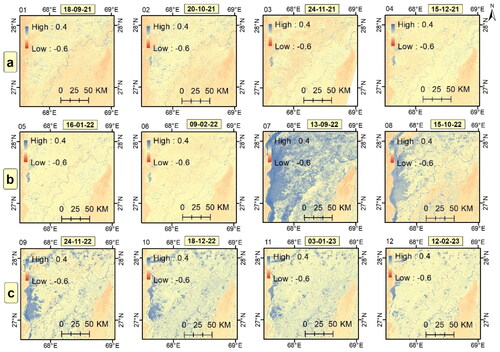
This section presents the results of the six primary indices—MSAVI, TCB, DBSI, NDSI, TCW, and NDWI—used to analyze soil and vegetation changes over time. The results illustrate the development of these indices over distinct periods and outline trends among them. Including precise time interval labels in each graph enables seamless tracking of chronological changes for all six indices, enhancing the analysis’s comprehensiveness. For instance, features labels (a), (b), and (c), representing distinct time frames: (a) 18 September 2021, to 15 December 2021, (b) 16 January 2022, to 15 October 2022, and (c) 24 November 2022, to 12 February 2023. Similarly, these labels carry the same meaning for and .
Figure 3. A Comparison of MSAVI across different dates in the period of a) 2021, b) 2022, and c) 2023.
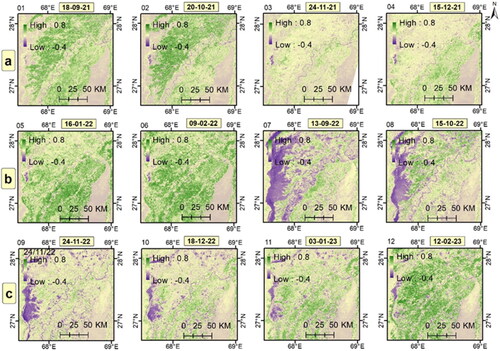
Figure 4. A Comparison of TCB across different dates in the period of a) 2021, b) 2022, and c) 2023.
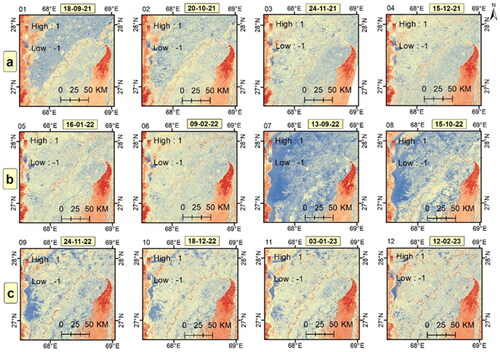
Figure 5. A Comparison of DBSI across different dates in the period of a) 2021, b) 2022, and c) 2023.
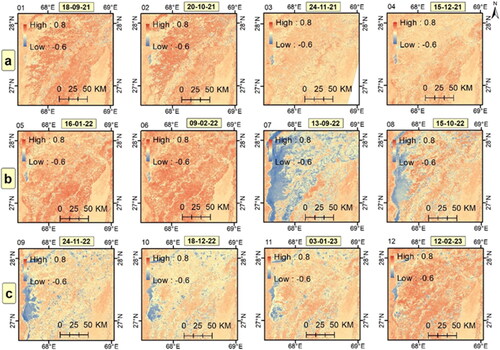
Figure 6. A Comparison of NDSI across different dates in the period of a) 2021, b) 2022, and c) 2023.
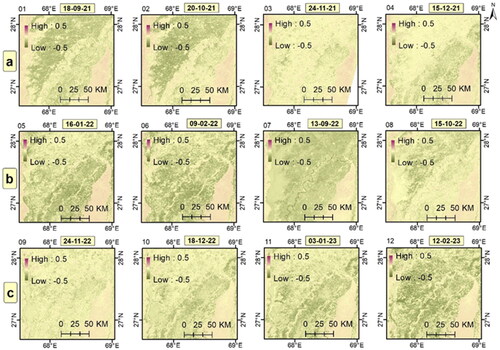
Figure 7. A Comparison of TCW across different dates in the period of a) 2021, b) 2022, and c) 2023.
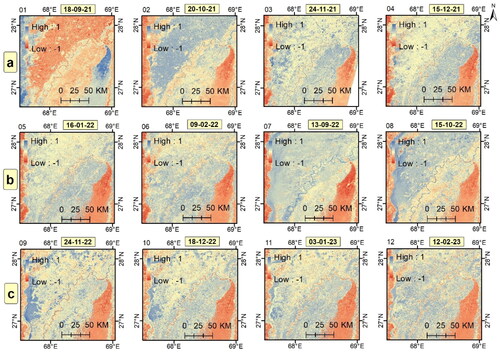
Figure 8. A Comparison of NDWI across different dates in the period of a) 2021, b) 2022, and c) 2023.
The results of the six indices are discussed in this section, with a focus on comparing different months and analyzing the rabi crop calendar from 2021. During this period, characterized by cooler temperatures and a relative lack of rain, the MSAVI index was utilized for comparative vegetation analysis. Unlike NDVI, MSAVI is preferred in our study for its reduced sensitivity to soil reflectance, making it more precise for monitoring vegetation, especially rabi crops in areas with high soil background. The predominant land cover of the area—mostly bare land with sparse vegetation and cultivated lands—justifies the choice of MSAVI for our analysis.
3.1. Index derivation
3.1.1. MSAVI
By comparing slides 02 and 08 from , the two months of October 2021 and 2022 can be a good starting point. We can see a larger area in the north of the ‘Sindh River with predominantly green pixels in 2021(slide 2). This greenness shows a decline towards January (slide 5). The same phenomenon is not observed in the next year, and only floods in a more significant portion of those areas in purple can be seen, indicating the presence of water. This has made Rabi crop cultivation a challenging task in that year. As we further look in slides 03 and 04, we see a clear pattern in terms of the changing colors from green to yellowish on the north bank of the river, indicating that the north bank may have grown a specific type of Rabi crop that was heading towards its completion and harvest. An interesting phenomenon observed is that slides 5 and 6 have seen a gradual greenness emerging towards the south of the river, indicative of a possible variety of Rabi crops gaining maturity. Slide 06 shows a prominent growth of greenness on both the banks, indicating a third kind of crop that may have reached its maturity by the beginning of Feb 2022. This same pattern is, however, observed at a much feeble rate by the following year, possibly due to the impact of floods.
3.1.2. Brightness: the tasseled cap brightness (TCB)
shows the normalized values of TCB in the respective months. High values generally correspond to brighter or more reflective areas in the image. The brightness component also detects changes in soil moisture and other environmental variables, including soil reflective properties and variations in vegetation cover quantity and quality. From slides (1 to 6), we see a gradual increase in the soil brightness as we progress towards the Rabi season. In the months of Sep. and Oct., slides (1,2), a trail of brightness along the river is observed on both banks, and it becomes weak towards the Feb. of 2022. A year later comparison of the same months reveals that TCB is somehow reduced, and water is observed in pockets after the floods. Comparing the two months of the beginning of the harvest season slides (2, 10) of the month of Oct. in 2021 and 2022, the latter year shows isolated newer areas of sudden brightness, which could indicate that the flood altered the existing soils, either removing soils from these areas or dumping upstream soil on the existing landscape.
3.1.3. DBSI
DBSI is another dryness index used to distinguish the bareness of the land and built-up areas. A comparison of this index from the TCB suggests that areas highlighted in DBSI are unnoticed in the TCB. For example, some common areas with high DBSI are prevalent in all the images, probably indicative of the urban setup across the vegetative areas (). These are the areas along the river within a buffer of about 10 km and on either side of the valley. This may indicate that the distinctive parameters that are setting the dryland from the urban setup have not quite changed due to the floods.
3.1.4. Wetness: NDSI
The Normalized Difference Soil Index (NDSI) is a wetness index used to assess soil moisture content and vegetation cover in areas with sparse vegetation. The results of NDSI are shown in . Slides (01 to 06) show negative numbers in areas where vegetation growth is predominant, indicative of the growth of the Rabi crops. This is because NIR has a higher reflectance than SWIR for vegetation. As we go towards the bare lands, the positive numbers show up in shades of magenta. In the waters inundated by floods, the values are towards zero, indicative that both NIR and SWIR have a similar reflectance in water. Regarding the ease of distinguishing the vegetative areas, the MSAVI has a higher sharpness in differentiating the shades of vegetation than the NDSI and accounts for a higher range of values for the same image. Between slides (02 and 03), we see a clear change of values from green to yellow on the river’s north bank, indicating the completion of a particular Rabi crop. The gradual decline of the greenness from slides (03 to 04) is similar to the conclusion drawn from the analysis of MSAVI that Dec. is a month when the north bank normally sees a harvest of a particular Rabi crop already.
3.1.5. TCW
TCW is an index that can be used to detect the water level in the plants during their growth. The TCW of the area in the respective dates are shown in . High TCW values could signify locations with standing water or soggy soils, neither of which may be favorable for plant growth. In , slides (01 and 02) are when the flood water has not affected the lands, and the bluish tints on the images indicate the water content in the vegetation. On the other hand, on slides (07,08, and 09), the bullish tints are not indicative of water content due to healthy vegetation but are because of the flood waters. So, with prior knowledge of the flood situation in the area, the TCW can be a good indicator of the water content in the vegetation. On the other hand, comparing the slides (11 and 12) between and , we can see the areas in a sparse vegetative setup that are witnessing a sort of dampness indicated by blueish tints in but absent in .
3.1.6. NDWI
The NDWI of the areas has proven to demarcate the water to the non-water areas in the respective images, and the spread of high flood waters can be visible in the slides (07 to 09). These are the areas where the rabi crop is cultivated, and water is present in pockets until January 2023 (slide 11). At the same time, there are open areas where water has receded and are exposed as yellow grounds starting from slide 09 onwards. Our research aimed to find if those areas could have been utilized for rabi crops purely from an agricultural and environmental point of view.
3.2. The land cover analysis
The land cover map has been prepared as shown in , using the longitudinal cloud-free data by Landsat 8 and 9 of the rabi production months (Oct.–April) for 2018, 2019, and 2020 in the Google Earth Engine. The TOA reflectance maiden values for the period had been considered for the output. A random forest classification using a supervised classification technique was used to generate the map. There are five classes under consideration, as shown. The accuracy was also tested with 20% of the testing data set with a confusion matrix with an overall accuracy of 98.5% for all the classes. This map was used to get an overview of the agricultural land in the study area.
Figure 9. Land cover of the study area.
3.3. Identifying suitable areas for Rabi crops
The agricultural areas obtained from LULC maps were overlaid with the six different indices, and the index values were further analyzed to create a linear vegetation growth model. Furthermore, the vegetation index MSAVI with these indices was compared in individual scatterplots for the non-flood months corresponding to the Rabi season 2021. The study’s results are shown in .
Figure 10. Scatterplot of MSAVI with other indices under consideration in the study area.
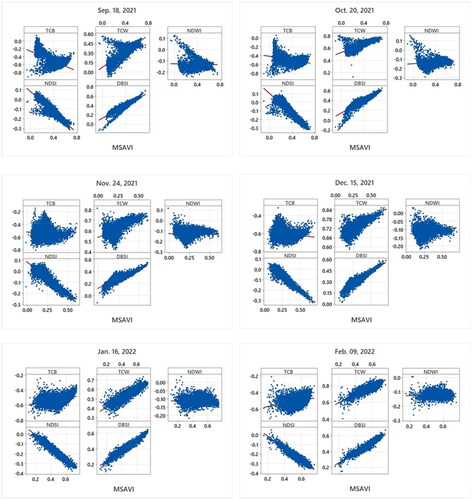
The scatterplots reveal a high correlation with TCW, NDSI, and DBSI during the crop cultivation period. The dataset was further subjected to Principal Component Analysis (PCA), and based on the largest Eigenvalues, the important variables of brightness and wetness to explain the variability in the data were explored. In all the months of analysis, it was observed that two variables of DBSI and TCW were influential. Together, these two could explain about 95% of the variability in the dataset. So, the data for the month of (Sep. –Dec.) 2021 were used to construct a linear regression model with DBSI and TCW as independent and the vegetation index MSAVI as a dependent variable. The model’s accuracy was tested for Jan. and Feb. of 2022 with the measured and predicted values of MSAVI for those months. The results have shown a Root Mean Square Error (RMSE) of 0.03. Furthermore, the MSAVI in flood is predicted with the model for the four months of (Nov. 22–Feb. 23). We picked up these months because since Nov. 2022, slide 9, flood water has started to recede, and there were visible exposed lands where rabi crop production would have been possible.
The linear relationship obtained as described is shown in EquationEquation 4Eq. (4)
Eq. (4) .
Eq. (4)
Eq. (4)
The error in the RMSE of the predicted results was considered acceptable, considering the 1.5% error (range of values from −1 to +1 and RMSE 0.03, so % of RMSE = 1.5%). Also, the R2 value of 0.97 indicates excellent performance by the model. The model was applied for four months (Nov. 22 - Jan. 23) during the flood year 2022, and the results are shown in .
Figure 11. Model output of MSAVI during the rabi crop months after the flood.
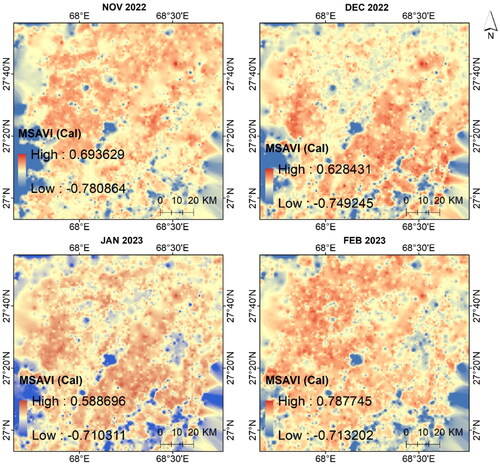
The range of values varies from −1 to +1, as indicated in the legend. The higher positive values are areas where the MSAVI would have been higher, and the hostile areas show less MSAVI in shades of blue. We tried to further classify these areas into three classes using the Natural Breaks methods on the MSAVI values, as shown in .
Table 2. Areas of suitability.
shows that out of the analyses, about 9381, 7928, 9134, and 10994 km2 areas were highly suitable for Rabi crop cultivation. At the same time, about 6286, 8044, 6671, and 5221 km2 areas were suitable, and the remaining areas were unsuitable for Rabi crop production. These constitute about (30–47) % of the area was suitable, and about (46–64) % was Highly suitable for crop production in these four months from Nov. to Feb. after the floods.
We validated the predicted output by the model by comparing the model-predicted suitability for February 2023 with the NDVI values obtained from Landsat imagery in March 2023, with a 24-day gap between them. Regions of interest (ROIs) were selected from different classes of ‘high suitable’, ‘suitable’, and ‘not suitable’ areas in the model-predicted map (). The left side map represents the model-predicted suitability for February 2023, while the right side map shows the NDVI on the ground in March 2023, with an exact difference of 24 days. These ROIs were then converted into points, and NDVI values were extracted at those points. Statistical analysis was conducted on the NDVI values in the ROI points.
Figure 12. Model validation comparing the predicted suitability for February 2023 with NDVI values obtained from landsat image in March 2023.
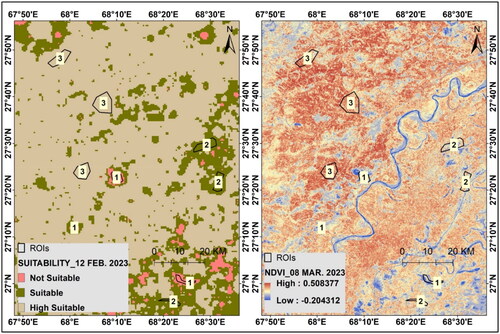
In the analysis of NDVI values across three distinct classes, designated as ‘high suitable’, ‘suitable,’ and ‘not suitable’, a one-way ANOVA test was conducted, yielding a highly significant result (F-statistic = 6990.74, p < 0.001). Consequently, the null hypothesis of no difference in mean NDVI values across these classes was decisively rejected. This finding underscores substantial statistical evidence indicating significant disparities among the mean NDVI values across the three classes of suitability. Hence, with a low p-value, we reject the null hypothesis, indicating strong evidence of a statistically significant difference between the population means. This validates the accuracy of the model’s predictions.
4. Discussion
The results presented in this study provide valuable insights into the monitoring and assessment of Rabi crop cultivation, particularly in the aftermath of extreme events like floods. In line with previous research (Guo and Gong Citation2018; Polykretis et al. Citation2020), the combination of different remote sensing indices, including MSAVI, TCB, DBSI, NDSI, TCW, and NDWI, allowed us to examine various aspects of vegetation growth, soil moisture content, and water distribution in the study area. Additionally, the land cover analysis provided a comprehensive overview of the agricultural lands, which further facilitated the analysis of rabi crop suitability. The findings of this study contribute to the understanding of the dynamics of rabi crop cultivation and offer practical implications for agricultural planning and management.
The analysis of the MSAVI index revealed interesting patterns in the growth and maturity of rabi crops during the study period. The decline in green pixels in 2022, compared to 2021, was attributed to the impact of floods in the region, indicating a significant disruption in agricultural productivity This observation aligns with previous studies by Mohammadi et al. (Citation2017) and (H. Chen et al. Citation2019), which also reported substantial decreases in vegetation indices following flood events. However, our study area exhibited resilience, with substantial portions remaining suitable for crop production despite the floods. Identifying different types of rabi crops based on changes in color and greenness on the riverbanks provided valuable information for crop monitoring and decision-making. MSAVI demonstrated its effectiveness in distinguishing different stages of Rabi crop growth and was a suitable index for monitoring vegetation in locations with a high soil background (Qi et al. Citation1994; Hu et al. Citation2021). This information is critical for farmers and agricultural authorities to optimize crop planning and resource allocation.
The TCB index plays a crucial role in detecting changes in soil moisture, vegetation cover, and reflective properties caused by floods and environmental variations. The analysis showed a gradual increase in soil brightness as the rabi season progressed, and isolated areas of sudden brightness in 2022 suggested altered soils due to the floods. This finding is consistent with previous research, which demonstrated the sensitivity of the TCB index to changes in soil moisture content (Nitze and Grosse Citation2016). Understanding such changes is essential for assessing the impact of extreme events on agricultural productivity. Moreover, the DBSI index effectively distinguished between bare land and built-up areas. It was particularly useful in highlighting urban areas along the river banks that remained unchanged despite the floods. This information can aid land-use planning and urban development strategies in flood-prone regions.
The NDSI index, used to assess soil moisture content and vegetation cover in sparse vegetation areas, complemented the MSAVI analysis findings. The comparison between the two indices helped identify the best-suited index for differentiating vegetation types during the rabi season. TCW was valuable in detecting water content in vegetation during non-flood months and provided crucial information about crop availability. However, during flood months, bluish tints in TCW images indicated floodwaters, not vegetation water content. This knowledge is essential for farmers to make informed irrigation and water management decisions.
The land cover analysis provided a comprehensive understanding of agricultural lands in the study area. Overlaying the land cover map with the six different vegetation indices allowed us to create a linear regression model for vegetation growth. The model demonstrated high accuracy and was utilized to predict the suitability of areas for rabi crop cultivation during the flood year. These predictions revealed significant portions of the study area that were highly suitable for crop production despite the floods. The results have significant implications for agricultural planning and disaster-resilient farming practices, as they indicate the potential for utilizing previously flooded lands for crop cultivation. The findings align with the growing body of literature emphasizing the importance of disaster-resilient farming practices (Islam et al. Citation2022; Tsai and Lee Citation2022). By identifying areas suitable for crop cultivation even after flooding events, this study offers practical implications for farmers to optimize crop selection and planting schedules, thereby enhancing resilience to extreme weather events and contributing to long-term agricultural sustainability.
Overall, this study demonstrates the effectiveness of remote sensing techniques and spatial analysis in monitoring rabi crop cultivation and assessing the impact of extreme events like floods on agricultural lands. The combination of different vegetation indices, such as MSAVI, TCB, DBSI, NDSI, TCW, and NDWI, provided valuable information about vegetation growth, soil moisture content, and water distribution in the study area. The land cover analysis further enhanced our understanding of the agricultural lands and enabled the prediction of suitable areas for rabi crop cultivation during the flood year. These findings have practical implications for agricultural planning, resource allocation, and disaster-resilient farming practices, ultimately contributing to the region’s sustainable crop management and food security.
Furthermore, the insights gained from this study can be utilized to develop better strategies for crop management and water resource allocation in flood-prone regions. Identifying areas that remained suitable for rabi crop cultivation even after flooding events presents an opportunity for farmers to optimize crop selection and planting schedules, considering the potential for recovery after disasters. Additionally, analyzing soil moisture and water content using remote sensing indices provides valuable information for irrigation management. By understanding water distribution in the soil and vegetation, farmers can make informed decisions about when and how much to irrigate, minimizing water wastage and maximizing crop yields.
5. Conclusion
The study aimed to harness remote-sensing images to enhance resilience in flood-affected regions, particularly in Pakistan, which suffered greatly from the deluge in 2022. Recognizing the country’s unique challenges in recovery, we sought to explore mitigation measures crucial for early planning in agricultural activities, a key phase of economic recovery post-floods. Our methodology involved developing a predictive model using two indices, Brightness (DBSI) and Wetness (TCW), alongside the vegetative index of crop vigor (MSAVI). A novel aspect of our approach was the utilization of longitudinal indices values of Brightness and Wetness, correlated with MSAVI, to construct the model, aiming to capture vegetation vigor of Rabi crops during non-flood periods. Utilizing this model, we identified suitable areas for early resumption of Rabi crops, aiding targeted agricultural recovery efforts post-floods. Spatial analysis revealed that approximately 30-47% of the study area was 'Suitable’ and 46-64% was ‘Highly suitable’ for such resumption, offering valuable insights for recovery planning.
From a policy perspective, these findings hold significant implications. The identification of suitable areas for agricultural resumption post-flood can inform decision-making processes at both local and national levels, guiding resource allocation and interventions. Moreover, the simplicity of this model, as the indices generated rely solely on remote sensing data, enhances its suitability for other areas, underscoring its potential for broader application in agricultural flood-prone regions. However, it is worth noting that while our study provides valuable insights, further research is needed to address existing limitations and enhance predictive model performance. Future studies should consider extending analysis to cover multiple years and regions with varying climatic conditions, and incorporating ground-based data to strengthen predictions. Such efforts will contribute to more effective disaster management and agricultural planning, ultimately bolstering resilience in flood-prone regions.
Disclosure statement
No potential conflict of interest was reported by the author(s).
Data availability statement
The data that support the findings of this study are available in USGS Earth Explorer at [https://gisgeography.com/usgs-earth-explorer-download-free-landsat-imagery/].
Additional information
Funding
References
- Barmpoutis P, Papaioannou P, Dimitropoulos K, Grammalidis N. 2020. A review on early forest fire detection systems using optical remote sensing. Sensors. 20(22):6442. doi: 10.3390/s20226442.
- Bro R, Smilde AK. 2014. Principal component analysis. Anal Methods. 6(9):2812–2831.
- Chandna PK, Mondal S. 2020. Analyzing multi-year rice-fallow dynamics in Odisha using multi-temporal Landsat-8 OLI and Sentinel-1 Data. GIScience & Remote Sensing. 57(4):431–449. doi: 10.1080/15481603.2020.1731074.
- Chau VN, Holland J, Cassells S, Tuohy M. 2013. Using GIS to map impacts upon agriculture from extreme floods in Vietnam. Appl Geogr. 41:65–74. doi: 10.1016/j.apgeog.2013.03.014.
- Chen H, Liang Q, Liang Z, Liu Y, Xie S. 2019. Remote-sensing disturbance detection index to identify spatio-temporal varying flood impact on crop production. Agric for Meteorol. 269-270:180–191. doi: 10.1016/j.agrformet.2019.02.002.
- Chen Y, Wang B, Pollino CA, Cuddy SM, Merrin LE, Huang C. 2014. Estimate of flood inundation and retention on wetlands using remote sensing and GIS. Ecohydrology. 7(5):1412–1420. doi: 10.1002/eco.1467.
- Crist EP. 1985. A TM tasseled cap equivalent transformation for reflectance factor data. Remote Sens Environ. 17(3):301–306. doi: 10.1016/0034-4257(85)90102-6.
- Crist EP, Cicone RC. 1984. A physically-based transformation of Thematic Mapper data—The TM Tasseled Cap. IEEE Trans Geosci Remote Sensing. GE-22(3):256–263. doi: 10.1109/TGRS.1984.350619.
- Dao PD, Mong NT, Chan H-P. 2019. Landsat-MODIS image fusion and object-based image analysis for observing flood inundation in a heterogeneous vegetated scene. GIScience & Remote Sensing. 56(8):1148–1169. doi: 10.1080/15481603.2019.1627062.
- Dewan AM, Islam MM, Kumamoto T, Nishigaki M. 2007. Evaluating flood hazard for land-use planning in greater Dhaka of Bangladesh using remote sensing and GIS techniques. Water Resour Manage. 21(9):1601–1612. doi: 10.1007/s11269-006-9116-1.
- Frimpong BF, Koranteng A, Atta-Darkwa T, Junior OF, Zawiła-Niedźwiecki T. 2023. Land Cover Changes Utilising Landsat Satellite Imageries for the Kumasi Metropolis and Its Adjoining Municipalities in Ghana (1986–2022). Sensors. 23(5):2644. doi: 10.3390/s23052644.
- Ghaffarian S, Roy D, Filatova T, Kerle N. 2021. Agent-based modelling of post-disaster recovery with remote sensing data. Int J Disaster Risk Reduct. 60:102285. doi: 10.1016/j.ijdrr.2021.102285.
- Gislason PO, Benediktsson JA, Sveinsson JR. 2006. Random forests for land cover classification. Pattern Recog Lett. 27(4):294–300. doi: 10.1016/j.patrec.2005.08.011.
- Gumma MK, Thenkabail PS, Panjala P, Teluguntla P, Yamano T, Mohammed I. 2022. Multiple agricultural cropland products of South Asia developed using Landsat-8 30 m and MODIS 250 m data using machine learning on the Google Earth Engine (GEE) cloud and spectral matching techniques (SMTs) in support of food and water security. GIScience & Remote Sensing. 59(1):1048–1077. doi: 10.1080/15481603.2022.2088651.
- Guo J, Gong P. 2018. The potential of spectral indices in detecting various stages of afforestation over the Loess Plateau Region of China. Remote Sensing. 10(9):1492. doi: 10.3390/rs10091492.
- Haider S, Ullah K. 2020. Projected crop water requirement over agro-climatically diversified region of Pakistan. Agric for Meteorol. 281:107824. doi: 10.1016/j.agrformet.2019.107824.
- Hinge G, Hamouda MA, Mohamed MM. 2024. Flash Flood Susceptibility Modelling Using Soft Computing-Based Approaches: from Bibliometric to Meta-Data Analysis and Future Research Directions. Water. 16(1):173. doi: 10.3390/w16010173.
- Hu P, Sharifi A, Tahir MN, Tariq A, Zhang L, Mumtaz F, Shah SHIA. 2021. Evaluation of vegetation indices and phenological metrics using time-series modis data for monitoring vegetation change in Punjab, Pakistan. Water. 13(18):2550. doi: 10.3390/w13182550.
- Huete AR. 1988. A soil-adjusted vegetation index (SAVI). Remote Sens Environ. 25(3):295–309. doi: 10.1016/0034-4257(88)90106-X.
- Islam ST, Akand MK, Islam MN, Samad S, Rishal FH. 2022. Systems thinking approach for disaster resilient and climate smart agriculture in Bangladesh. IJDRBE. 13(3):286–303. doi: 10.1108/IJDRBE-08-2021-0114.
- Khalid, S, Khanoranga, (2019). An assessment of groundwater quality for irrigation and drinking purposes around brick kilns in three districts of Balochistan province, Pakistan, through water quality index and multivariate statistical approaches. Journal of Geochemical Exploration, 197, 14–26. doi: 10.1016/j.gexplo.2018.11.007.
- Khan SU, Shahab S, Fani MI, Wahid A, Hassan MU, Khan A. 2021. Climate and Weather Condition of Balochistan Province, Pakistan. IJEEG. 12(2):Article 65–71. doi: 10.46660/ijeeg.v12i2.104.
- Khanal S, Kc K, Fulton JP, Shearer S, Ozkan E. 2020. Remote sensing in agriculture—Accomplishments, limitations, and opportunities. Remote Sensing. 12(22):3783. doi: 10.3390/rs12223783.
- Kurniawan R, Saputra AMW, Wijayanto AW, Caesarendra W. 2022. Eco-environment vulnerability assessment using remote sensing approach in East Kalimantan, Indonesia. Remote Sens Appl: soc Environ. 27:100791. doi: 10.1016/j.rsase.2022.100791.
- Mohammadi A, Costelloe JF, Ryu D. 2017. Application of time series of remotely sensed normalized difference water, vegetation and moisture indices in characterizing flood dynamics of large-scale arid zone floodplains. Remote Sens Environ. 190:70–82. doi: 10.1016/j.rse.2016.12.003.
- Nanditha JS, Kushwaha AP, Singh R, Malik I, Solanki H, Chuphal DS, Dangar S, Mahto SS, Vegad U, Mishra V. 2023. The Pakistan flood of August 2022: causes and implications. Earth’s Future. 11(3):e2022EF003230.
- Nguy-Robertson AL, Gitelson AA. 2015. Algorithms for estimating green leaf area index in C3 and C4 crops for MODIS, Landsat TM/ETM+, MERIS, Sentinel MSI/OLCI, and Venµs sensors. Remote Sensing Letters. 6(5):360–369. doi: 10.1080/2150704X.2015.1034888.
- Nitze I, Grosse G. 2016. Detection of landscape dynamics in the Arctic Lena Delta with temporally dense Landsat time-series stacks. Remote Sens Environ. 181:27–41. doi: 10.1016/j.rse.2016.03.038.
- Pal S, Chowdhury P, Talukdar S, Sarda R. 2022. Modelling rabi crop health in flood plain region of India using time-series Landsat data. Geocarto International. 37(13):3761–3790. doi: 10.1080/10106049.2020.1869328.
- Ahmad M-u-D, Peña-Arancibia JL, Yu Y, Stewart JP, Podger GM, Kirby JM. 2021. Climate change and reservoir sedimentation implications for irrigated agriculture in the Indus Basin Irrigation System in Pakistan. J Hydrol. 603:126967. doi: 10.1016/j.jhydrol.2021.126967.
- Polykretis C, Grillakis MG, Alexakis DD. 2020. Exploring the impact of various spectral indices on land cover change detection using change vector analysis: a case study of Crete Island, Greece. Remote Sensing. 12(2):319. doi: 10.3390/rs12020319.
- Qamer FM, Abbas S, Ahmad B, Hussain A, Salman A, Muhammad S, Nawaz M, Shrestha S, Iqbal B, Thapa S. 2023. A framework for multi-sensor satellite data to evaluate crop production losses: the case study of 2022 Pakistan floods. Sci Rep. 13(1):4240. doi: 10.1038/s41598-023-30347-y.
- Qi J, Chehbouni A, Huete AR, Kerr YH, Sorooshian S. 1994. A modified soil adjusted vegetation index. Remote Sens Environ. 48(2):119–126. doi: 10.1016/0034-4257(94)90134-1.
- Rahman MS, Di L. 2017. The state of the art of spaceborne remote sensing in flood management. Nat Hazards. 85(2):1223–1248. doi: 10.1007/s11069-016-2601-9.
- Rahman MS, Di L. 2020. A systematic review on case studies of remote-sensing-based flood crop loss assessment. Agriculture. 10(4):131. doi: 10.3390/agriculture10040131.
- Rasul A, Balzter H, Ibrahim GRF, Hameed HM, Wheeler J, Adamu B, Ibrahim S, Najmaddin PM. 2018. Applying built-up and bare-soil indices from Landsat 8 to cities in dry climates. Land. 7(3):81. doi: 10.3390/land7030081.
- Rogers AS, Kearney MS. 2004. Reducing signature variability in unmixing coastal marsh Thematic Mapper scenes using spectral indices. Int J Remote Sens. 25(12):2317–2335. doi: 10.1080/01431160310001618103.
- Sadiq R, Akhtar Z, Imran M, Ofli F. 2022. Integrating remote sensing and social sensing for flood mapping. Remote Sens Appl: soc Environ. 25:100697. doi: 10.1016/j.rsase.2022.100697.
- Saha AK, Agrawal S. 2020. Mapping and assessment of flood risk in Prayagraj district, India: a GIS and remote sensing study. Nanotechnol Environ Eng. 5(2):1–18. doi: 10.1007/s41204-020-00073-1.
- Samela C, Coluzzi R, Imbrenda V, Manfreda S, Lanfredi M. 2022. Satellite flood detection integrating hydrogeomorphic and spectral indices. GIScience & Remote Sensing. 59(1):1997–2018. doi: 10.1080/15481603.2022.2143670.
- Sanyal J, Lu XX. 2004. Application of remote sensing in flood management with special reference to monsoon Asia: a review. Natural Hazards. 33(2):283–301. doi: 10.1023/B:NHAZ.0000037035.65105.95.
- Sanyal J, Lu XX. 2005. Remote sensing and GIS‐based flood vulnerability assessment of human settlements: a case study of Gangetic West Bengal, India. Hydrological Processes. An International Journal. 19(18):3699–3716.
- Syed A, Raza T, Bhatti TT, Eash NS. 2022. Climate Impacts on the agricultural sector of Pakistan: risks and solutions. Environmental Challenges. 6:100433. doi: 10.1016/j.envc.2021.100433.
- Tralli DM, Blom RG, Zlotnicki V, Donnellan A, Evans DL. 2005. Satellite remote sensing of earthquake, volcano, flood, landslide and coastal inundation hazards. ISPRS J Photogramm Remote Sens. 59(4):185–198. doi: 10.1016/j.isprsjprs.2005.02.002.
- Tsai S-C, Lee S-H. 2022. Disaster-Resilient Communities on Flood Plains and Their Agricultural Regeneration: A Case Study in Meinong Plain, Taiwan. Water. 14(11):1736. doi: 10.3390/w14111736.
- Waseem HB, Rana IA. 2023. Floods in Pakistan: A state-of-the-art review. Natural Hazards Research. 3(3):359–373. doi: 10.1016/j.nhres.2023.06.005.
- Wójtowicz M, Wójtowicz A, Piekarczyk J. 2016. Application of remote sensing methods in agriculture. Communications in Biometry and Crop Science. 11(1):31–50.
- Yuan F, Sawaya KE, Loeffelholz BC, Bauer ME. 2005. Land cover classification and change analysis of the Twin Cities (Minnesota) Metropolitan Area by multitemporal Landsat remote sensing. Remote Sens Environ. 98(2-3):317–328. doi: 10.1016/j.rse.2005.08.006.
- Zahid M, Blender R, Lucarini V, Bramati MC. 2017. Return levels of temperature extremes in southern Pakistan. Earth Syst Dynam. 8(4):1263–1278. doi: 10.5194/esd-8-1263-2017.
- Zhu W, Cao Z, Luo P, Tang Z, Zhang Y, Hu M, He B. 2022. Urban Flood-Related Remote Sensing: research Trends, Gaps and Opportunities. Remote Sensing. 14(21):5505. doi: 10.3390/rs14215505.