
 ?Mathematical formulae have been encoded as MathML and are displayed in this HTML version using MathJax in order to improve their display. Uncheck the box to turn MathJax off. This feature requires Javascript. Click on a formula to zoom.
Abstract
Understory terrain is an important fundamental indicator for monitoring changes in forest ecosystems. However, in-depth analysis of the accuracy of existing international open-source DEM products is still lacking for understory environments. The DEM data produced by Ice, Cloud, and Land Elevation Satellite-2 (ICESat-2) carries an advanced topographic LiDAR altimeter system (ATLAS) that contains elevation information of the ground surface as well as features such as the vegetation above. It can reflect the elevation of the ground surface, including the part obscured by vegetation or canopy, and can be better used to monitor changes in ground surface elevation. However, few existing studies have been analyzed the accuracy of open-source DEM products (include ATLAS, AW3D30 DEM, and TanDEM-X data) for estimating the ground in understory environments. Therefore, this study selected Aiken County, Cook Inlet, and Yucatan as study areas to evaluate ICESat-2/ATLAS data, AW3D30 DEM and TanDEM-X data using the airborne G-LiHT system’s post-processing DTM. The study also quantitatively evaluated the influence of slope, aspect, and land vegetation type on elevation accuracies of different open-source DEM products. The experimental results showed that the ATLAS data at the footprint scale produced more accurate evaluation indicators than the AW3D30 DEM and TANDEM-X data products. The average evaluation indicator R2 was 0.98, RMSE was 1.44 m, and STD was 1.25 m. The results showed that ATLAS can be used as validation data to evaluate the accuracy of open-source DEM in estimating the vertical direction. At the regional scale, AW3D30 was the most robust and had the most stable performance in most of the tests (R2 is 0.95, RMSE is 6.37 m and STD is 5.02 m) and is therefore the best choice for research on understory terrain. Slope had a greater impact on the accuracy of data estimation compared to aspect and surface vegetation type. The difference in RMSE for estimating forest understory terrain was 3.11 m for ATLAS products, 29.37 m for AW3D30 DEM data and 54.26 m for TanDEM-X data over the different slopes.
1. Introduction
As of 2021, the world had a total forest area of 4.06 billion hectares, with a forest coverage rate 31% of the land area (Food and Agriculture Organization of the United Nations Citation2020). Understory terrain has been listed as an important basic indicator for monitoring forest structural parameters by international organizations such as the World Federation of Forests (De Frenne et al. Citation2019). The ability to quickly and accurately obtain understory terrain is of great significance for monitoring forest ecosystems (Bolstad et al. Citation2018). Therefore, understory terrain is not only an important basis for estimating the structural parameters of trees, but also an important part of producing digital terrain model (DTM) (Dandois and Ellis Citation2013). A DTM is a digital representation of bare surface model that represents ground elevation using a series of ordered sequences of numbers (Liu Citation2008). It provides elevation information of the ‘bare earth’ without natural or manmade objects (Tang et al. Citation2021). In forest ecosystem monitoring, understory terrain is the ground covered by the forest, which is a unique feature of forest ecosystems (Vogeler et al. Citation2014; Hamraz et al. Citation2017). However, estimating understory terrain using remote sensing methods has proved to be difficult due to the forest vegetation cover (Kobal et al. Citation2015). However, current DEM products have limitations in both their optics and SAR data (Tadono et al. Citation2015, Citation2016; Buckley et al. Citation2020) from the production process. Consequently, elevation information depicted in forest study areas does not represent true understory terrain elevations, but rather a pseudo surface situated between the canopy and the actual terrain. Therefore, it is crucial to quantify the inaccuracies within different DEM products to estimate realistic understory terrain.
Currently, high-precision control points derived from Global Navigation Satellite System (GNSS) data observations (Zhang et al. Citation2016 and Apeh et al. Citation2019), airborne and spaceborne LiDAR data, are the primary means for assessing DEM elevation accuracy (Santillan and Makinano-Santillan Citation2016; Zhao et al. Citation2020). Due to advances in processing techniques, there has been a growing demand for high-precision DEMs. However, research to validate the use of DEMs for estimating understory terrain remains limited. Wessel et al. (Citation2018) assessed the accuracy of TanDEM-X DEM products by comparing them to GNSS data. The study found that the vertical mean error of TanDEM-X DEM RMSE of less than 1.4 m in flat study areas without vegetation cover. However, there was a significant variability in errors for forested areas. Gorokhovich and Voustianiouk (Citation2006) studied the GNSS system to estimate SRTM. The results of their study showed that vertical errors were 7.58 ± 0.60 m in Phuket. However, GNSS data only provides point like validation data, making it challenging to use for global scale data validation work.
LiDAR technology is capable of penetrating partial forest cover. Airborne LiDAR has high accuracy when estimating forest terrain at small regional scales and can be effectively used as validation data. Hofton et al. (Citation2006) used airborne LiDAR to assess the accuracy of SRTM elevations with the average difference of 4.5 m. Uuemaa et al. (Citation2020) assessed the accuracy of different global DEMs and found that AW3D30 was the most robust and stable in most tests, with an RMSE of 4.98 m in the study area. However, due to its limited coverage at small domain scales, the verification of data at global scales poses a considerable challenge. The Ice, Cloud and Land Elevation Satellite-2 (ICESat-2), equipped with the Advanced Topographic Laser Altimeter System (ATLAS) which can record photon events for further data analysis. Its scientific objectives involve global scale quantification of forest ecosystem structural parameters and provision of scientific information for global digital terrain models. HuangJP et al. (2020) conducted experiments that revealed a high consistency between understory terrain estimated from ATLAS data and validation airborne LiDAR data (RMSE = 0.75 m). Shang et al.’s (Citation2022) study found that ICESat-2 data products are superior for accurately estimating the ground elevation of bare earth. Hence, it is significant to examine the precision of ICESat-2/ATLAS when estimating understory terrain. Li H et al. (Citation2022) investigated the accuracy of three global DEMs in China using ICESat-2 as validation data. The results indicated that the three global DEMs had similar overall vertical accuracy, with RMSE of 6.73 m (Copernicus), 6.59 m (NASA) and 6.63 m (AW3D30). Earlier research studies estimating understory terrain using ATLAS data have not taken into account important variables that include the forest type, slope and aspect. Consequently, there is a need to assess the accuracy of various forest parameter data for estimating understory terrain using ATLAS data. The above studies used different validation data to evaluate open-source DEM data. Although spaceborne LiDAR data is discrete and differs from grid-based DEM, few existing studies have been conducted to analyze the accuracy of open-source DEM products such as ATLAS data for estimating the ground in understory environments, which will be crucial for subsequent research on forest ecosystems.
The objective of this paper is to assess the precision of ICESat-2/ATLAS data, AW3D30 DEM, and TanDEM-X DEM sets in estimation understory terrain, thereby offering robust data support for forestry applications. The following is a summary of this study’s primary contributions: (1) The accuracy of spaceborne LiDAR data and traditional DEM as a whole was evaluated in estimating understory terrain. This evaluation utilized airborne LiDAR, which demonstrated higher precision. (2) The paper will focus on the ability of data in form of LiDAR footprint and regional scale to estimate understory topography. (3) This study will investigate the effects of slope, aspect, and vegetation type on the estimation of vertical accuracy.
To quantitatively evaluate the precision of ICESat-2/ATLAS data, AW3D30 DEM, and TanDEM-X DEM in estimation understory terrain were extracted from airborne LiDAR data, based on data taken from Goddard’s LiDAR, Hyperspectral and Thermal imager (G-LiHT). Section 2 presents the study area and study datasets. The evaluated method is described in Section 3. The evaluation results and discussion are presented in Section 4. Finally, the conclusions are drawn in Section 5.
2. Study material
2.1. Study area
Aiken County, South Carolina, USA, Cook Inlet, Alaska, and Yucatan State, Mexico were selected as the study areas, and their locations are shown in .
Figure 1. Locations of the study areas. The black line on this figure is ATLAS trajectory. The underlay is the G-LiHT DTM. (a) is schematic diagram of the location of the study area. (b) is cook Bay study area. (c) is aiken study area. (d) is yucatán study area.
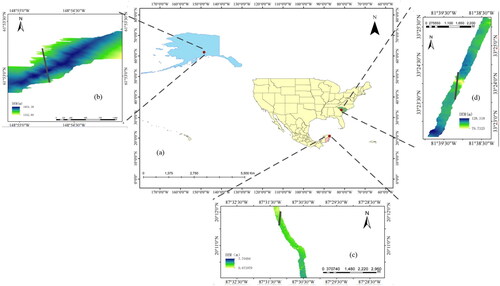
Aiken County, USA, is located within the latitude and longitude range of (33.56°N-33.78°N, 81.69°W-81.73°W). Temperatures typically range from 2 °C to 33 °C throughout the year, rarely dropping below −5 °C or rising above 36 °C. The ground altitudes range from 91 m to 164 m. Forests are mainly distributed in low lying areas, dominated by shrubs, herbaceous plants, and deciduous pines.
Cook Bay, Alaska, is a study area in the subarctic region. Alaska is located in the northwestern part of North America, with wetlands covering 45.5% of the state. Cook Bay is a bay that extends from the Alaska Gulf to Anchorage in south- central Alaska, with latitude and longitude range of (61.48°N-61.84°N, 148.30°W-149.03°W). It has a plateau and high mountain climate, characterized by cool and wet conditions with a significant maritime influence. The mean altitudes range from 231 m to 862 m. The main tree species include Pinus strobus, Populus balsamifera, and Populus trichocarpa.
The latitude and longitude range of Yucatán State, Mexico, is (18.39°N-20.95°N, 88.09°W-88.04°W). The state’s terrain includes coastal marshes, semiarid regions, plains, and limestone lowlands. The ground altitudes range from 0 m to 28 m. Using latitude and longitude information from photon cloud data from the ATL03 data product, the corresponding G-LiHT DTM data was obtained and used as validation data, as shown in .
2.2. Study data
This study assessed the precision of understory terrain estimation using open-source data, including ICESat-2/ATLAS data, AW3D30 DEM, and TanDEM-X DEM, while also examining the impacts of slope, aspect, and forest type on accuracy. To achieve these goals, G-LiHT airborne LiDAR data were used to evaluate estimations in Aiken County, Alaska, and Yucatan State, Mexico.
ICESat-2/ATLAS data product
ICESat-2 is equipped with an advanced surface laser altimetry system (Neuenschwander and Magruder Citation2019; Neuenschwander et al. Citation2020). This device utilizes a 532 nm laser beam for collecting ground height data. ATLAS is a photon detector that differs from GLAS systems as it operates in single photon detection mode. In contrast, most commercial LiDAR systems currently use echo detection above a certain threshold. The advantage of using a photon counter is that it can operate at a higher repetition rate. The instrument uses 3 pairs of 6 beams with a pulse repetition rate of 10 kHz. Each pair of beams is separate, with a separation of approximately 3.3 km between each pair and a spacing of 90 m within each pair, consisting of a high energy beam and a low energy beam in a 4:1 ratio (Huang JP et al. Citation2020; Huang X et al. Citation2023). The nominal diameter of the footprint created by each beam is 17 m, with an along-track sampling interval of 0.7 m (Ding et al. Citation2023; Li B et al. Citation2023).
These configurations allow for much denser spatial sampling compared to ICESat (Wang et al. Citation2021). The instrument provides various geophysical products for different surface types (Dandabathula et al. Citation2020). In this study, the land and vegetation height product (ATL08) was utilized, which includes alongtrack heights of the ground and canopy surfaces. The product is processed in fixed 100 × 17 m segments, generally comprising over 100 signal photons. ATL08 data from October 2018 to July 2021 were downloaded from the website of the National Snow and Ice Data Center in the reference coordinate system of WGS84 (Neuenschwander and Magruder Citation2019; Neuenschwander et al. Citation2020).
G-LiHT data
G-LiHT (Goddard’s LiDAR, Hyperspectral & Thermal Imager) is a portable airborne imaging system that uses a combination of optics and lasers to acquire surface elevations. It can directly acquire DSM data as well as DTM data, DSM can be rapidly generated from aerial remote sensing imagery acquired at 1 m resolution and collected by airborne systems. The G-LiHT system is a portable airborne imaging system that utilizes LiDAR technology for real time monitoring of land ecosystem composition, structure, and function. It includes imaging spectrometry for species composition and biophysical parameter differentiation, a thermal measurement payload for analyzing surface temperatures, and a LiDAR payload for precise 3D observation of land ecosystems. By providing coincident temporal and spatial data, G-LiHT enables the fusion of multiple data sources and provides various types of data required for ecosystem research. The G- LiHT LiDAR payload to be used in the study has a spatial resolution of 1 m, vertical accuracy of 0.15 m, horizontal positioning accuracy of 0.3 m, and uses the WGS84 projection coordinate system (Cook et al. Citation2013; Paynter et al. Citation2019).
The G-LiHT LiDAR divided into Dual-scanning LiDAR. The Laser is 1550 nm near infrared spectrometry. Laser pulse repetition rate is 30 kHz. Laser Beam Divergence is 0.3 mrad. Point Density is up to 12 pt/m2. Visible and near infrared spectralrange is from 400 nm to 1000 nm, and Spectral resolution is 5 nm full width at half maxima (FWHM). Swath width is 420 m swath with a 64° field of view (FOV). High Resolution aerial photos field of view is 56.2°× 43.7°. The positioning method of G-LiHT is precision GPS-INS. To evaluate understory terrain estimation accuracy using ATLAS data, published DTM data from G-LiHT was selected for validation. The data is in TIFF format. The G-LiHT data used in the study were obtained from https://glihtdata.gsfc.nasa.gov.
AW3D30 DEM
AW3D30 DEM is a free global stereo optical DSM dataset. It is a visualized digital image dataset based on the Panchromatic Remote sensing Instrument for Stereo Mapping (PRISM). The data is operated by the Japan Aerospace Exploration Agency (JAXA). PRISM consists of 3 panchromatic radiometers with a spatial resolution of 2.5 m (Krieger et al. Citation2007; Tadono et al. Citation2015). The corresponding elevation data can be used to obtain high precision 3D coordinate information of the Earth’s surface. AW3D30 is a resampled version based on AW3D5, with a grid size of 1 arcsec. It was first released in May 2016, and version 3.2 was launched in March 2021. The data is referenced to the WGS84 horizontal coordinate system and was obtained from http://www.eorc.jaxa.jp/ALOS/en/aw3d30.
TanDEM-X data
TanDEM-X is an Earth observation system that consists of two almost identical satellites flying with a Synthetic Aperture Radar (SAR) interferometer (Wessel Citation2013; Wessel et al. Citation2021). Together they produce a global DEM dataset. The primary objective of the TanDEM-X mission is to create a high quality, high precision, and high-resolution map of the Earth’s land surface. The global DEM compilation products were publicly available in 2016, with an absolute vertical error of 1 m. The TanDEM-X DEM is a product variant of the global DEM acquired within the framework of the German TanDEM-X mission from 2010 to 2015 (Tang et al. Citation2021). The pixel spacing of this variant is reduced to 3 arc seconds, equivalent to 90 m at the equator. It covers almost all land areas on Earth. The data was obtained from https://geoservice.dlr.de/web/dataguide/.
Surface vegetation type data
Existing land surface vegetation type products are limited in their ability to be further subdivided among forest types. Other types of surface vegetation products are usually only classified as one type of forest without further classification, for example: evergreen broadleaf forest, deciduous needleleaf forest, evergreen needleleaf forest, deciduous broadleaf forest, etc. To further investigate the influence of different forest vegetation types on the elevation accuracy of different DEM products, MCD12Q1 data is a land cover type product with a resolution of 500 m. It utilizes Terra and Aqua satellite remote sensing images from MODIS data and further optimizes the specific classification through post-processing and other auxiliary information.
The MCD12Q1 data resolution is 500 m and it includes 13 scientific datasets, with eight different land cover classification schemes. Although there are differences in the resolution of the MCD12Q1 product compared to open-source understory terrain data and validation data, the MCD12Q1 product was chosen in this study to explore the effects of different forest types on error accuracy. This study used Band 1, which is based on the International Geosphere Biosphere Programme (IGBP) land cover dataset that contains 17 major land cover types. According to the IGBP, this includes 11 natural vegetation types, three land development and mosaic land classes, and three non-vegetated land type defined classes (DiMiceli et al. Citation2023; Friedl and Sulla-Menashe Citation2023). The data was obtained from https://lpdaac.usgs.gov/products/mcd12q1v006/. shows the characteristics of datasets in each region.
Table 1. Study data directory.
3. Methods
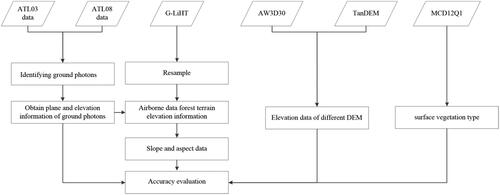
The study evaluated the accuracy of ATLAS DEM, AW3D30 DEM and TanDEM-X data with airborne G-LiHT DTM data in estimating the elevation of the understory terrain. The error distribution and accuracy evaluation indicators for the three DEMs were analyzed to evaluate their elevation accuracy. The flowchart is shown in , and the specific research methods were as follows:
Figure 2. A Flowchart of the research methods.
Determine the study area: Based on the existing airborne G-LiHT data, the area that overlapped with the ATLAS satellite orbit, TanDEM-X DEM, AW3D30 DEM, and MCD12Q1 data was selected. To investigate the accuracy of estimating understory terrain using different remote sensing products, three research areas were selected, namely cold, temperate and tropical zones, located in Alaska, Aiken and Mexico.
Coordinate transformation, resampling, and extraction of slope, aspect, and land cover type: In this experiment, the spatial reference of the G-LiHT KML file was projected according to the WGS_1984 system, and the reference surface for TanDEM-X 90 m and AW3D30 DEM products was D_WGS_1984. The MCD12Q1 data was reprojected to a sinusoidal projection. Therefore, for subsequent analysis, D_WGS_1984 was selected as the reference surface, and the DTM data was resampled. Slope, aspect, and surface vegetation were extracted from the G-LiHT DTM data. This study adopted the IGBP classification scheme, and the MCD12Q1 data selected was LC_Type1.
Using the latitude and longitude information of the photon cloud data in the ATLAS data product, the corresponding G-LiHT DTM data, TanDEM-X DEM data, AW3D30 DEM data, and MCD12Q1 land cover type data were selected as the study data.
ATLAS data processing: Due to the influence of sunlight, atmospheric and system noise, the ATLAS raw data contains a large number of noise photons, which seriously affect the ground elevation accuracy. In order to improve the estimation accuracy of ATLAS photon data, this study used the ATL08 data classified algorithm to distinguish noise photon data. ATLAS products include confidence levels for corresponding photons as signal photons, which are 1, 2, 3, and 4. This study selected photons with confidence levels of 4 as signal photons.
The ATLAS data on board the spacecraft were discrete points, not raster data. In addition, existing research on ATLAS data has tended to focus on segment scale ATLAS data, but this study used photon level ATLAS as the research data. Land vegetation ATBD classification flags for each photon were labelled as noise, ground, canopy, and top of canopy, where 0 = noise, 1 = ground, 2 = canopy, or 3 = top of canopy. The classification label was classed_pc_flag = 1. Using the data label of the ATL08 data product, i.e. classified_Flag = 1, it was marked as the corresponding ATL03 ground photon data. The focus of this study was not to investigate the estimation accuracy of ATLAS data with different beam characteristics. Therefore, in this study, data from different beams were selected to investigate the overall estimation capability of ATLAS data. A corresponding data quality screening was also performed for the ATLAS data study.
Establishing the DTMATLAS. Photons with a signal confidence flag from high confidence (signal_confidence = 4) and photon classification parameter (classed_pc_flag = 1) were used to establish the DTMATLAS.
Obtaining the DTMTanDEM-X, DTMAW3D30 and DTMG- LiHT. In this step, the latitude and longitude information were extracted from the DTMATLAS to match the DTMTanDEM-X, DTMAW3D30 and DTMG-LiHT, DTM profile corresponding positions were generated from G-LiHT, TanDEM-X DEM and AW3D30 DEM and DTMG-LiHT, DTMTanDEM-X and DTMAW3D30 were generated with the corresponding ATLAS footprint latitude and longitude.
Slope factor analysis: The study extracted slope data from corresponding airborne G-LiHT data. The slope factor was classified using intervals of 5°, ranging from 1°-10°, 10°- 20°, 20°-30°, 30°-90°.
Aspect factor analysis: The study extracted aspect data from corresponding airborne G-LiHT data. The aspect factor was classified based on the plane (0–22.5), (22.5–67.5), (67.5–112.5), (112.5–157.5), (157.5–202.5), (202.5–247.5), (247.5–292.5), (292.5–337.5), and (337.5–360).
Land cover types: 1-Evergreen needleleaf forest, 2-Evergreen broadleaf forest, 3-Deciduous needleleaf forest, 4-Deciduous broadleaf forest, 5-Mixed forest, 6-Closed shrubland, 7-Open shrubland, 8-Woody savanna, 9-Savanna, 10-Grassland, 11-Permanent wetland, 12-Cropland, 13-Urban and built-up, 14-Cropland/Natural vegetation mosaic. Although there were differences in the resolution of MODIS data and corresponding experimental data, to explore the impact of different forest types (evergreen needleleaf forest, evergreen broadleaf forest, etc.) on the accuracy of understory terrain estimation, we believe that this data product was the most suitable surface type data under existing working conditions.
The determination coefficient (R2) and RMSE were used to quantitatively evaluate the relationship between the three elevation datasets. The R2 in linear regression with an estimated intercept term is equal to the square of the Pearson correlation coefficient between the observed values of the dependent variable and the model data. R2 value closer to 1 indicates a better fit of the regression (formulas (1)). The RMSE was used to measure the difference between the observed data and the true data, eliminating the influence of the positive or negative signs of the measured data and reflecting the reliability of the observed data (formulas (2)). STD and average error are shown in formulas (3) and (4).
(1)
(1)
(2)
(2)
(3)
(3)
(4)
(4)
In the equation, xi represents the estimated understory terrain values derived from G-LiHT validation data, TanDEM-X DEM, and AW3D30 DEM data. zi represents the validation understory terrain data obtained from ATLAS inversion and represents the average value of validation understory terrain data. n represents the number of experimental data points.
4. Results and discussion
4.1. Overall evaluation of the elevation accuracy
The elevation accuracies of ICESat-2/ATLAS data, AW3D30 DEM, TanDEM-X data, and MCD12Q1 surface vegetation type data were evaluated using the DTM model from the airborne G-LiHT system. The quantitative evaluation metrics for accuracy and study data points are shown in for the three study areas: Aiken County, Cook Inlet in Alaska, and Yucatan State in Mexico. The total number of study points is 49,670, including 8937 study points in Aiken County, 1029 study points in Alaska, and 39,593 study points in the Yucatan. These data are all randomly distributed, and we determined the scope of the study area based on the flying area of G-LiHT data. The scatter plots for the evaluations are shown in . depict the scatter plots of G-LiHT data evaluating ATLAS data, TanDEM-X data and AW3D30 DEM data.
Figure 3. Scatterplot of open-source DEM ground topography results compared to DTM G-LiHT.
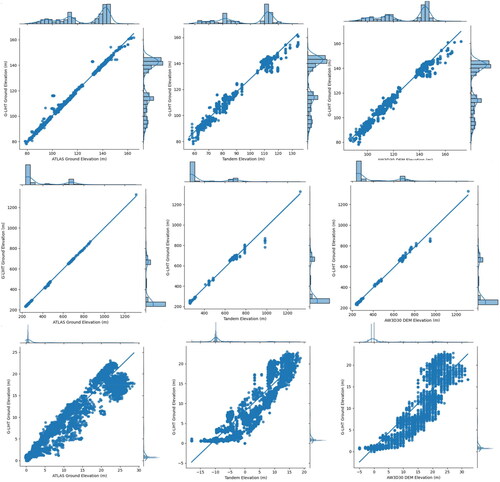
The quantitative results of the experimental findings are shown in and . In these results, the R2 values for ATLAS data were close to 1, indicating a high level of consistency between the understory terrain data estimated from ATLAS data and the air-borne G-LiHT DTM data in the three study areas. The R2 values for AW3D30 DEM and TanDEM-X data with the airborne G-LiHT DTM data were both greater than 0.8, suggesting a strong correlation between the airborne G-LiHT data and the AW3D30 DEM, as well as the TanDEM-X data. For the Aiken study area, the average RMSE values for the ATLAS data, AW3D30 DEM, and TanDEM-X data were 1.09, 4.56, and 28.38 m, respectively. For Cook Inlet in the Alaska study area, the average RMSE values for the ATLAS data, AW3D30 DEM, and TanDEM-X data were 1.87, 11.56, and 23.48 m, respectively. For the Yucatan State in Mexico study area, the average RMSE values for the ATLAS data, AW3D30 DEM, and TanDEM-X data were 1.38, 3.01, 5.3, and 10.41 m, respectively. The experimental data showed that the ATLAS accuracy evaluation metrics were generally superior to those of AW3D30 DEM and TanDEM-X data. An overall analysis of all study areas found that the estimated ATLAS accuracy evaluation metrics were similar to those reported in Li and Zhao (Citation2018), while AW3D30 DEM data had similar RMSE values to those of Li H and Zhao (Citation2018), and TanDEM-X data had higher RMSE values. When analyzing the production mechanisms of the different DEM data in the study areas, it was evident that ATLAS data, as a LiDAR dataset, had good penetration capabilities in forested areas, allowing for a clear representation of vertical forest structure information and showing better estimation capabilities compared to other datasets. On the other hand, AW3D30 DEM is derived from stereo photogrammetry and TanDEM-X uses polarimetric SAR data, both of which have difficulty when penetrating forest cover and dealing with signal saturation, resulting in reduced accuracy in estimating understory terrain.
Table 2. Accuracy indicators for ATLAS, RanDEM-x and AW3D30 data in the study areas.
For all study areas and the AW3D30 data, the average was negative (). That is, all the global open-source DEM models generally overestimated the elevation compared to the reference models, which was expected. Of the three global datasets, TanDEM-X performed the worst based on RMSE. Moreover, TanDEM-X showed the largest variation in error values (Alaska and Yucatan between 28.38 and 10.41 m). Of the three study areas, the biggest variation in STD was observed in Alaska, where the relief was the most rugged and was combined with dense vegetation.
The research results showed that the accuracy index of understory terrain estimation using ATLAS data was indeed significantly better than that of DEM data. Therefore, the use of free and globally covering ATLAS as validation data for DEM has generalised ability. Comparing the estimation accuracy of two regional scale DEMs, the AW3D30 data was more accurate based on the evaluation indicators compared to TanDEM-X data.
4.2. Discussion of factors influencing different slopes
To investigate the accuracy of estimating understory terrain for ATLAS data, AW3D30 DEM, and TanDEM-X data under different slope conditions, the study compiled their evaluation metrics, as shown in .
Figure 4. Vertical accuracy for three remote sensing data reference airborne DTM data under different slopes.
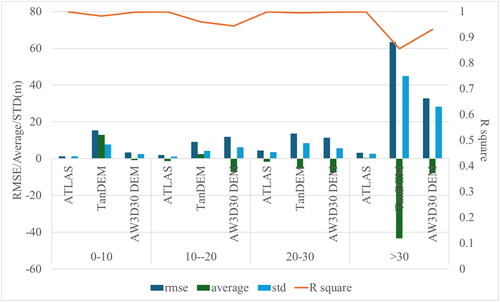
The statistical analysis results of the effects of different slope conditions on the DEM data are shown in . There was a clear slope effect on DEM vertical accuracy in all study areas, especially when the slope was greater than 30°. In , RMSE, average and STD correspond to the left coordinate axis, while R2 corresponds to the right coordinate axis. Analyzing the R2 values, it was observed that ATLAS data R2 values were close to 1 at all slope intervals, while AW3D30 DEM and TanDEM-X data had decreasing R2 values as the slope increased. The experimental results showed high consistency between the G-LiHT DTM data estimated from ATLAS LiDAR data and the airborne G-LiHT DTM data, with no significant changes observed as the slope increased. However, AW3D30 DEM and TanDEM-X data decreased in correlation as the slope increased. Analyzing the RMSE values, the average RMSE values for ATLAS data, TanDEM-X data, and AW3D30 data under different slope conditions were 2.73, 25.35, and 14.86 m, respectively. The experimental data showed that ATLAS data had better accuracy evaluation metrics compared to TanDEM-X and AW3D30 data. The accuracy of ATLAS data was higher and RMSE gradually increased as the slope increased, similar to the results reported in Uuemaa’s (Citation2020) study. The experimental results indicated that, based on the influence of slope factors, the estimation accuracy of understory terrain data derived from ATLAS data was superior to that of AW3D30 DEM and TanDEM-X DEM data, with TanDEM-X DEM data performing the worst in terms of accuracy evaluation metrics.
Further analysis of the impact of slope factors on understory terrain found that, compared to AW3D30 products, TanDEM-X had similar R2 values but higher RMSE values, contradicting the findings of Uuemaa’s study. The changes in RMSE for ATLAS data, AW3D30 DEM, and TanDEM-X data as slope increased were 3.11, 54.26 and 29.37 m, respectively. The research results demonstrated that the estimation accuracy of ATLAS data, AW3D30 DEM data, and TanDEM-X data used in this study generally increased as slope increased, similar to the conclusions of Uuemaa’s (Citation2020) study. The analysis revealed that as the slope increased, the footprint shape of ATLAS data exhibited different forms, resulting in a shift in the centroid of the overall spot. This may have led to inaccurate estimation of ground elevation and subsequently affected the accuracy of understory terrain estimation. The overall elevation accuracy of TanDEM-X data also decreased with the increasing slope, consistent with the experimental results reported in Santillan’s study. This is attributed to the production mode of TanDEM-X products and the geometric distortions such as perspective shrinkage, top and bottom inversion, and overlapping that occur during radar data acquisition. These present significant challenges for subsequent processing and interpretation of TanDEM-X data, ultimately affecting the accuracy of the DEM. AW3D30 DEM data is produced using stereo photogrammetry, and compared to flat bare ground, the steep slopes in forested environments are affected by forest cover and the slope, which further reduces the illuminated area obtained from optical imagery and affects the accuracy of terrain estimation using this method.
Overall, this study, along with previous research, found that slope impacted the accuracy of open-source DEM products, with a similar decreasing trend in accuracy as the slope increased. It is suggested that in future research, in the absence of high precision airborne data, ATLAS data can be used as control points to collaboratively correct any existing deviations in the DEM.
4.3. Discussion of different aspect factors
To investigate the accuracy of estimating understory terrain using different vegetation types for ATLAS, AW3D30 DEM, and TanDEM-X data, we collected 49,670 study data points, the quantitative evaluation indicators of the three data sets were summarized as shown in .
Figure 5. Vertical accuracy for three remote sensing data reference airborne DTMs under different aspects.
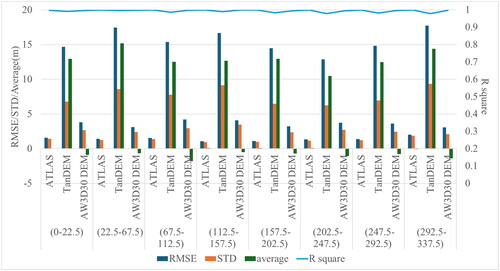
The quantitative results of the experimental results on the relationship between elevation error and ground slope direction are shown in . Rz values for the three DEM products were close to 1, indicating that the estimated forest DTM data and the validation data of the airborne G-LiHT forest DTM had high consistency. Based on the influencing factors of slope orientation, the accuracy evaluation index of ATLAS satellite data estimation for understory terrain data was superior to that of TanDEM-X DEM and AW3D30 DEM. The TanDEM-X 90 m DEM data had the highest accuracy (RMSE = 3.0 m) when the slope direction data was (337.5–360). The AW3D30 DEM data had the highest accuracy (RMSE = 12 m) when the slope direction data was (247.5–292.5).
Aspect had a smaller effect on DEM accuracy than slope (). The effect of aspect on accuracy was strongest for the ASTER model; however, there was no clear pattern across study areas. As the slope direction changed, the AW3D30 DEM fluctuated around RMSE = 4 m, with a significant change rate of 6.9%. The TanDEM-X DEM data fluctuated around RMSE 15 m, with a change rate of 1.6%. The ATLAS data fluctuated around RMSE 2 m, with a change rate of 4%, and there were significant changes in RMSE in the north-south and east-west directions. The TanDEM-X product accuracy was significantly lower than the other two DEM remote sensing datasets was due to its low resolution. The experimental results were similar to the research conclusion of Uuemaa’s study. The aspect influenced the error, and the average error in the north-south direction was significantly lower than that in the east-west direction. However, the aspect had a smaller effect on the accuracy of the DEMs than slope.
4.4. Discussion of the factors influencing different vegetation types
To explore the accuracy of estimating understory terrain using ATLAS data, AW3D30 DEM, and TanDEM-X data for different vegetation types, a summary of quantitative evaluation indicators is shown in .
Figure 6. Vertical accuracy for three remote sensing data reference airborne DTMs under different surface vegetation types.
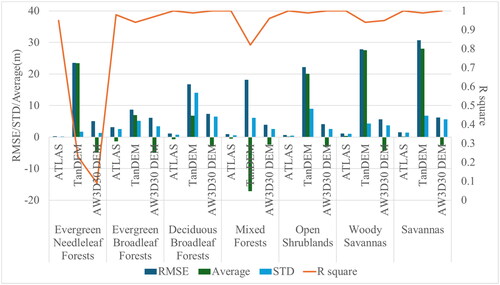
The quantitative results of the relationship between elevation error and ground vegetation type in the experimental results are shown in . In this study, DEM data accuracy under different land surface coverings in two study areas was evaluated using the MCD12Q1 product and the LC_Type1 classification scheme of the IGBP. The dominant vegetation types in the three study areas were evergreen coniferous forests, evergreen broadleaf forests, deciduous broadleaf forests, and mixed forests.
In general, the magnitude of the error for the different land cover types differed more between the study areas than between the different DEMs. This indicated that land cover affected the DEM accuracy in location specific ways. Even for the forest cover type, the vegetation characteristics (leaf area index (LAI), canopy density, canopy coverage, canopy height) varied enough among biomes and forest carbon density that it caused significant variability in the DEM errors. For SAR based DEMs (TanDEM-X), volume scattering caused uncertainty. For stereo mapping satellite based DEMs (AW3D30 DEM), shadows, radiation changes may have caused uncertainty.
By comparing the accuracy evaluation of DEM products under different land cover types, the R2 of ATLAS data products was close to 1 under different land cover types. This indicated a high consistency between the understory terrain data estimated from ATLAS data products and the airborne G- LiHT DTM, and there was no significant change with the variation of land cover types. However, based on the factors influencing ground vegetation type, the accuracy evaluation indicators of ATLAS LiDAR data for estimating understory terrain data (RMSE = 3.2 m) were better than the estimation accuracy of AW3D30 DEM (RMSE = 7.4 m) and TanDEM-X 90 m DEM (RMSE = 18 m). The presence of land cover information in the TanDEM-X digital elevation model produced significant differences between the evaluation index and land cover. In the case of evergreen needleleaf forests, the highest accuracy was achieved with ATLAS satellite data (RMSE = 0.24 m). As shown in , the accuracy was relatively high in the case of evergreen broadleaf forests for all three DEM datasets. TanDEM-X underestimated elevation over different forest types. For the TanDEM-X DEMs, this was likely caused by how SAR interferometry functioned, because low coherence or backscatter increased the noise over forested study areas. AW3D30 overestimated the elevation over different forest types. For the AW3D30 DEMs, this was likely caused by how SAR interferometry functions, because wavelength defects in optical data made it difficult to penetrate the forest cover and increased the estimation error over forested study areas.
In principle, two of the open-source raster DEM datasets we analysed can be considered DSMs. The ability of the data to represent understory terrain was strongly influenced by forest vegetation cover. This also explained their tendency to overestimate or underestimate elevation over different forest types, as the surface reflecting the signal (e.g. a canopy height) exists at some height above the true ground level. However, in the case of SAR-based elevation models, there were some exceptions for areas where the SAR signal penetrated the surface by a few metres, e.g. in the case of vegetation. In the case of forested areas, the underestimation still occurred because forest height usually exceeded the penetration. In comparison, ATLAS data are space LiDAR data, which were relatively less affected by forest cover when representing the vertical structure information of forests. The effect of different forest types on ATLAS was not as significant as for the other two open-source raster DEM datasets. Because these data are discrete point scale data, their application range is limited. However, ATLAS data can be used to improve the grid attributes of a DEM and perform validation or control point functions.
5. Conclusion
This study investigated the accuracy of airborne data obtained from ICESat-2/ATLAS in estimating the forest understory digital terrain model (DTM), using G-LiHT data as a reference. It compared elevation errors between two global open-source DEMs, TanDEM-X and AW3D30 DEM. The study areas were Aiken County, South Carolina, Cook Inlet, Alaska, and Yucatan, Mexico. The study calculated the determination coefficients (R2), RMSE and STD between ATLAS data, TanDEM-X DSM, AW3D30 product, and the airborne reference values. The study focused on evaluating the accuracy of these different products based on slope and aspect factors. The experimental results showed that:
The ATLAS product, at the footprint scale, has better accuracy evaluation indicators compared to the AW3D30 DEM and TanDEM-X data products. The average R2 value was 0.98, RMSE was 1.44 m, and STD was 1.25 m. The study suggested that future forest ecology research should use satellite-based ATLAS data to evaluate or improve DEM accuracy.
The accuracy of the open-source DEMs depended greatly on the unique characteristics of each region. The AW3D30 data was the least accurate and had the highest uncertainty across all study areas, slope, aspect conditions, and surface vegetation type. At the regional scale, the AW3D30 data was more accurate when compared to indicators for the TanDEM-X data, with an average R2 value of 0.95, RMSE of 6.37 m, and STD of 5.02 m.
Vertical accuracy was assessed as a function of slope, aspect, and vegetation cover type. We found that slope had the strongest effect on DEM accuracy. Aspect and surface vegetation type smaller effects on the accuracy of the DEMs than slope. Based on the slope factor, the different RMSE values for estimating the forest understory terrain were 3.11 m for ATLAS products, 29.37 m for AW3D30 DEM data and 54.26 m for TanDEM-X DSM data.
This study analyzed the accuracy levels and error patterns of ICESat-2/ATLAS data and DEM products for characterizing terrain surface slope, aspect, and vegetation type using airborne G-LiHT products. Based on the experimental results, it is recommended to use ICESat-2/ATLAS data or AW3D30 DEM products to characterize the elevation of forest understory. The findings of this study can provide recommendations for the selection of DEM data in future studies of forested environments.
Acknowledgments
We thank the anonymous reviewers for their constructive feedback.
Disclosure statement
No potential conflict of interest was reported by the author(s).
Data availability statement
The data used in this study are available upon request. The data are hosted by a third-party repository and are accessible through an online platform. To access the data, interested parties may contact the data provider directly. No additional data are available. The data are subject to a license agreement and may be used only for research purposes. Users must agree to the terms of the license agreement and ensure that they comply with all applicable privacy and ethical guidelines.
References
- Apeh O, Uzodinma V, Ebinne E, Moka E, Onah E. 2019. Accuracy assessment of Alos W3d30, Aster Gdem and Srtm30 Dem: a case study of Nigeria, West Africa. JGIS. 11(02):111–123. doi: 10.1080/22797254.2020.1774424.
- Bolstad PV, Elliott KJ, Miniat CF. 2018. Forests, shrubs, and terrain: top-down and bottom-up controls on forest structure. Ecosphere. 9(4):e02185. doi: 10.1002/ecs2.2185.
- Buckley SM, Agram PS, Belz JE, Crippen RE, Gurrola EM, Hensley S, Kobrick M, Lavalle M, Martin JM, Neumann M, et al. 2020. NASADEM: user guide. NASA JPL: Pasadena. https://lpdaac.usgs.gov/documents/592/NASADEM_User_Guide_V1.pdf.
- Cook BD, Corp LA, Nelson RF, Middleton EM, Morton DC, McCorkel JT, Masek JG, Ranson KJ, Ly V, Montesano PM. 2013. NASA Goddard’s LiDAR, Hyperspectral and Thermal (G-LiHT) airborne imager. Remote Sens. 5(8):4045–4066. doi: 10.3390/rs5084045.
- Dandabathula G, Verma M, Rao Sitiraju S. 2020. Evaluation of best-fit terrain elevation of ICESat-2 ATL08 using DGPS surveyed points. J Appl Geodesy. 14(3):285–293. doi: 10.1515/jag-2020-0003.
- Dandois JP, Ellis EC. 2013. High spatial resolution three-dimensional mapping of vegetation spectral dynamics using computer vision. Remote Sens Environ. 136:259–276. doi: 10.1016/j.rse.2013.04.005.
- De Frenne P, Zellweger F, Rodríguez-Sánchez F, Scheffers BR, Hylander K, Luoto M, Vellend M, Verheyen K, Lenoir J. 2019. Global buffering of temperatures under forest canopies. Nat Ecol Evol. 3(5):744–749. doi: 10.1038/s41559-019-0842-1.
- DiMiceli C, Carroll M, Sohlberg R, Kim DH, KellyM, Townshend JRG. 2023. MOD44B MODIS/Terra vegetation continuous fields yearly L3 global 250m sin grid V006 [data set]. NASA EOSDIS Land Processes DAAC. [accessed 2023 Apr 22]. Available from doi: 10.5067/MODIS/MOD44B.006.
- Ding H, Liu J, Yang S, Luo J, Liu Y, Liang X, Na J, Jiang S, Fu Y. 2023. Performance assessment of global open‐access digital elevation models in China mainland coastal region. Earth Surf Processes Landf. 48(11):2133–2140. doi: 10.1002/esp.5677.
- Food and Agriculture Organization of the United Nations. 2020. Global forest resources assessment. http://www.sprep.org/sites/default/files/documents/publications/forest-resources-assessment-main-report.pdf.
- Friedl M, Sulla-Menashe D. 2023. MODIS/terra + aqua land cover type yearly l3 global 500m sin grid V061 [data set]. NASA EOSDIS Land Processes DAAC. doi: 10.5067/MODIS/MCD12Q1.006.
- Gorokhovich Y, Voustianiouk A. 2006. Accuracy assessment of the processed SRTM-based elevation data by CGIAR using field data from USA and Thailand and its relation to the terrain characteristics. Remote Sens Environ. 104(4):409–415. doi: 10.1016/j.rse.2006.05.012.
- Hamraz H, Contreras MA, Zhang J. 2017. Vertical stratification of forest canopy for segmentation of understory trees within small- footprint airborne Lidar point clouds. ISPRS J Photogramm Remote Sens. 130:385–392.
- Hofton M, Dubayah R, Blair JB, Rabine D. 2006. Validation of SRTM elevations over vegetated and non-vegetated terrain using medium footprint Lidar. Photogramm Eng Remote Sens. 72(3):279–285. doi: 10.14358/PERS.72.3.279.
- Huang JP, Xing YQ, Qin L, Tingting X. 2020. Verification of understory topography accuracy verification of ICESat-2/ATLAS data estimation. Infrared Laser Eng. 49(11):20200237. doi: 10.3788/IRLA20200237.
- Huang X, Cheng F, Wang J, Duan P, Wang J. 2023. Forest canopy height extraction method based on ICESat-2/ATLAS Data. IEEE Trans Geosci Remote Sens. 61:1–14. doi: 10.1109/TGRS.2023.3240848.
- Kobal M, Bertoncelj I, Pirotti F, Dakskobler I, Kutnar L. 2015. Using LiDAR data to analyse sinkhole characteristics understory relevant for vegetation under forest cover—case study of a high karst area in the Dinaric Mountains. PLoS One. 10(3):e0122070. doi: 10.1371/journal.pone.0122070.
- Krieger G, Moreira A, Fiedler H, Hajnsek I, Werner M, Younis M, Zink M. 2007. TanDEM-X: a satellite formation for high-resolution SAR interferometry. IEEE Trans Geosci Remote Sens. 45(11):3317–3341. doi: 10.1109/TGRS.2007.900693.
- Li B, Xie H, Tong X, Liu S, Xu Q, Sun Y. 2023. Extracting accurate terrain in vegetated areas from ICESat-2 data. Int J Appl Earth Obs Geoinf. 117:103200. doi: 10.1016/j.jag.2023.103200.
- Li H, Zhao J, Yan B, Yue L, Wang L. 2022. Global DEMs vary from one to another: an evaluation of newly released Copernicus. NASA and AW3D30 DEM on selected terrains of China using ICESat-2 altimetry data. Int J Digital Earth. 15(1):1149–1168. doi: 10.1080/17538947.2022.2094002.
- Li H, Zhao J. 2018. Evaluation of the newly released worldwide AW3D30 DEM over typical landforms of China using two global DEMs and ICESat/GLAS data. IEEE J Sel Top Appl Earth Obs Remote Sens. 11(11):4430–4440. doi: 10.1109/JSTARS.2018.2874361.
- Liu XY. 2008. Airborne LiDAR for DEM generation: some critical issues. Prog Phys Geogr. 32(1):31–49. doi: 10.1177/0309133308089496.
- Neuenschwander A, Guenther E, White JC, Duncanson L, Montesano P. 2020. Validation of ICESat-2 terrain and canopy heights in boreal forests. Remote Sens Environ. 251(112110):112110. doi: 10.1016/j.rse.2020.112110.
- Neuenschwander AL, Magruder LA. 2019. Canopy and terrain height retrievals with ICESat-2: a first look. Remote Sensing. 11(14):1721. doi: 10.3390/rs11141721.
- Paynter I, Schaaf C, Bowen J, Deegan L, Peri F, Cook B. 2019. Characterizing a New England Saltmarsh with NASA G-LiHT airborne Lidar. J Remote Sens. 11(5):509. doi: 10.3390/rs11050509.
- Santillan JR, Makinano-Santillan M. 2016. Vertical accuracy assessment of 30-m resolution ALOS, ASTER, and SRTM global Dems over northeastern Mindanao, Philippines. Int Arch Photogramm. Remote Sens Spatial Inf Sci. xli-b4:149–156. doi: 10.5194/isprs-archives-xli-b4149-2016.
- Shang DS, Zhang YS, Dai CG, Ma Q, Wang Z. 2022. Extraction strategy for ICESat-2 elevation control points based on ATL08 product. Trans Geosci Remote Sens. 60:1–12. doi: 10.1109/TGRS.2022.3218750.
- Tang X, Li S, Li T, Gao Y, Zhang S, Chen Q, Zhang X. 2021. Review on global digital elevation products. J Remote Sens. 25(1):167–181. doi: 10.11834/jrs.20210210.
- Tadono T, Nagai H, Ishida H, Oda F, Naito S, Minakawa K, Iwamoto H. 2016. Generation of the 30 M-mesh global digital surface model by ALOS PRISM. Int Arch Photogramm Remote Sens Spatial Inf Sci. XLI-B4:157–162. doi: 10.5194/isprs-archives-XLI-B4-157-2016.
- Tadono T, Takaku J, Tsutsui K, Oda F, Nagai H. 2015. ALOS world 3D (AW3D) global DSM generation. Geoscience & Remote Sensing Symposium. IEEE; p. 3822–3825. doi: 10.1109/IGARSS.2015.7326657.
- Vogeler JC, Hudak AT, Vierling LA, Evans J, Green P, Vierling KT. 2014. Terrain and vegetation structural influences on local avian species richness in two mixed-conifer forests. Remote Sens Environ. 147:13–22. doi: 10.1016/j.rse.2014.02.006.
- Wessel B, Huber M, Wohlfart C, Marschalk U, Kosmann D, Roth A. 2018. Accuracy assessment of the global TanDEM-X Digital elevation model with GPS data. ISPRS J Photogramm Remote Sens. 139:171–182. doi: 10.1016/j.isprsjprs.2018.02.017.
- Uuemaa E, Ahi S, Montibeller B, Muru M, Kmoch A. 2020. Vertical accuracy of freely available global digital elevation models (ASTER, AW3D30, MERIT, TanDEM-X, SRTM, and NASADEM). Remote Sensing. 12(21):3482. doi: 10.3390/rs12213482.
- Wessel B, Huber M, Wohlfart C, Bertram A, Osterkamp N, Marschalk U, Gruber A, Reuß F, Abdullahi S, Georg I, et al. 2021. TanDEM-X PolarDEM 90 m of Antarctica: generation and error characterization. The Cryosphere. 15(11):5241–5260., 2021. doi: 10.5194/tc-155241-2021.
- Wang M, Wei Y, Yang B, Xiao Z. 2021. Extraction and analysis of global elevation control points from ICESat-2/ATLAS data. Geomatics Inform Sci Wuhan Univ. 46(2):184–192. doi: 10.13203/j.whugis20200531.
- Wessel B. 2013. TanDEM-X ground segment – DEM products specification document. https://tandemx-science.dlr.de/. https://elib.dlr.de/120422/.
- Zhao SM, Cheng WM, Jiang JT, Sha W. 2020. Error comparison among the DEM datasets made from ZY-3 satellite and the global open datasets. J Geoinform Sci. 22(3):370–378. doi: 10.12082/dqxxkx.2020.190658.
- Zhang S, Lippitt CD, Bogus SM, Loerch AC, Sturm JO. 2016. The accuracy of aerial triangulation products automatically generated from hyper-spatial resolution digital aerial photography. Remote Sens Lett. 7(2):160–169. doi: 10.1080/2150704X.2015.1121299.