
 ?Mathematical formulae have been encoded as MathML and are displayed in this HTML version using MathJax in order to improve their display. Uncheck the box to turn MathJax off. This feature requires Javascript. Click on a formula to zoom.
Abstract
After the earthquake in Wenchuan in 2008, landslides have been happening frequently, causing a buildup of sediment in slopes and gullies. This creates a potential for mudslides and flash floods. It is important to create a model to assess the likelihood of landslides in Wenchuan County for disaster prevention. This study focuses on Wenchuan County, using 6180 co-seismic landslide sites as data. The relevant survey data is combined, and slope, normalized difference vegetation Index (NDVI), peak seismic acceleration (PGA), stream power index (SPI), topographic wetness index (TWI), distance from the road, distance from the fault, distance from the water system, relief intensity, aspect, curvature, land use type, and lithologic characters are chosen. The significance of the co-seismic landslide key influence factors is discussed. The study area’s disaster susceptibility was assessed using the informative hierarchical analysis method model (I-AHP) and fully connected neural network (FCNN) model; the evaluation’s findings mostly agreed with the survey’s actual findings. The study’s findings demonstrated that: (1) the FCNN model’s AUC value was 0.910, while the I-AHP model’s AUC value was 0.768, and the ROC curve and AUC value analysis indicated that the FCNN model outperformed the I-AHP model. (2) The three most significant influencing factors are lithology, topographic relief, and distance from roads; they account for 29.5%, 11%, and 10% of the total, respectively. Thus, landslide hazard research should be done in the high terrain undulating areas surrounding the road, and rock monitoring should be intensified in post-earthquake landslide-prone areas like Wenchuan County. (3) Given that Yingxiu Town is the epicentre of the region and that landslide disasters are highly likely to occur there, technical support for landslide disaster prediction, forecasting, safe prevention, and control in the area needs to be strengthened.
1. Introduction
The most catastrophic earthquake in modern Chinese history occurred on 12 May 2008, when it struck Wenchuan County, Aba Tibetan and Qiang Autonomous Prefecture, Sichuan Province. The magnitude of the earthquake was 8.0 Numerous potential geological hazards were set off by the earthquake, resulting in 50,000 collapses and landslides that covered 750 km2 and 5.25 billion m3 of loose sediments. It is vulnerable to mudslides, flash floods, and other disasters brought on by intense rains (Huang R Citation2011). It has been demonstrated that following a powerful earthquake, there will be decades of active geological disasters in the affected area. The features of secondary geological disasters that occur after an earthquake, such as mass occurrence and chain effect, will also manifest more prominently, and their scale will undoubtedly increase. To direct reconstruction efforts following an earthquake and avoid the emergence of new geological hazards in affected areas, a thorough examination of the laws and characteristics of earthquake geological disasters is crucial (Fan et al. Citation2022; Zhang et al. Citation2022). The 5.12 Wenchuan Earthquake-induced spatial distribution of landslides was chosen for analysis and simulation in this work. Distribution of earthquake-induced landslides was easily and precisely determined, and the potential disaster losses were assessed, taking into account the disaster control factors and the post-earthquake geohazard evolution trend. In conjunction with geographic information system (GIS) technology, the necessary geographic data is gathered and processed (Konurhan et al. Citation2023; Nath et al. Citation2023; Patil and Panhalkar Citation2023). Machine learning algorithms are then applied to build an assessment model for landslide susceptibility and investigate the reasons behind localized landslides. It is crucial to lessen the probability of landslides and prevent them from happening. Support vector machines are among the machine learning techniques that academics both domestically and internationally have used to assess the risk of landslides (Bui et al. Citation2016; Ghiasi et al. Citation2023). random forest (Sun D et al. Citation2020), decision tree (Gui et al. Citation2023; Hong Citation2023), artificial neural network (Polykretis and Chalkias Citation2018; Tran Van et al. Citation2021; Kong et al. Citation2023), etc. The aforementioned machine learning approaches can better take advantage of the non-linear relationship between the independent and dependent variables, mimic the complex relationship between landslide influencing factors and landslide categories (landslide or non-landslide), and achieve high prediction accuracy (Zhou X et al. Citation2022). Furthermore, a unique type of machine learning called deep learning is capable of handling challenging nonlinear problems. In order to produce accurate and trustworthy landslide susceptibility maps, researchers have already developed multilayer neural networks using deep learning to extract features and analyse the factors affecting landslides (Achu et al. Citation2024). For instance, long and short-term memory networks (Huang R et al. 2023; Yang et al. Citation2023), recurrent neural networks (Wang Y et al. Citation2020; Phuong Thao Thi et al. Citation2021), and convolutional neural networks (Wang Y et al. Citation2019; Jiang et al. Citation2023).
The assessment of the risk of landslides is still being conducted today. The conventional statistical and probabilistic analysis methods typically overlook the nonlinear or uncorrelated problems that exist in various types of factors, and they require a great deal of a priori knowledge. Additionally, there are limitations in solving the disaster susceptibility analysis when complex factors are involved (Chen C and Fan Citation2023). In response to the uncertain outcomes of the traditional weighted statistical model and the issue of complex nonlinearities in the influencing factors (Liu X et al. Citation2024), this paper constructs the hierarchical analysis method-information model (I-AHP) and fully connected neural network (FCNN), to evaluate the risk of landslides in the study area. Based on data quality and historical landslide data, the evaluation results of the two models are compared to determine which provides the best results for decision support regarding disaster prevention, mitigation, and relief.
2. Study area
The Wenchuan earthquake, which affected the largest area and caused the most damage, was the most powerful and catastrophic earthquake disaster to strike mainland China’s relatively densely populated middle and high mountainous regions in the previous century. The powerful earthquake severely damaged the provinces of Shanxi, Gansu, and Sichuan. The Wenchuan earthquake affected 51 counties (cities and districts), totalling more than 130,000 km2 and housing 19,867,000 people in the extremely hard-hit and hard-hit areas. Thirty percent of the 69,197 fatalities and 18,341 unaccounted for deaths from the Wenchuan earthquake are believed to have been caused by seismic landslides (Huang R and Li Citation2008).
Sichuan Province’s Aba Tibetan and Qiang Autonomous Prefecture, which is situated in the southeast of the prefecture, the plateau in the northwest of the province, and the northwest of Sichuan Province, includes Wenchuan County. The coordinates span an area of approximately 4,084 km2, 84 km wide from east to west and 105 km long from north to south. The coordinates are located between latitude 30° 45′ ∼ 31° 43′ north and longitude 102° 51′ ∼ 103° 44′ east. Southeast terrain is low, and northwest terrain is high. The Sichuan Basin lies in the southeast of the area, while high mountains rising to an elevation of over 3,000 m dominate the northwest. The Minjiang River, whose basin stretches from Wenchuan’s north to east, is the region’s principal river system. Its tributaries are the Shoujiang, Caopo, and Zaogu brain rivers. Wenchuan County has a complex geology, with bedrock and quaternary strata making up the majority of the lithology. Wenchuan County’s bedrock strata are composed of granite, schist, and gneiss. Wenchuan County has a temperate monsoon climate, with an average annual temperature of 12.9 °C (Wang X et al. Citation2021). The terrain rises from the southeast to the northwest. There is less precipitation and a semi-arid, hot river valley in the northern portion of the field of study, which is the area of Weizhou and Mianwu near the upper reaches of the Minjiang River. In the southern part of the study area, heavy rainfall is frequent in the area of Xuankou-Shuimo-Yingxiu, with an average annual rainfall of more than 1,100 mm. In the study area, rainfall makes up roughly 70% of the year, with the flood season primarily occurring from May to September. Geologic risks are common from June to August, when floods occur.
According to literature reviews, the frequency of geohazards peaked prior to the earthquake in years where meteorological conditions caused concentrated heavy rainfall. The peak’s cycle lasted roughly four to five years. This implies that, even though there were 600 geohazards in 2010 following the Wenchuan earthquake, based on the cyclical pattern of years with high rainfall prior to the earthquake, it appears that the peak has not yet been reached and that it may happen in 2011 or 2012. When the number of geohazards in the pre-earthquake, post-earthquake, and non-rainstorm years is compared, it is evident that the post-earthquake rainstorm year has roughly twice as many geohazards as the pre-earthquake rainstorm year, while the post-earthquake rainstorm year (2009) has four to five times as many geohazards as the pre-earthquake year. Based on the search and collection of local disaster data in Wenchuan, 6,180 landslide disaster sites with the same earthquake were selected (Huang R Citation2011).
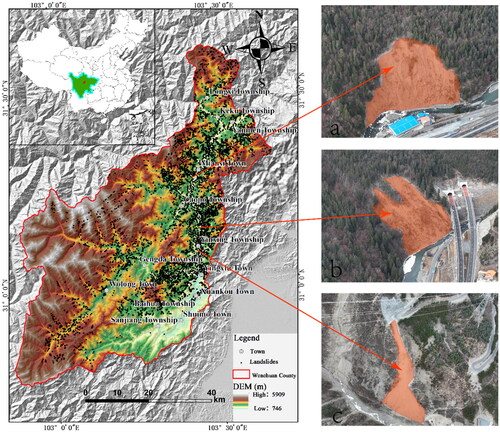
The distribution of landslide site hazards and the general status of research areas are shown in .
Figure 1. An outline of the research field and distribution map of landslide hazard sites (a. Near G4217, Miansi Township; b. Near G213, Yinxiu Township; c. Near X065, Yinxiu Township).
3. Data sources and research methods
3.1. Data source
The Sichuan Geological Survey provided data on the distribution of co-seismic landslide sites from the 5.12 Wenchuan earthquake. Digital elevation models with a resolution of 12.5 m were provided by the Sichuan Seismological Bureau and the Sichuan Bureau of Surveying, Mapping, and Geoinformation. These data are used to record topographic and geomorphological details such as elevation, slope, and curvature, in addition to hydrological data such as the topographic moisture index. The road and river data for Wenchuan County came from GF1 high-resolution remote sensing imagery. We were able to extract fracture zones and lithology vector data from geological data maps with a 5 m resolution by using GIS tools. Information on vegetation cover was gathered using remote sensing images from Landsat8 OLl. The extracted data were resampled with the same geospatial properties using ArcGIS resampling at a resolution of 12.5 m. The particular data used are listed below ().
Table 1. Data source of susceptibility evaluation in Wenchuan County.
3.2. Research methods
The study area’s geological information and data on geological disasters were collected and organized as the fundamental data for this research. After conducting a thorough analysis of the geological background and disaster distribution patterns in the study’s domain, select Slope, normalized difference vegetation Index (NDVI), peak seismic acceleration (PGA), stream power index (SPI), topographic wetness index (TWI), distance from the road, distance from the fault, distance from the water system, relief intensity, aspect, curvature, land use type, lithologic characters, and then test for their independence of the influencing elements using the Pearson correlation coefficient and multiple covariance diagnosis, the independence test of the influencing elements. And then use Extract Multiple Values to Points to extract the factors to the landslide points and export rows to quantify the weights and to characterize the factors in ArcGIS. Afterwards, the hierarchical analysis method and the information quantity model are applied to the evaluation of the susceptibility to geologic hazards, and the evaluation results are verified and compared (Wang Z and Yi Citation2009; Myronidis et al. Citation2016; Wen et al. Citation2017).
The aforementioned 13 factors are chosen as the characteristic factors based on research on the spatial distribution law of geological hazards of strong earthquakes and co-seismic earthquakes (Yuan et al. Citation2022). The historical landslide hazard points are divided into random non-landslide points and landslide points in the ratio of 7:3, in accordance with the method of extracting factor attributes from landslide point locations. This creates the sets for validation and training, which are then used to build the fully-connected neural network landslide susceptibility prediction model and create the landslide susceptibility maps based on the GIS (Guo et al. Citation2019). At last, a thorough analysis of the base model is conducted using the example of seismic landslides in the verified historical seismic zone.
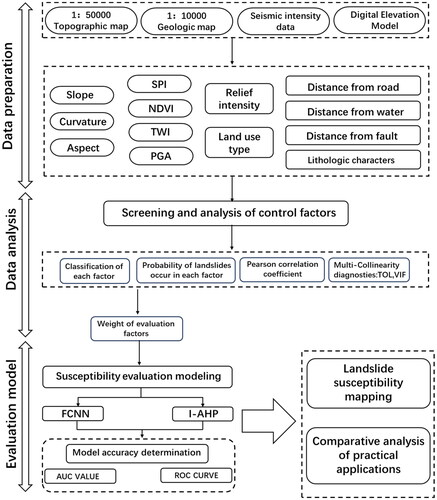
In comparing a probabilistic prediction model of the spatial distribution of earthquake-triggered landslides constructed by machine learning based on a fully connected neural network algorithm with a hierarchical analytical approach information model based on a dataset of seismic landslides events in historical seismic zones, the accuracy of the model’s prediction results was assessed using statistical techniques such as ROC (Yu et al. Citation2023). Furthermore, the significance of the different impacting factors is examined in light of the best model; the factors are ranked according to how much of a contribution they make to the model, allowing researchers to identify key triggers for the collapse and landslide risks in the study area. displays the research methodology flow chart.
Figure 2. Research method flow chart.
4. Evaluation of landslide disaster vulnerability based on hierarchical analysis method-informative modelling
4.1. Analytic hierarchy process – information quantity model
The I-AHP method is combined with the information quantity model on the basis that each factor’s information quantity value has already been determined by the information quantity model. The hierarchical analysis method is then used to determine the weights
of each factor, which are then multiplied to obtain the weighted total information quantity value. The weighted total information volume is divided into different levels of susceptibility zones based on its size (Zhao HL et al. Citation2017). Among them, the calculation method of weighted total information value is shown in the expression:
(1)
(1)
In the formula: is the amount of information of a unit in the evaluation area;
is the weight value of the
th factor;
is the amount of information of the
th evaluating factor;
is the total number of evaluating units in the study area;
is the number of units containing the evaluating factor
in the field of research, and
is the total number of units with the distribution of hazards i in the field of research;
is the number of units with hazards distributed within a specific category within the factor
The numerous causes of landslides are categorized in this paper into two main groups: external triggers and natural control factors. The term "natural control factors" refers to the internal geologic environment factors, such as topography, hydrogeology, stratigraphy, lithology, and geological structure, that regulate the occurrence and breeding of landslides. The term "external triggering factors" describes the constantly shifting external medium conditions that affect the frequency of landslides. These conditions can be summed up as seismic activity and human engineering endeavours. Thirteen major influencing factors—slope, normalized difference vegetation index (NDVI), peak seismic acceleration (PGA), stream power index (SPI), topographic wetness index (TWI), distance from the road, distance from the fault, distance from the water system, relief intensity, aspect, curvature, land use type, and lithologic characters—are chosen based on research on the distribution law of strong earthquake geohazards as each region’s co-seismic geologic hazard susceptibility evaluation index for earthquakes (Tang et al. Citation2022; Wu et al. Citation2023). Through the previously mentioned analytic hierarchy process (Abdı et al. Citation2021), a judgment matrix is constructed for the following 13 factors as follows ():
Table 2. The weight of each factor.
Through consistency judgment, λmax is 14.3241; the consistency ratio was 0.0707. It is proved that the weight is effective and conforms to the consistency judgment.
4.2. Landslide hazard susceptibility assessment
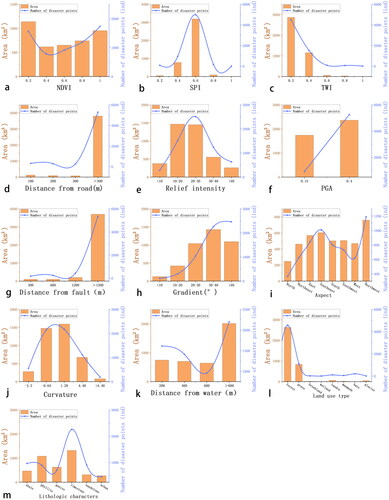
In order to determine the vulnerability of the study area to landslide hazards, 13 influencing factors were selected as indicators based on ground investigation data and the historical incidence of geological hazards in the region. provides the rationale behind the impacting factor selection. The field investigation data and previous geological hazards that have occurred in the study area were combined in this study to identify 13 influence factors that were used as evaluation indices of the susceptibility to landslide disasters of the same earthquake. The grid data with a resolution of 12.5 m × 12.5 m and projected as WGS1984 would be converted in ArcGIS 10.8 software, and and show the relationship between each graded influence factor and the disaster.
Figure 3. Wenchuan County impact factor classification atlas (a: NDVI grading b: SPI grading c: TWI grading d: distance from road grading e: relief intensity grading f: PGA grading g: distance from fault grading h: Slope grading i: aspect grading j: curvature grading k: distance from water system grading l: land use type grading m: lithology grading).
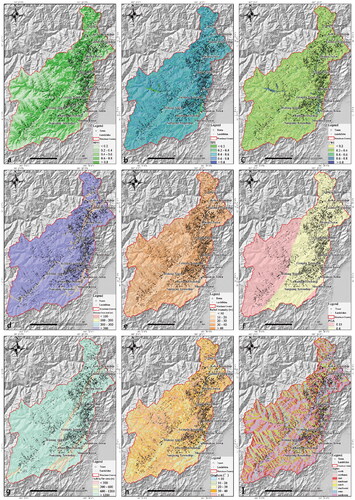
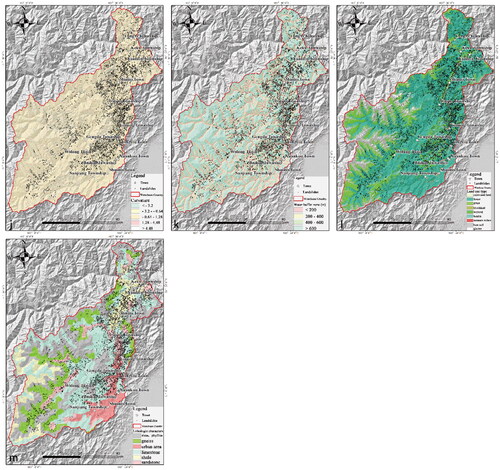
Table 3. Reasons for choice of influencing g elements.
Table 4. Detailed statistical table of each factor data in Wenchuan County.
After the model was established, the rasterized layer of each evaluation factor was calculated in ArcGIS software by using the rasterized layer calculation tool in the spatial analysis module, and the results were normalized so that the range of values was between 0 and 1. The probability of occurrence of the same-seismic geohazard was classified by the natural breaks method (Chen W et al. Citation2014; Ke et al. Citation2023). The susceptibility to co-seismic geohazards is categorized into five classes: very low, low, moderate, high and very high.
Based on statistics, the area of low susceptibility is about 558.33 km2, containing 226 landslides, accounting for 3.66%, with a disaster density of about 0.40 landslides/km2; the area of low susceptibility is about 995.02 km2, with 740 landslides, representing 11.97%, with a disaster density of about 0.74 landslides/km2; the area with moderate vulnerability is about 1,157.91 km2, with 1,480 landslides, representing 23.95%, with a disaster density of about 1.28 landslides/km2; the area with high vulnerability is about 912.14 km2, with 1,993 landslides, representing 32.25%, with a disaster density of about 2.18 landslides/km2; The area of very high susceptibility is about 475.25 km2, and the number of landslides is 1,741, representing 28.17%, with a disaster density of about 3.66 landslides/km2. The specific distribution is shown in .
From the spatial distribution of disaster sites, it is evident that the low, lower susceptibility region is mainly spread throughout the west, southwest and north of Wenchuan County, mostly very high mountains, high mountain areas, located in Wolong Township, the western part of Gengda Township, the western part of Caopo Township; high, very high susceptibility area is mainly distributed in the east-central part of Wenchuan County and the southern part of Wenchuan County, especially in the Yingxiu Township as the centre and its surrounding areas for the landslide disaster high susceptibility area in general.
5. Landslide susceptibility assessment based on machine learning
5.1. Fully connected neural network model
The study uses FCNN to establish a model for spatial prediction of landslide hazards in the research area, and the sigmoid function is chosen as the activation function in this paper. The loss function can reflect the degree of artificial neural network fit to the data, the loss function used in this paper is the binary cross entropy, the formula is as follows:
(2)
(2)
(3)
(3)
where
is the loss corresponding to the nth sample.
The FCNN Model uses Python 3.9 to program all of its algorithms. Weight decay is a method that has been widely used to suppress overfitting, and it prevents overfitting. By penalizing large weights during the learning process, the method suppresses overfitting. The activation function is the sigmoid function, and the maximum number of training cycles is 20,000. The model uses a combination of 13 co-seismic landslide characterization factors to sample data from the co-seismic landslide database. The sampled data is then randomly assigned in a 7:3 ratio between the training and validation datasets for each event. The model with optimal capacity is obtained through simulation training. The optimal model is finally applied to the fast prediction of the spatial distribution probability of earthquake-induced landslides (Sun Z et al. Citation2012; Luo et al. Citation2020).
5.2. Sample data set processing
Accurate sample data is a prerequisite for model learning, to ensure that the information is reliable and to meet the needs of model training, this paper adopts the window extraction method to construct the dataset, and the overall process is shown in . In the preprocessing stage, the landslide cataloguing map is binarized into two types: landslide and non-landslide (Zhao Z et al. Citation2022). Landslide points are 1 and non-landslide points are 0 for data screening. Each landslide influence factor is dynamically stretched between 0 and 255 by histogram equalization, so that it still has rich and obvious features under the single-band bitmap, which is convenient for subsequent model reading and processing (Yun et al. Citation2015). Traditional methods for extracting factor attributes based on landslide points rely heavily on the accuracy of landslide locations. Landslide is a complex physical process and its occurrence is often intimately associated with the external environment. Based on this, this study uses a moving window to extract the spatial neighbourhood of landslides and construct a feature dataset. In this experiment, the pixel bitmap of the study area was acquired at 12.5 m resolution. After testing, 13 pixels were finally set as the window edge length. The results show that the image and window scale used may contain enough features to evade data redundancy. The window is moved one pixel step at a time, and the centre pixel of the window in the landslide catalogue is used as a landslide or non-landslide marker sample to determine the correlation between the surroundings and the centre point. In addition, considering the small number of landslides, insufficient samples and small areas, a data enhancement process is introduced in the study to expand the dataset by expanding a limited number of landslide positive samples and the corresponding factorized images by horizontal and vertical flipping. An increase in the proportion of positive and negative samples will reduce the prediction accuracy of positive samples, which is contrary to the goal of landslide warning. Therefore, this paper uses a randomized balanced sampling strategy to set the number of non-landslide samples. Finally, landslide and non-landslide samples constitute the overall dataset. After the dataset is disrupted, it is proportionally divided into training set and validation. The training set is used to learn landslide features and train the internal parameters of the model. The validation set is used to test the training state of the model as a reference for optimizing the hyperparameters of the model (Stumpf and Kerle Citation2011; Goetz et al. Citation2015; Tehrany et al. Citation2015).
5.3. Landslide hazard assessment
After the establishment of the machine learning model, the rasterized layers of each evaluation factor were calculated in ArcGIS software using the raster layer calculation tool inside the spatial analysis module, and the results obtained were normalized so that the value domain was between 0 and 1. The probability of occurrence of the co-seismic landslide disaster was graded using the natural breaks method, and the spatial probability of earthquake-induced spatial landslides was categorized into five grades, namely, very low, low, moderate, high, and very high.
Based on statistics, the very low area is about 1392.96 km2, containing 468 landslides, representing 7.54%, with a hazard density of about 0.34 landslides/km2; the low susceptibility area is about 937.98 km2, with 986 landslides, representing 15.88%, with a hazard density of about 1.05 landslides/km2; and the moderate susceptibility area is about 714.58 km2; The number of landslides is 1207, representing 19.43%, and the disaster density is about 1.69 landslides/km2; the area with high vulnerability is about 631.62 km2; the number of landslides is 1602, representing 25.79%, and the disaster density is about 2.54 landslides/km2; the area with very high vulnerability is about 421.49 km2; the number of landslides is 1827, representing 29.42%; the density of disasters is about 4.33 landslides/km2 .The specific distribution is shown in .
6. Results and analysis
6.1. Independence verification of influence factors
6.1.1. Correlation analysis of the factors
Using the Correlation Plot plug-in of Origin plotting software, the matrix of correlation coefficients between the 13 influencing factors can be obtained and visualised to obtain . Positive correlations are shown in red in the figure, and negative correlations are shown in blue. Redder is a colour that indicates a stronger correlation between two variables. The correlation coefficient’s size is directly correlated with the circle’s size. According to the figure, slope and topographic relief have a correlation coefficient of 0.8, meaning that their analyses are complementary to one another and that they both have a good correlation with the incidence and allocation of landslides in the region. The other factors have correlation coefficients that are lower than 0.6, and their degrees of correlation are weaker, indicating a small amount of factor interaction.
6.1.2. Multi-Collinearity test
Using covariance analysis and SPSS software, the Tolerance (TOL) and Variance inflation factor (VIF) values of the landslide susceptibility evaluation factors were determined, as indicated in . With the exception of the terrain relief and slope evaluation factors, all other factors’ TOL are above 0.8, significantly higher than the 0.1 threshold value; the VIF value is less than 1.5, significantly lower than the 5 or 10 threshold values, indicating that there is no multicollinearity among the chosen factors and confirming the reasonableness of the evaluation indexes once more.
Table 5. Collinearity diagnostic results of influence factors.
6.2. Precision evaluation of the models
6.2.1. Comparison of ROC and AUC results
In machine learning, the ROC curve (Receiver Operating Characteristic Curve) is a graphical tool that depicts the performance of a classifier, and the AUC (Area Under the Curve) value represents the area under the ROC curve, which are two important metrics used to evaluate the performance of a binary classification model. The accuracy of a machine learning model is influenced by both the learning algorithm and the selection of hyperparameters and features. If hyperparameters are not properly chosen, the model’s accuracy may be significantly reduced regardless of the chosen method (Lv et al. Citation2021). In this study, the selected model is set up before it is trained, and a set of optimal hyperparameters is selected later based on the experiments (Zhang S Citation2022). Fully connected neural networks have more than a dozen hyperparameters, the main hyperparameters are learning rate, batch_size, epoch, activation function, loss function. From the optimal model ROC curves and AUC obtained after several adjustments, the predicted AUC values are between 0.839 and 0.977, with high accuracy. While in traditional methods, the precision of the model determines the choice of factors and weights, this study adopts the hierarchical analysis method-informative model, and the predicted AUC value is 0.768; the ROC curves of the two models can be generated by using the Sklearn package and the matplotlib visualization library in python. As shown, the predicted ROC curves for the AUC values of the generated models are plotted in .
Among them, the I-AHP model’s AUC value is 0.768, and the FCNN model’s AUC value is 0.910, both of which are higher than the reference value. This indicates that the FCNN model’s accuracy for the Wenchuan region is greater than the I-AHP model’s.
The following table shows the percentage of landslides in different susceptibility zones and the landslide density calculated by superimposing the historical landslides. The results of the two methods show that landslide density progressively rises from very low susceptibility, low susceptibility, moderate susceptibility, high susceptibility and very high susceptibility areas. This suggests that the results of each method generally correspond to the real situation. The following provides a summary of the comparative findings ().
Table 6. Landslide susceptibility statistics of wenchuan county based on FCNN and I-AHP.
From the above table, the landslide percentage generally rises with the susceptibility class, and there is a strong positive correlation between the susceptibility class and the landslide density. The historical landslide percentage and density in the results obtained by the FCNN model are higher than those of the I-AHP model in the high susceptibility area and very high susceptibility area, while the historical landslide percentage and density in the I-AHP model are lower than those of the FCNN model in the low susceptibility area and lower susceptibility area. These differences suggest that the results obtained by the FCNN model are more accurate to the real situation.
6.2.2. Importance ranking of impact factors
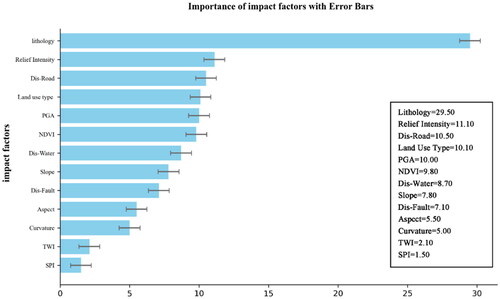
Section 6.1 derives intervals of correlation between each influence factor and the occurrence of co-seismic landslides through a preliminary analysis of the correlation between each influence factor and the occurrence of co-seismic landslides. However, this analysis does not account for the significance of each factor in predicting the susceptibility to co-seismic landslides. The degree to which various impact factors influence a region’s susceptibility to co-seismic landslides is reflected in the significance of those factors. Thus, determining and evaluating each indicator factor’s significance can serve as a foundation for managing the risk of landslides. The error bars also show the confidence interval for each influence factor’s importance, indicating that each influence factor’s true importance is most likely to fall within this range. The 13 impact factors in the FCNN model were analysed using SPSS, and origin2018 software was used to determine the significance of each factor’s error bars. Lithology > Relief Intensity > Distance from Road > Land Use Type > PGA > NDVI > Distance from Water > Slope > Distance from Fault > Aspect > Curvature > TWI > SPI are the 13 impact factors, as shown in , in order of relative importance. The importance ratios of lithology, relief intensity and distance from the road, which are the three most significant impact factors, contributed the most to the model and are 29.5%, 11.1%, and 10.5% respectively, indicating that these three impact factors are significant contributors to co-seismic landslide hazards in the region of research and should not be disregarded in the assessment of co-seismic landslide susceptibility. The study area’s susceptibility to co-seismic landslides is not significantly affected by curvature, TWI, and SPI, as indicated by their lowest percentages of importance of 5.50%, 5.00%, and 2.10% respectively. Additionally, the error bars for each of the influence factors in the figure show very similar confidence intervals. This indicates that the uncertainties between the influence factors are small, implying that their measurements are stable. As a result, it is likely that the true values of the factors are close to each other in a statistical sense and not significantly different. This suggests that the factors may have a similar impact on the subject of the study, or they may be influenced by similar control factors or sources of error. Further research may be necessary to fully understand the relationships and differences between the factors when comparing them.
7. Discussion
The majority of co-seismic landslides in Wenchuan County’s history have occurred in the susceptibility zone, primarily in Yingxiu Town and the surrounding areas. The results show that the evaluation models and sensitivity factors chosen are reasonable given the co-seismic landslides’ observed frequency and actual occurrence. These findings agree with those of other research assessing the risk of landslides (Han et al. Citation2023; Li Y et al. Citation2023; Yang J, Xu, et al. 2023; Yang X, Fan, et al. 2023).
Several factors, including the quantity of landslide and non-landslide data used (Liu Q et al. Citation2023), the choice of evaluation factors (Li X et al. Citation2022), the consideration of various types of landslides (Huang F et al. Citation2023), and other factors, can result in uncertainty in landslide susceptibility evaluations (Achu et al. Citation2023). Use of statistical and machine learning techniques is common. To analyse and model the spatial distribution of landslides caused by earthquakes, it is unclear which approach is more appropriate (Cengiz and Ercanoglu Citation2022). There’s no clear way to determine which statistical method improves the accuracy of these models, and the wide range of statistical methods used to predict landslide susceptibility for co-seismic earthquakes increases the uncertainty in machine learning models. The I-AHP method, one of the more established statistical techniques for landslide susceptibility partitioning, is still in use today primarily due to its main benefit: accurate historical landslide data is not needed for this method to function (Liu X et al. Citation2024). There is a degree of uncertainty inherent in the results generated by such models because the model has to weight the assessment factors, and the weights have to be decided after taking into account the particular requirements and features of the data (Quan and Lee Citation2012). Within this investigation, the FCNN model outperformed the I-AHP model in terms of accuracy.
Specifically, machine learning algorithms are designed to study and capture the nonlinear relationship between landslide events and their condition parameters (Bui et al. Citation2020). Unfortunately, there are some flaws in machine learning algorithms as well. For example, the model accuracy can be affected by regional variability (Youssef et al. Citation2023), inadequate sample group structure (Khabiri et al. Citation2023), negative sample selection procedures (Zhou S et al. Citation2021), and the displacement of the proportion of positive and negative samples (Liu C Citation2023). Additionally, the model accuracy can be negatively impacted by attribu te and dimension differences, insufficient normalization of evaluation factors, and the loss of significant factors. To increase the accuracy of the model, this study quantifies and normalizes the factors, divides similar subregions to construct the model, and analyses the correlation and covariance of the evaluation factors, demonstrating the rationality of the model’s selection of evaluation factors. It also employs a random balanced sampling strategy to ascertain the number of non-landslide samples (Chang et al. Citation2023). Furthermore, the study selected sample points from the same-seismic landslides that occurred during large earthquakes, and machine learning techniques were compared with different statistical techniques to establish an earthquake-induced landslide susceptibility model. In future studies, multi-year time-series landslide inventories and information on non-representative or infrequent extreme events (e.g. extreme rainfall, floods, and earthquakes) could be used to assess the spatial and temporal correspondence between triggering events and landslides (Jones et al. Citation2021).
8. Conclusions
For the landslide susceptibility assessment modelling in Wenchuan County, 6180 landslides of the co-seismic landslides were selected as sample points, in which the AUC value of the machine learning FCNN model was 0.910, and that of the traditional weighted statistical I-AHP model was 0.768, and the analysis of the ROC curves and the AUC values showed that the FCNN model was superior to the I-AHP model.
The following 13 factors have been identified as the major influencing factors: slope, NDVI, PGA, SPI, TWI, distance from the road, distance from the fault, distance from the water system, relief intensity, aspect, curvature, land use type and lithologic characters have been selected as the key influencing factors, and the importance ratios of lithology, relief intensity and distance from roads are 29.5%, 11.10% and 10.05% respectively, which are important triggering factors for the assessment of the susceptibility of co-seismic landslides in the study area, and should not be neglected in the evaluation of the susceptibility of co-seismic landslides, and should be considered as a key factor in the planning of landslide prevention and control, monitoring, early warning facilities deployment and ecological rehabilitation.
The etiological characteristics of co-seismic landslides include three main aspects. (1) Areas with limestone and phyllite lithology accounted for 50% of the co-seismic landslides. Phyllite is found in the regional metamorphic terrain of the eroded mountain belts, and the majority of limestone areas have rough surfaces, thin soil layers, and delicate ecosystems that make them vulnerable to landslides and soil erosion ( and ). (2) Terrain undulations between 10° and 30° are home to 60% of the co-seismic landslide hazards (). (3) In the study area, the construction of roads, including national highways G213, G317, and G350, is closely associated with landslides caused by human activity ( and ) Explosions coincided with these constructions, causing slope excavation and upsetting the slope equilibrium.
Figure 5. Mapping landslide vulnerability in wenchuan county.
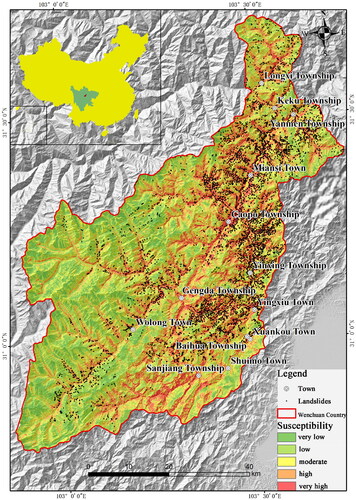
Figure 6. Deep learning model flowchart.
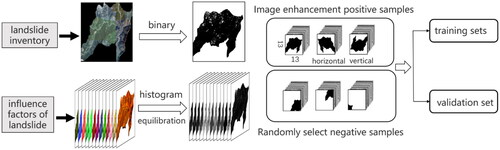
Figure 7. Landslide susceptibility mapping in Wenchuan County based on FCNN modelling.
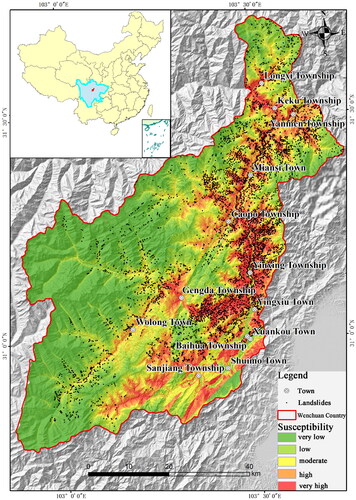
Figure 8. Pearson correlation values between factors.
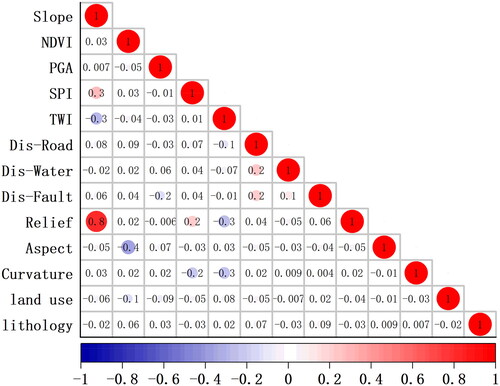
Figure 4. Association between the classification of factors influencing landslides and the allocation of landslides (a: NDVI classification b: SPI classification c: TWI classification d: distance from road classification e: relief intensity classification f: PGA classification g: distance from fault classification h: Gradient classification i: aspect classification j: curvature classification k: distance from water system classification l: land use type classification m: lithology classification).
Disclosure statement
No potential conflict of interest was reported by the author(s).
Data availability statement
Data that support the findings of this study are available from the corresponding author upon reasonable request.
Figure 9. ROC curve of AUC value prediction.
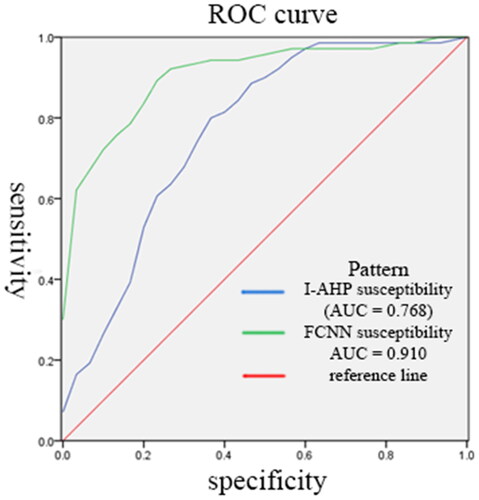
Figure 10. Landslide susceptibility statistics of Wenchuan County based on FCNN model and I-AHP model.
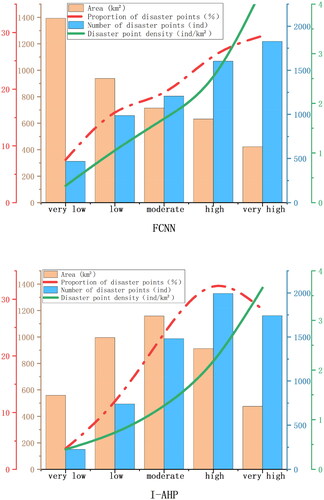
Figure 11. Importance of impact factors with error bars.
Additional information
Funding
References
- Abdı A, Bouamrane A, Karech T, Dahri N, Kaouachi A. 2021. Landslide susceptibility mapping using GIS-based fuzzy logic and the analytical hierarchical processes approach: a case study in constantine (North-East Algeria). Geotech Geol Eng. 39(8):5675–5691. doi: 10.1007/s10706-021-01855-3.
- Achu AL, Aju CD, Di Napoli M, Prakash P, Gopinath G, Shaji E, Chandra V. 2023. Machine-learning based landslide susceptibility modelling with emphasis on uncertainty analysis. Geosci Front. 14(6):101657. doi: 10.1016/j.gsf.2023.101657.
- Achu AL, Thomas J, Aju CD, Vijith H, Gopinath G. 2024. Redefining landslide susceptibility under extreme rainfall events using deep learning. Geomorphology. 448:109033. doi: 10.1016/j.geomorph.2023.109033.
- Aditian A, Kubota T, Shinohara Y. 2018. Comparison of GIS-based landslide susceptibility models using frequency ratio, logistic regression, and artificial neural network in a tertiary region of Ambon, Indonesia. Geomorphology. 318:101–111. doi: 10.1016/j.geomorph.2018.06.006.
- Bui DT, Tsangaratos P, Nguyen V-T, Liem NV, Trinh PT. 2020. Comparing the prediction performance of a Deep Learning Neural Network model with conventional machine learning models in landslide susceptibility assessment. Catena. 188:104426. doi: 10.1016/j.catena.2019.104426.
- Bui DT, Tuan TA, Klempe H, Pradhan B, Revhaug I. 2016. Spatial prediction models for shallow landslide hazards: a comparative assessment of the efficacy of support vector machines, artificial neural networks, kernel logistic regression, and logistic model tree. Landslides. 13(2):361–378. doi: 10.1007/s10346-015-0557-6.
- Cengiz LD, Ercanoglu M. 2022. A novel data-driven approach to pairwise comparisons in AHP using fuzzy relations and matrices for landslide susceptibility assessments. Environ Earth Sci. 81(7):222. doi: 10.1007/s12665-022-10312-0.
- Chang Z, Huang J, Huang F, Bhuyan K, Meena SR, Catani F. 2023. Uncertainty analysis of non-landslide sample selection in landslide susceptibility prediction using slope unit-based machine learning models. Gondwana Res. 117:307–320. doi: 10.1016/j.gr.2023.02.007.
- Chen C, Fan L. 2023. Selection of contributing factors for predicting landslide susceptibility using machine learning and deep learning models. Stoch Environ Res Risk Assess. doi: 10.1007/s00477-023-02556-4.
- Chen M, Tang C, Wang X, Xiong J, Shi Q, Zhang X, Li M, Luo Y, Tie Y, Feng Q. 2021. Temporal and spatial differentiation in the surface recovery of post-seismic landslides in Wenchuan earthquake-affected areas. Ecol Inform. 64:101356. doi: 10.1016/j.ecoinf.2021.101356.
- Chen W, Li WP, Hou EK, Zhao Z, Deng ND, Bai HY, Wang DZ. 2014. Landslide Susceptibility Mapping Based on GIS and Information Value Model for the Chencang District of Baoji, China. Arab J Geosci. 7(11):4499–4511. doi: 10.1007/s12517-014-1369-z.
- Chen W, Li Y. 2020. GIS-based evaluation of landslide susceptibility using hybrid computational intelligence models. Catena. 195:104777. doi: 10.1016/j.catena.2020.104777.
- Fan X, Fan C, Dai L, Wang X, Luo Y, Wei T, Wang Y. 2022. Near real time prediction of spatial distribution probability of earthquake-induced landslides take the Lushan earthquake on June 1,2022 as an example. J Eng Geol. 30(03):729–739. doi: 10.13544/j.cnki.jeg.2022-0328.
- Ghiasi V, Pauzi NIM, Karimi S, Yousefi M. 2023. Landslide risk zoning using support vector machine algorithm. Geomech Eng. 34(3):267–284. doi: 10.12989/gae.2023.34.3.267.
- Goetz JN, Brenning A, Petschko H, Leopold P. 2015. Evaluating machine learning and statistical prediction techniques for landslide susceptibility modeling. Comput Geosci. 81:1–11. doi: 10.1016/j.cageo.2015.04.007.
- Gui J, Alejano LR, Yao M, Zhao F, Chen W. 2023. GIS-based landslide susceptibility modeling: a comparison between best-first decision tree and its two ensembles (BagBFT and RFBFT). Remote Sens. 15(4):1007. doi: 10.3390/rs15041007.
- Guo Z, Yin L, Huang F, Fu S, Zhang W. 2019. Evaluation of landslide susceptibility based on landslide classification and weighted frequency ratio model. Chinese J Rock Mech Eng. 38(02):287–300. doi: 10.13722/j.cnki.jrme.2018.0838.
- Han S, Liu B, Fan X, Feng T, Yang J, Zhou Z, Gong H, Luo J. 2023. A new approach for landslide susceptibility assessments based on KDE-MDBN: a case study from mountainous regions impacted by the Wenchuan earthquake, China. Environ Model Soft. 167:105759. doi: 10.1016/j.envsoft.2023.105759.
- Hong H. 2023. Assessing landslide susceptibility based on hybrid best-first decision tree with ensemble learning model. Ecol Indic. 147:109968. doi: 10.1016/j.ecolind.2023.109968.
- Huang F, Xiong H, Yao C, Catani F, Zhou C, Huang J. 2023. Uncertainties of landslide susceptibility prediction considering different landslide types. J Rock Mech Geotech Eng. 15(11):2954–2972. doi: 10.1016/j.jrmge.2023.03.001.
- Huang R. 2011. After Effect of geohazards induced by the Wenchuan earthquake. J Eng Geol. 19(02):145–151.
- Huang R, Li W. 2008. Research on development and distribution rules of Geohazards induced by Wenchuan earthquake on 12th May,2008. Chinese J Rock Mech Eng. 27(12):2585–2592.
- Huang W, Ding M, Li Z, Yu J, Ge D, Liu Q, Yang J. 2023. Landslide susceptibility mapping and dynamic response along the Sichuan-Tibet transportation corridor using deep learning algorithms. Catena. 222:106866. doi: 10.1016/j.catena.2022.106866.
- Jiang Z, Wang M, Liu K. 2023. Comparisons of convolutional neural network and other machine learning methods in landslide susceptibility assessment: a case study in Pingwu. Remote Sens. 15(3):798. doi: 10.3390/rs15030798.
- Jones J, Boulton S, Bennett G, Stokes M, Whitworth M. 2021. Temporal variations in landslide distributions following extreme events: implications for landslide susceptibility modeling. JGR Earth Surface. 126(7):e2021JF006067. doi: 10.1029/2021JF006067.
- Ke CY, He S, Qin YG. 2023. Comparison of natural breaks method and frequency ratio dividing attribute intervals for landslide susceptibility mapping. Bull Eng Geol Environ. 82(10):18. doi: 10.1007/s10064-023-03392-0.
- Khabiri S, Crawford MM, Koch HJ, Haneberg WC, Zhu Y. 2023. An assessment of negative samples and model structures in landslide susceptibility characterization based on Bayesian network models. Remote Sens. 15(12):3200. doi: 10.3390/rs15123200.
- Kong J, Zhuang J, Peng J, Zhan J, Ma P, Mu J, Wang J, Wang S, Zheng J, Fu Y. 2023. Evaluation of landslide susceptibility in Chinese loess plateau based on IV-RF and IV-CNN coupling models. Earth Sci. 48(05):1711–1729. doi: 10.3799/dqkx.2023.006.
- Konurhan Z, Yucesan M, Gul M. 2023. Integrating stratified best-worst method and GIS for landslide susceptibility assessment: a case study in Erzurum province (Turkey). Environ Sci Pollut Res. 30(53):113978–114000. doi: 10.1007/s11356-023-30200-9.
- Li X, Chong J, Lu Y, Li Z. 2022. Application of information gain in the selection of factors for regional slope stability evaluation. Bull Eng Geol Environ. 81(11):470. doi: 10.1007/s10064-022-02970-y.
- Li Y, Yang J, Han Z, Li J, Wang W, Chen N, Hu G, Huang J. 2023. An ensemble deep-learning framework for landslide susceptibility assessment using multiple blocks: a case study of Wenchuan area, China. Geomatics Nat Hazards Risk. 14(1):2221771. doi: 10.1080/19475705.2023.2221771.
- Liu C. 2023. Optimization of negative sample selection for landslide susceptibility mapping based on machine learning using K-means-KNN algorithm. Earth Sci Inform. 16(4):4131–4152. doi: 10.1007/s12145-023-01151-z.
- Liu Q, Tang A, Huang D. 2023. Exploring the uncertainty of landslide susceptibility assessment caused by the number of non–landslides. Catena. 227:107109. doi: 10.1016/j.catena.2023.107109.
- Liu X, Shao S, Shao S. 2024. Landslide susceptibility zonation using the analytical hierarchy process (AHP) in the Great Xi’an Region, China. Sci Rep. 14(1):2941. doi: 10.1038/s41598-024-53630-y.
- Luo Y, Wang B, Chen X. 2020. Research progresses of target detection technology based on deep learning. Semicond Optoelectron. 41(01):1–10. doi: 10.16818/j.issn1001-5868.2020.01.001.
- Lv Q, Zen B, Meng X. 2021. Early identification and influence range division method of collapse hazards based on UAV oblique photography technology. Bull Geol Sci Technol. 40(06):313–325 + 334. doi: 10.19509/j.cnki.dzkq.2021.0631.
- Myronidis D, Papageorgiou C, Theophanous S. 2016. Landslide susceptibility mapping based on landslide history and analytic hierarchy process (AHP). Nat Hazards. 81(1):245–263. doi: 10.1007/s11069-015-2075-1.
- Nath NK, Gautam VK, Pande CB, Mishra LR, Raju JT, Moharir KN, Rane NL. 2023. Development of landslide susceptibility maps of Tripura, India using GIS and analytical hierarchy process (AHP). Environ Sci Pollut Res. 31(5):7481–7497. doi: 10.1007/s11356-023-31486-5.
- Panchal S, Shrivastava AK. 2022. Landslide hazard assessment using analytic hierarchy process (AHP): a case study of National Highway 5 in India. Ain Shams Eng J. 13(3):101626. doi: 10.1016/j.asej.2021.10.021.
- Patil AS, Panhalkar SS. 2023. Remote sensing and GIS-based landslide susceptibility mapping using LNRF method in part of Western Ghats of India. Quat Sci Adv. 11:100095. doi: 10.1016/j.qsa.2023.100095.
- Phuong Thao Thi N, Panahi M, Khosravi K, Ghorbanzadeh O, Kariminejad N, Cerda A, Lee S. 2021. Evaluation of deep learning algorithms for national scale landslide susceptibility mapping of Iran. Geosci Front. 12(2):505–519. doi: 10.1016/j.gsf.2020.06.013.
- Polykretis C, Chalkias C. 2018. Comparison and evaluation of landslide susceptibility maps obtained from weight of evidence, logistic regression, and artificial neural network models. Nat Hazards. 93(1):249–274. doi: 10.1007/s11069-018-3299-7.
- Quan H-C, Lee B-G. 2012. GIS-based landslide susceptibility mapping using analytic hierarchy process and artificial neural network in Jeju (Korea). KSCE J Civ Eng. 16(7):1258–1266. doi: 10.1007/s12205-012-1242-0.
- Sajinkumar KS, Anbazhagan S. 2015. Geomorphic appraisal of landslides on the windward slope of Western Ghats, southern India. Nat Hazards. 75(1):953–973. doi: 10.1007/s11069-014-1358-2.
- Stumpf A, Kerle N. 2011. Object-oriented mapping of landslides using Random Forests. Remote Sens Environ. 115(10):2564–2577. doi: 10.1016/j.rse.2011.05.013.
- Sun D, Wen H, Wang D, Xu J. 2020. A random forest model of landslide susceptibility mapping based on hyperparameter optimization using Bayes algorithm. Geomorphology. 362:107201. doi: 10.1016/j.geomorph.2020.107201.
- Sun Z, Xue L, Xu Y. 2012. Overview of deep learning. Appl Res Comput. 29(08):2806–2810.
- Tang F, Qi S, Guo S. 2022. Spatio-temporal distribution pattern and susceptibility of reservoir-induced landslides in XiLuoDu hydropower station. J Eng Geol. 30(03):609–620. doi: 10.13544/j.cnki.jeg.2022-0119.
- Tehrany MS, Pradhan B, Mansor S, Ahmad N. 2015. Flood susceptibility assessment using GIS-based support vector machine model with different kernel types. Catena. 125:91–101. doi: 10.1016/j.catena.2014.10.017.
- Tran Van P, Trong Trinh P, Prakash I, Singh SK, Shirzadi A, Chapi K, Hai-Bang L, Lanh Si H, Nguyen Kim Q, Binh Thai P. 2021. Landslide susceptibility modeling using different artificial intelligence methods: a case study at Muong Lay district, Vietnam. Geocarto Int. 36(15):1685–1708. doi: 10.1080/10106049.2019.1665715.
- Wang X, Li S, Liu H, Liu L, Liu Y, Zeng S, Tang Q. 2021. Landslide susceptibility assessment in Wenchuan County after the 5.12 magnitude earthquake. Bull Eng Geol Environ. 80(7):5369–5390. doi: 10.1007/s10064-021-02280-9.
- Wang Y, Fang Z, Hong H. 2019. Comparison of convolutional neural networks for landslide susceptibility mapping in Yanshan County, China. Sci Total Environ. 666:975–993. doi: 10.1016/j.scitotenv.2019.02.263.
- Wang Y, Fang Z, Wang M, Peng L, Hong H. 2020. Comparative study of landslide susceptibility mapping with different recurrent neural networks. Comput Geosci. 138:104445. doi: 10.1016/j.cageo.2020.104445.
- Wang Z, Yi F. 2009. AHP-based evaluation of occurrence easiness of geological disasters in Mianyang City. J Nat Disasters. 18(01):14–23.
- Wen HJ, Xie P, Xiao P, Hu DP. 2017. Rapid susceptibility mapping of earthquake-triggered slope geohazards in lushan county by combining remote sensing with the AHP model developed for the Wenchuan earthquake. Bull Eng Geol Environ. 76(3):909–921. doi: 10.1007/s10064-016-0957-4.
- Wu WF, Guo SJ, Shao ZF. 2023. Landslide risk evaluation and its causative factors in typical mountain environment of China: a case study of Yunfu city. Ecol Indic. 154:110821. doi: 10.1016/j.ecolind.2023.110821.
- Yang J, Xu C, Jin X. 2023. Joint effects and spatiotemporal characteristics of the driving factors of landslides in earthquake areas. J Earth Sci. 34(2):330–338. doi: 10.1007/s12583-021-1465-4.
- Yang X, Fan X, Wang K, Zhou Z. 2023. Research on landslide susceptibility prediction model based on LSTM-RF-MDBN. Environ Sci Pollut Res. 31(1):1504–1516. doi: 10.1007/s11356-023-31232-x.
- Youssef K, Shao K, Moon S, Bouchard LS. 2023. Landslide susceptibility modeling by interpretable neural network. Commun Earth Environ. 4(1):162. doi: 10.1038/s43247-023-00806-5.
- Yu B, Chang M, Ni Z. 2023. Landslide hazard assessment in Northeast Afghanistan plateau based on optimized neural network. Earth Sci. 48(05):1825–1835.
- Yuan X, Liu C, Nie R, Yang Z, Li W, Dai X, Cheng J, Zhang J, Ma L, Fu X, et al. 2022. A comparative analysis of certainty factor-based machine learning methods for collapse and landslide susceptibility mapping in Wenchuan County, China. Remote Sens. 14(14):3259. doi: 10.3390/rs14143259.
- Yun H, Wu Z, Wang G. 2015. Enhancement of infrared image combined with histogram equalization and fuzzy set theory. J Comput Aided Des Comput Graphics. 27(08):1498–1505.
- Zhang S. 2022. Research on identifying specific gene sequence and its association based on deep learning [doctor thesis]. Jilin University.
- Zhang X, Tie Y, Li G. 2022. Characteristics and risk assessment of debris flows in the Wandong catchment after the MS 6.8 Luding earthquake. J Geomech. 28(06):1035–1045. doi: 10.12090/j.issn.1006-6616.20222827.
- Zhao HL, Yao LH, Mei G, Liu TY, Ning YS. 2017. A fuzzy comprehensive evaluation method based on AHP and entropy for a landslide susceptibility map. Entropy. 19(8):396. doi: 10.3390/e19080396.
- Zhao Z, Wang J, Mao X. 2022. A multi-dimensional CNN coupled landslide susceptibility assessment method. Geomatics Inform Sci Wuhan Univ. :1–19. doi: 10.13203/j.whugis20220325.
- Zhou S, Wang Y, Li Z, Chang J, Guo A. 2021. Quantifying the uncertainty interaction between the model input and structure on hydrological processes. Water Resour Manage. 35(12):3915–3935. doi: 10.1007/s11269-021-02883-7.
- Zhou X, Huang H, Zheng N, Shi X. 2022. Susceptility assessment of landslide after reservoir impoundment based on analytic hierarchy process. Geol Resour. 31(06):804–810. doi: 10.13686/j.cnki.dzyzy.2022.06.013.