
 ?Mathematical formulae have been encoded as MathML and are displayed in this HTML version using MathJax in order to improve their display. Uncheck the box to turn MathJax off. This feature requires Javascript. Click on a formula to zoom.
Abstract
Time-series SAR interferometry (InSAR) combining permanent scatterer and distributed scatterer (DS), has been strongly developed in subsidence monitoring. It is known that the Component extrAction and sElection SAR (CAESAR) is a recently presented approach of selecting and filtering scattering mechanisms for DS. This article proposes an improved CAESAR algorithm in InSAR processing. Phase optimization is performed by eigenvalue decomposition and principal component analysis of the coherence matrix that constructed based on the identified homogeneous pixels. In addition, only the interferometric phases with low noise are used to calculate the goodness-of-fit value. The improved method has been tested for subsidence monitoring over a nonurban area located in Xiongxian, China using 25 Sentinel-1A images. The results show that the improved method can provide the high spatial density of deformation measurements with accuracy ensured. Noticeable land subsidence is revealed widely within the north of Xiongxian county, particularly in Daying, Mijiawun and Beishakou towns.
1. Introduction
Land subsidence is a geological phenomenon in which the surface elevation is decreased under the effect of natural factors or human activities (Chen et al. Citation2019; Alam et al. Citation2022). It has the characteristics of slow formation and wide range of influence (Zhang et al. Citation2016). Land subsidence often causes damage to transportation, industrial and agricultural production, resources and the environment, which restricts the sustainable development of China’s society and economy (Liu Citation2018; Xu et al. Citation2021). The monitoring results of land subsidence are the basis for implementing prevention and control projects. Therefore, it is particularly important to carry out the research of time-series subsidence monitoring.
The traditional methods of subsidence monitoring mainly include leveling, total station and global navigation satellite systems (GNSS) measurement (Lu et al. Citation2019). Nevertheless, these techniques are based on point-by-point measurements, the acquired measurement points (MPs) of which are sparse and time-consuming to collect (Liu et al. Citation2020). As one of the earth observation technologies, the spaceborne interferometric synthetic aperture radar (InSAR) has the ability to acquire all-time data and provide large-scale surface deformation at a low cost (Robertson et al. Citation2020).
Permanent scatterer (PS) InSAR with single master image has a wide application in deformation monitoring (Ferretti et al. Citation2000; Wang and Zhu Citation2016; Costantini et al. Citation2016; Xu et al. Citation2021; Yazici and Gormus Citation2021). To realize a different methodology in paring acquisitions, Berardino et al. (Citation2002) presented small baseline subset (SBAS) InSAR with multiple master images (Hooper Citation2008; Pepe et al. Citation2015; Liu et al. Citation2018). Compared with PS-InSAR, SBAS-InSAR can increase the temporal sampling rate by using all the acquisitions included in the different small baseline subsets and provide spatially dense deformation (Berardino et al. Citation2002; Du et al. Citation2018; Yu et al. Citation2021). Furthermore, Zhang et al. (Citation2016) combined the advantages of PS and SBAS InSAR, and put forward Multiple-master Coherent Target Small-Baseline InSAR (MCTSB-InSAR), which was successfully applied to monitoring land subsidence over a large area (Zhang et al. Citation2019, Citation2021). MCTSB-InSAR uses multiple thresholds such as amplitude dispersion index and mean coherence coefficient to extract high coherent targets and local Delaunay triangulation to increase the redundancy of network connection (Zhang et al. Citation2016). However, it is difficult for these methods to obtain enough MPs in nonurban areas for detailed deformation information.
Previous studies have shown that DS generally correspond to natural targets, and nonurban areas are characterized by DS instead of PS (Ferretti et al. Citation2011). These targets, where many neighboring pixels share similar reflectivity values (Li Citation2014), are distributed scatterer (DS). Ferretti et al. (Citation2011) defined DS for pixels larger than the thresholds of statistically homogeneous pixel (SHP) number and goodness-of-fit value, and used their optimized values to replace the phase values of the original SAR image in the SqueeSAR algorithm (Wang et al. Citation2016). They utilized the Kolmogorov–Smirnov (KS) test to identify SHP, and applied the phase triangulation method (PT) based on maximum likelihood estimation to optimize the phase. Deformation estimation of the SqueeSAR algorithm is the result of processing the selected DS jointly with the PS in the traditional PS InSAR module.
The key to DS research lies in DS selection and phase optimization. SHP identification is the basis for effective description of DS statistical distribution characteristics (Liu et al. Citation2019). (Parizzi and Brcic, Citation2011) compared nonparametric KS test, Anderson–Darling (AD) test and parametric Generalized Likelihood Ratio Test (GLRT). The results have showed that GLRT performs best among the three tests when the amplitude of SAR image satisfies the assumption of Rayleigh distribution. Nevertheless, these tests need the large amount of calculation. To overcome the difficulty of high computational cost, Jiang et al. (Citation2015) put forward the Fast Statistically Homogeneous Pixel Selection (FaSHPS) algorithm that transformed the hypothesis testing problem from significant difference judgment to confidence interval estimation. This algorithm has been proved to be an effective tool for SHP identification (Jiang et al. Citation2016; Sun et al. Citation2018; Li et al. Citation2021). In addition, Cao et al. (Citation2015) improved the PT algorithm and proposed equal-weighted and coherence-weighted PT algorithms for DS phase optimization. The two proposed algorithms increase the signal-to-noise ratio of phase estimation, but greatly reduce computational efficiency. To solve this problem, Fornaro et al. (Citation2015) presented a new algorithm named Component extrAction and sElection SAR (CAESAR), which filtered the dominant scattering component of SAR signal (Cao et al. Citation2016; Liu et al. Citation2019).
It is known that the CAESAR algorithm uses covariance matrix eigen-decomposition-based algorithm to extract the power distribution of multi-baseline SAR data (Ansari et al. Citation2016; Verde et al. Citation2018). However, this algorithm has several shortcomings: (1) The covariance matrix is estimated based on the mean value of the pixels in the boxcar window. If the pixels in the window do not belong to the same feature, the estimation of covariance matrix is biased. (2) Working on covariance matrix is easily affected by the unbalances of backscattered power between SAR images. (3) In the process of DS selection, the goodness-of-fit value is calculated by the phases of all possible interferometric pairs (
is the number of SAR images), ignoring the adverse effect of low-quality interferometric phases.
In view of these shortcomings, this article makes the following improvements. Aiming at shortcomings (1) and (2), the coherence matrix rather than covariance matrix is used to reduce the effect of unbalanced backscattered power. The coherence matrix is constructed by homogeneous pixels identified by the FaSHPS algorithm. According to the shortcoming (3), we select the interferometric pairs with low noise and clear fringes to estimate the goodness-of-fit value. The focus of our research is to obtain as many reliable MPs as possible without loss of measurement accuracy in nonurban areas. We present a new method of coherence matrix eigen-decomposition, which optimizes the phase of multi-baseline SAR data on the basis of principal component analysis (PCA). The effectiveness of the improved method is proved by experiments on the Sentinel-1A datasets, which consists of 25 SAR images acquired by satellites over Xiongxian (China) from 22 January 2019 to 12 December 2019.
The rest of this article is organized as follows. Section 2 introduces the methods adopted in this work. Section 3 describes the study area and datasets. Section 4 shows the results of the experiments. Section 5 discusses the obtained results. Finally, Section 6 is the main conclusions of this study.
2. Study area and datasets
Xiongxian, belonging to Baoding City, Hebei Province, China, is situated in the northeast of Xiong’an New Area and the core of Beijing–Tianjin–Baoding region (Zhang et al. Citation2018). There are nine towns in Xiongxian county with a total area of about 524 km2 (Liu and Xue Citation2019). Xiongxian county is the hometown of hot springs in China, rich in geothermal resources. The precipitation is about 600 mm and the elevation is within the range of 8 to14 m. The transportation is convenient with Tianjin–Baoding railway running through the whole county. The boundary of the study area is described by the blue rectangle in , with geographic coordinates of 115°56′E-116°23′E, 38°52′N-39°12′N.
Figure 1. Location of Xiongxian county (outlined in black). The blue rectangle represents the outline of SAR images.
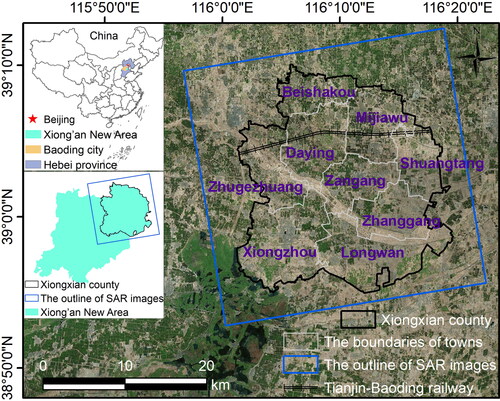
A total number of 25 Sentinel-1A images are acquired between 22 January 2019 and 12 December 2019 in ascending orbit with the polarization of transmit-vertical and receive-vertical (VV). The size of each pixel of the original Single-Look-Complex (SLC) images is 2.33 m in range and 13.96 m in azimuth, and the incident angle of radar are about 39.48°. The link to download Sentinel-1A images is provided (https://search.asf.alaska.edu/; https://dataspace.copernicus.eu/). In addition, Advanced Land Observing Satellite Digital Elevation Model (ALOS DEM) with a resolution of 30 m are applied for the generation of differential interferogram through the removal of the topographic phase contribution. shows the basic parameters of SAR images.
Table 1. Details of the processed SAR data.
3. Methodology
3.1. CAESAR algorithm overview
CAESAR algorithm is applied to remove noise and optimize phase. The statistical characterization of DS can be described using the covariance matrix (Ferretti et al. Citation2011). The definition of covariance matrix is
(1)
(1)
where
is the expectation. H represents the conjugate transpose.
is the original complex observation of
SAR images.
is estimated from complex data by performing spatial averaging on
pixels that belongs to the boxcar window
is an
Hermitian matrix whose elements include interferometric phase. The eigenvalue decomposition (EVD) of
is a linear combination of outer products of the orthonormal eigenvectors that weighted by the corresponding eigenvalues in the following form (Fornaro et al. Citation2015; Verde et al. Citation2018).
(2)
(2)
where the eigenvalue
are arranged in decreasing order.
is theeigenvector relative to the eigenvalue
In line with PCA, the first principal component is the one associated with the first eigenvalue-eigenvector pair
is approximately a single scattering mechanism
(where
).
is the optimal phase extracted from
(Ansari et al. Citation2016).
The goodness-of-fit measure has been used as a quality indicator of the CAESAR filtered phase. Indeed,
is generally considered as the temporal coherence of DS (Ferretti et al. Citation2011; Cao et al. Citation2015; Jiang and Guarnieri Citation2020). The value of
is between 0 and 1. It is an essential part of DS selection.
(3)
(3)
where
denotes the real part of complex data.
is the unit of imaginary part.
represents the interferometric phase between the original
th and
th SAR images. Most notably,
is calculated by
interferometric pairs before and after optimization. The larger the value of
is, the higher the coherence and the signal-to-noise ratio are.
3.2. Improved CAESAR in time-series InSAR processing
3.2.1. Improved CAESAR algorithm
In view of the shortcomings mentioned in the introduction, one modification aims to substitute the boxcar window with SHPs. FaSHPS algorithm is a widely used method to quickly identify SHP (Jiang et al. Citation2015).
Assuming that the amplitude for pixel
has a Rayleigh distribution with mean
and the variance
for
image. Based on the central limit theorem, the average amplitude
of SAR images with size
is supposed to follow a normal distribution with mean
and the variance
On the basis of the definition of standard normal distribution, the confidence interval of
is
(4)
(4)
where
is the probability, and
is the
percentile of the standard normal probability density function (Sun et al. Citation2018; Li et al. Citation2021). It can be found that the pixels falling into the interval of above formula are homogeneous with the pixel
when a significance level
is given. Moreover, pixels with SHP number greater than a certain value are regarded as the DS candidates.
Using the identified SHP, we improve formula (1). The covariance matrix can be written as
(5)
(5)
where
stands for the set of homogeneous pixels containing
adjacent pixels with similar backscattering properties. As previously mentioned, researching on coherence matrix instead of covariance matrix can compensate for unbalanced backscattered power. The coherence matrix
can be given by
(6)
(6)
where
is the normalized complex data and
(Cao et al. Citation2015; Wang et al. Citation2016). It can be known that the connection between
and
is
is also an
Hermitian matrix with elements containing interferometric phase. The EVD of
can be obtained as
(7)
(7)
where the eigenvalue
are arranged in decreasing order.
is the eigenvector relative to the eigenvalue
As a result, the phase of
is the optimal phase corresponding to the dominant scattering mechanism.
It can be seen from formula (3) that is calculated from the phases of all possible combined interferometric pairs. To avoid the adverse effects of low-quality interferograms, not all the interferometric phases are involved in the following process of deformation estimation. Therefore, it is inaccurate to calculate the value of goodness-of-fit and evaluate the quality of phase optimization by EquationEq. (3)
(3)
(3) . One improvement is to select those interferometric pairs with low noise and clear fringes to measure the goodness-of-fit.
Assuming the number of selected interferograms is
, the goodness-of-fit value
can be expressed as
(8)
(8)
where
indicates the interferometric phase between the original
th and
th SAR images.
and
are the optimal phases of the
th and
th SAR images, respectively. Most notably,
represents the set of SAR images corresponding to
interferometric pairs that we select.
DS selection is closely related to the goodness-of-fit value. is estimated from
interferograms filtered by the improved CAESAR module, which theoretically avoids the effect of low-quality interferometric phase. Pixels with
higher than a certain threshold are extracted from DS candidates, and the corresponding phase values of the original SAR images are substituted with their optimized values.
3.2.2. Time-series InSAR processing
The improved CAESAR algorithm is performed in the framework of MCTSB-InSAR to extend the analysis of coherent targets interferometry in nonurban areas. This method is defined as the improved CAESAR-InSAR in the following. shows the processing flowchart of the improved method for deformation estimation.
Figure 2. Flow chart of the improved method.
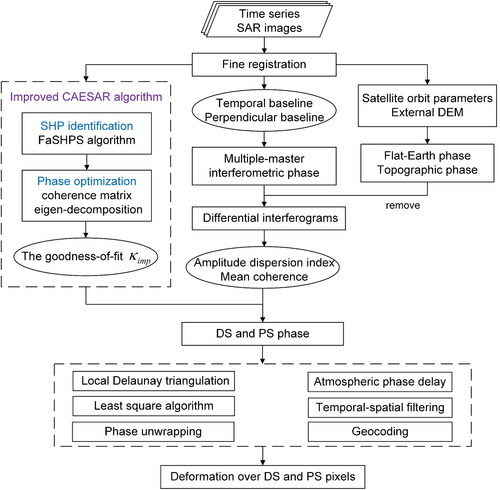
Time-series SAR images with size are used for fine registration. Interferometric pairs with free combination are generated according to the pre-set thresholds of temporal and perpendicular baseline, and then,
interferograms with lower noise and clearer fringes are selected. After removing the flat-Earth and topographic phase through satellite orbit parameters and external DEM,
differential interferograms and coherence images are generated.
Some coherent targets (PS and a part of the DS) can be extracted based on the threshold of amplitude dispersion index and mean coherence (Zhang et al. Citation2016). Furthermore, we increase the density of DS by using improved CAESAR algorithm, which is on the basis of coherence matrix eigen-decomposition. The selected DS and PS pixels are connected by the local Delaunay triangulation (Liu et al. Citation2008; Zhang et al. Citation2011), which has advantages in the redundancy of network connection.
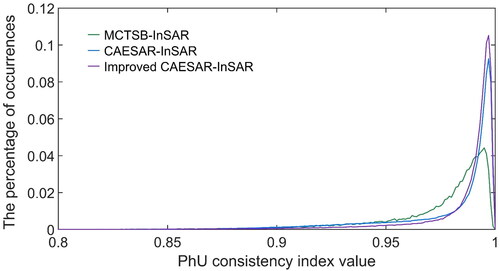
Surface deformation can be divided into linear and nonlinear displacement (Mora et al. Citation2003; Zhang et al. Citation2016). We establish the observation equation among linear deformation rate, DEM error and residual phase of those two selected adjacent pixels. The least square algorithm is used to estimate the linear deformation rate and DEM error. Unlike SBAS, MCTSB-InSAR completes the deformation parameter calculation and phase unwrapping (PhU) at the same time by investigating the quadratic phase difference of two adjacent coherent targets in space (Zhang et al. Citation2018, Citation2019). GACOS atmospheric correction model is applied for the generation of atmospheric phase (Ding et al. Citation2008; Chen et al. Citation2017). The nonlinear deformation phase, noise phase and atmospheric phase are separated from the residual phase by temporal-spatial filtering algorithm (Li et al. Citation2021). In particular, the PhU consistency index is evaluated to check the reliability of unwrapping (Verde et al. Citation2018).
(9)
(9)
where
is the residual errors of the
th interferogram. The value of
varies from 0 to 1. The closer its value is to 1, the lower the residual errors produced during the PhU process. The coherent pixels with consistency index less than the certain threshold (set to 0.8 in this work) are masked.
The linear and nonlinear deformations are combined to form the line-of-sight (LOS) displacement, which can be converted into vertical subsidence by using the cosine value of the incident angle. The subsidence map in the SAR coordinate system is converted to that in the geographic coordinate system by geocoding.
4. Results
4.1. SHP identification and phase optimization results
For 25 Sentinel-1A images () in TOPS mode, two consecutive burst SLCs need to be concatenated into one larger burst SLC. It is necessary to deramp the SLCs for the azimuth spectrum ramp. The SLCs are co-registered through the enhanced spectral diversity (ESD) algorithm with an accuracy of a few thousands of a pixel in the azimuth direction. We set the number of looks in the azimuth and range directions to 2 and 8, respectively. After implementing multi-look of SLCs, 1135 × 1115 pixels are cropped for the following experiments.
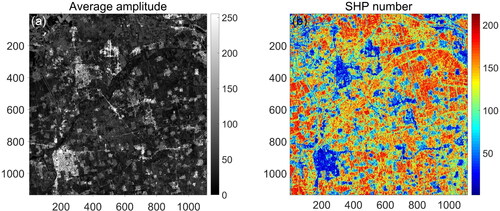
is the average amplitude and SHP number of the study area, respectively. Homogeneous pixels are identified by FaSHPS algorithm when The value of each pixel in represents the number of SHP selected in a 15 × 15 window. SHP number is 0, which indicates that there are no homogeneous pixels in the window perhaps because of isolated PS or noise points. SHP number is 224, which demonstrates that all the pixels in the window are homogeneous. It can be seen from that SHP number is relevant to land cover type. The number of SHP in buildings and structures is relatively small, but different from that in farmland.
Figure 3. The map of average amplitude and SHP number in the study area, respectively.
It is well known that 25 SAR images can generate up to 300 interferometric pairs. Interferograms of multiple-master images are generated under the limit of temporal baseline less than 120 days and perpendicular baseline smaller than 150 meters, respectively. We select 100 interferograms () with less noise and clearer fringes afterwards. The distribution of interferometric pairs is shown in .
Figure 4. Distribution of interferometric pairs. Black triangles stand for SAR acquisitions.

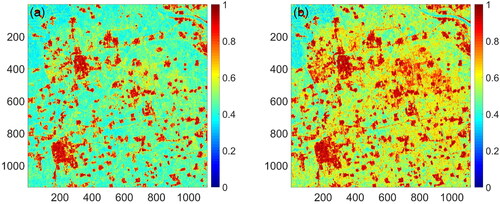
To compare the differences of CAESAR algorithm before and after improvement, we carry out two types of phase optimization according to the principle mentioned in Subsection 2.1 and Subsection 2.2.1. The goodness-of-fit values ( and
) are calculated to evaluate the quality of optimized phase, as shown in . It can be found that the goodness-of-fit value of vegetation is smaller than that of buildings and structures. 88% of the pixels in show greater goodness-of-fit value than that in . Most PS (such as pixels in buildings and structures) with goodness-of-fit value greater than 0.7 have less than 20 SHPs, so we regard pixels with SHP number more than 20 as DS candidates. The threshold of goodness-of-fit is set to 0.7 in this work. The proportion of pixels with
is higher than that of
which makes it possible to increase the number of DS.
Figure 5. The goodness-of-fit value of the study area obtained by (a) CAESAR algorithm and (b) improved CAESAR algorithm.
4.2. Deformation rate analysis
As stated in Subsection 2.2.2, the deformation estimation is performed through the improved CAESAR algorithm in the MCTSB-InSAR framework, which is defined as the improved CAESAR-InSAR. Similarly, the deformation estimation through the CAESAR module in MCTSB-InSAR processing chain, is named as CAESAR-InSAR. To testify the effectiveness of the improved method, we have compared the monitoring results of three methods (MCTSB-InSAR, CAESAR-InSAR and improved CAESAR-InSAR).
To evaluate improvements in the time-series processing, an important point is to assess the effectiveness of unwrapping. The PhU consistency index of these three methods are evaluated, as shown in . There are a larger number of occurrences when
is close to 1, especially in the improved CAESAR-InSAR processing. It indicates that the PhU improvement is more obvious by the improved method.
Figure 6. The percentage of the PhU consistency indexes.
The vertical deformation rate map in is obtained by three different methods. The location of land subsidence in are roughly the same. There is no land subsidence in the southwest of Xiongxian county. Noticeable land subsidence ( −10 mm year−1) is situated in the northern part of Xiongxian county, particularly in Daying, Mijiawu and Beishakou towns.
Figure 7. The deformation rates derived from Sentinel-1A images with different methods. (a) MCTSB-InSAR result, (b) CAESAR-InSAR result and (c) improved CAESAR-InSAR result.
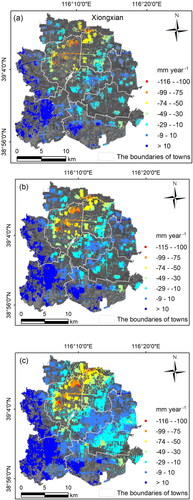
Twenty-nine thousand, seven hundred two points (PS and a part of the DS) are shown in with the maximum deformation rate of −116 mm year−1. Most of the PS are concentrated in the area where buildings are gathered in Xiongxian county, and no MP is in the water area. There are 113,638 points in with the maximum rate value of −115 mm year−1. Compared with , the extra points in are the number of MP extracted by CAESAR algorithm. Additionally, 154,607 points are exhibited in with the maximum rate value of −116 mm year−1. The extra points in are a proof of the increase in the number of MP selected by the improved CAESAR algorithm.
It is obvious that the number of MP in is more than that in . shows more detail deformation than in the area of noticeable subsidence, for example Daying town. The density of MP in is 1.4 times of that in , increasing greatly in Zhanggang town. In summary, the improved CAESAR-InSAR is effective in high spatial density of deformation measurements.
5. Discussion
5.1. Verification of monitoring results
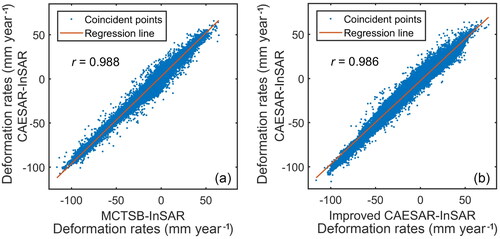
During the monitoring period, we are unable to obtain the measured leveling data. To verity the monitoring results derived from different methods (MCTSB-InSAR, CAESAR-InSAR and improved CAESAR-InSAR), the correlation coefficient is calculated from the deformation rates of all the completely coincident points. The absolute value of
(ranging from 0 to 1) measures the degree of close correlation between two different methods (Lu et al. Citation2019; Liu et al. Citation2020). Assuming that
and
represent the deformation rates estimated by two methods, their correlation coefficient
can be expressed as:
(9)
(9)
where
and
stand for the covariance and variance, respectively (He et al. Citation2021).
The value of is 0.988 in , which demonstrates that the deformation rates in are in consistency with those in . The correlation coefficient in is 0.986, which indicates that the deformation rates of is relatively close to that of . That is, the monitoring results of improved CAESAR-InSAR method are as accurate as those of MCTSB-InSAR method and CAESAR-InSAR method. Overall, the improved method is an effective way to increase the density of deformation measurements with accuracy ensured.
Figure 8. The scatter diagram and regress line of completely coincident points’ deformation rates. (a) Correlation between and (b) correlation between .
5.2. Damage caused by land subsidence
To obtain the detailed damage information caused by land subsidence, area statistics are performed according to the results of the improved CAESAR-InSAR. Referring to the existing literature (Hu et al. Citation2009; Wang et al. Citation2014), the grade of dangerous assessment index for land subsidence is different in different areas and actual situation. In this study, we consider the area with deformation rate less than −10 mm year−1 as dangerous area, and then, classified these dangerous areas into four grades. A total of four groups are deformation rate values of
It can be seen from that some public facilities have been suffered from land subsidence, including Tianjin–Baoding railway. The area of Xiongxian and the length along the railway line are statistically counted on the basis of the dangerous grading (see ).
Table 2. Area statistics of Xiongxian and length statistics along the railway line.
The total subsidence area (less than −10 mm year−1) affected by land subsidence is about 232.65 km2. The railway runs through Zhugezhuang, Daying, Mijiawu and Shuangtang towns, with the maximum rate value of −94 mm year−1. Except for Shuangtang town in the above four towns, the railway line suffered from surface deformation is 12.81 km long. Most of the severely affected railway line is located in Daying town. The damage will bring hidden dangers to people’s life and property safety. In light of this, related departments should give particular attention to this matter.
Based on the analysis of the existing data, land subsidence in Xiongxian county is mainly caused by the exploitation of geothermal and groundwater resources (Pang et al. Citation2017; Xia and Zhang Citation2017; Zhang et al. Citation2018). The geothermal distribution region of Xiongxian county that belongs to the southwest of Niutuozhen geothermal field, accounts for 60% of total area. The geothermal resources are shallow buried, with good water quality and great supply potential. Due to the increase of the exploitation of geothermal resources, the water level of geothermal field has decreased greatly. Most areas of Daying town have good conditions for geothermal development and a large number of geothermal wells, which has caused significant land subsidence in Daying town. As early as 2003, Xiongxian County began using geothermal energy through geothermal wells for industrial, living and tourism purposes. As of October 2018, Xiongxian County has collected a total of 52 geothermal wells. Land subsidence in Xiongxian County is closely related to geothermal exploitation (Li et al. Citation2022).
In addition, Xiongxian county, with more than 3000 plastic packaging enterprises, is the largest plastic packaging production base in northern China. Large-scale production of plastic packaging is likely to increase the groundwater exploitation and enhance the subsidence. Furthermore, water used in agriculture and aquaculture also increases the possibility of land subsidence. All the information provides the basis for taking corresponding prevention actions and is helpful to make land reclamation and ecological restoration plans.
5.3. Limitation and future work
In this work, we set the goodness-of-fit threshold in both CAESAR algorithm and improved CAESAR algorithm to 0.7. Most notably, the number of DS and the value of deformation are different with different goodness-of-fit thresholds. To be specific, the larger the value of goodness-of-fit is, the smaller the number of DS is, which cannot provide more detailed deformation. The smaller the value of goodness-of-fit is, the larger the number of DS is, which has a negative impact on the measurement accuracy. In view of this, the determination of goodness-of-fit threshold will be further analysed to help reasonably select DS pixels. Furthermore, we plan to use long time-series SAR images to enhance the real-time monitoring of land subsidence in the future.
6. Conclusions
A new method that based on improved CAESAR algorithm in time-series InSAR processing is presented to extend the analysis of coherent targets interferometry in nonurban areas. In the proposed strategy, the coherence matrix eigen-decomposition is used to optimize the phase of multi-baseline SAR data on the basis of PCA. The most contribution in our work is DS selection, which is a unique feature of the improved CAESAR-InSAR method. Specifically, only the phases of interferometric pairs with low noise and clear fringes are used to estimate the goodness-of-fit value, which is a quality indicator of phase optimization and an important parameter for DS selection.
The improved method is tested for land subsidence monitoring in nonurban areas of Xiongxian, China using 25 Sentinel-1A images. The correlation coefficient is calculated from the deformation rate of the completely coincident points obtained by three different methods (MCTSB-InSAR, CAESAR-InSAR and improved CAESAR-InSAR) to verify the monitoring results. Additionally, the area statistics of Xiongxian and the length along the Tianjin–Baoding railway line are statistically counted according to the dangerous grading, and the causes of land subsidence in Xiongxian are preliminary analysed.
Our experiments show that the number of MPs extracted by MCTSB-InSAR is much less than that obtained by CAESAR-InSAR and improved CAESAR-InSAR. The improved strategy can provide more deformation measurement details than other methods with measurement accuracy ensured, which proves that the improved CAESAR-InSAR method has great application potential in land subsidence.
There is noticeable land subsidence in the north of Xiongxian county, especially in Daying, Mijiawu and Beishakou towns. The main influencing factors of land subsidence are the exploitation of geothermal and groundwater resources. This research offers information to relevant departments for risk management purpose. Further analysis will be conducted on Xiongxian county to offer long-term displacements to relevant management departments.
Acknowledgement
We want to say our warmest thanks to reviewers for their constructive suggestions for this article.
Disclosure statement
No potential conflict of interest was reported by the authors.
References
- Alam MS, Kumar D, Chatterjee RS. 2022. Improving the capability of integrated DInSAR and PSI approach for better detection, monitoring, and analysis of land surface deformation in underground mining environment. Geocarto Int. 37(12):3607–3641.
- Ansari H, De Zan F, Adam N, Goel K, Bamler R. 2016. Sequential estimator for distributed scatterer interferometry. In: Proceedings of IGARSS 2016. Beijing, China: IEEE.
- Berardino P, Fornaro G, Lanari R, Sansosti E. 2002. A new algorithm for surface deformation monitoring based on small baseline differential SAR interferograms. IEEE Trans Geosci Remote Sens. 40:2375–2383.
- Cao N, Lee H, Jung HC. 2015. Mathematical framework for phase-triangulation algorithms in distributed-scatterer interferometry. IEEE Geosci Remote Sens Lett. 12:1838–1842.
- Cao N, Lee H, Jung HC. 2016. A phase-decomposition-based PSInSAR processing method. IEEE Trans Geosci Remote Sens. 54(2):1074–1090.
- Chen Y, Li Z, Penna NT. 2017. Interferometric synthetic aperture radar atmospheric correction using a GPS-based iterative tropospheric decomposition model. Remote Sens Environ. 204:109–121.
- Chen Y, Tan K, Yan S, Zhang K, Zhang H, Liu X, Li H, Sun Y. 2019. Monitoring land surface displacement over Xuzhou (China) in 2015-2018 through PCA-based correction applied to SAR interferometry. Remote Sens. 11:1494.
- Costantini F, Mouratidis A, Schiavon G, Sarti F. 2016. Advanced InSAR techniques for deformation studies and for simulating the PS-assisted calibration procedure of Sentinel-1 data: case study from Thessaloniki (Greece), based on the Envisat/ASAR archive. Int J Remote Sens. 37(4):729–744.
- Ding X, Li Z, Zhu J, Feng G, Long J. 2008. Atmospheric effects on InSAR measurements and their mitigation. Sensors. 8(9):5426–5448. doi: 10.3390/s8095426.
- Du Z, Ge L, Ng A, Li X. 2018. Investigation on mining subsidence over Appin-West Cliff Colliery using time-series SAR interferometry. Int J Remote Sens. 39(5):1528–1547.
- Ferretti A, Prati C, Rocca F. 2000. Nonlinear subsidence rate estimation using permanent scatterers in differential SAR interferometry. IEEE Trans Geosci Remote Sens. 38:2202–2212.
- Ferretti A, Fumagalli A, Novali F, Prati C, Rocca F, Rucci A. 2011. A new algorithm for processing interferometric data-stacks: squeeSAR. IEEE Trans Geosci Remote Sens. 49:3460–3470.
- Fornaro G, Verde S, Reale D, Pauciullo A. 2015. CAESAR: an approach based on covariance matrix decomposition to improve multibaseline-multitemporal interferometric SAR processing. IEEE Trans Geosci Remote Sens. 53(4):2050–2065.
- He Q, Zhang Y, Wu H, Luo Y. 2021. Mining subsidence monitoring with modified time-series SAR interferometry method based on the multi-level processing strategy. IEEE Access. 9:106039–106048. doi: 10.1109/ACCESS.2021.3099633.
- Hooper A. 2008. A multi-temporal InSAR method incorporating both persistent scatterer and small baseline approaches. Geophys Res Lett. 35: l16302.
- Hu B, Zhou J, Wang J, Chen Z, Wang D, Xu S. 2009. Risk assessment of land subsidence at Tianjin coastal area in China. Environ Earth Sci. 59(2):269–276. doi: 10.1007/s12665-009-0024-6.
- Jiang M, Ding X, Hanssen RF, Malhotra R, Chang L. 2015. Fast statistically homogeneous pixel selection for covariance matrix estimation for multitemporal InSAR. IEEE Trans Geosci Remote Sens. 53:1213–1224.
- Jiang M, Ding X, He X, Li Z, Shi G. 2016. FaSHPS-InSAR technique for distributed scatterers: a case study over the lost hills oil field, California. Chinese J Geophys. 59(10):3592–3603.
- Jiang M, Guarnieri AM. 2020. Distributed scatterer interferometry with the refinement of spatiotemporal coherence. IEEE Trans Geosci Remote Sens. 58(6):3977–3987.
- Li B, Li G, Na J, Tu L, Fan J, Wu Y. 2022. Identification of surface deformation caused by geothermal resource extraction using SBAS time-series technology. Bull Surv Mapp. (2):43–49.
- Li T. 2014. Deformation monitoring by multi-temporal InSAR with both point and distributed scatterers [PhD dissertation]. Chengdu, China: Southwest Jiaotong University.
- Li T, Zhang H, Fan H, Zheng C, Liu J. 2021. Position inversion of goafs in deep coal seams based on DS-InSAR Data and the probability integral methods. Remote Sens. 13:2898.
- Liu G, Luo X, Chen Q, Huang D, Ding X. 2008. Detecting land subsidence in Shanghai by PS-networking SAR interferometry. Sensors. 8(8):4725–4741. doi: 10.3390/s8084725.
- Liu J, Wang Y, Li Y, Dang L, Liu X, Zhao H, Yan S. 2019. Underground coal fires identification and monitoring using time-series InSAR with persistent and distributed scatterers: a case study of Miquan coal fire zone in Xinjiang, China. IEEE Access. 7:164492–164506. doi: 10.1109/ACCESS.2019.2952363.
- Liu L, Xue C. 2019. Explanatory comment on the geography and construction of Xiongxian county from historic documents. Archit J. (S1):164–168.
- Liu X. 2018. Study on ground subsidence monitoring in mining area based on multi spaceborne SAR images [PhD dissertation]. Xuzhou, China: China University of Mining & Technology.
- Liu Y, Fan H, Wang L, Zhuang H. 2020. Monitoring of surface deformation in a low coherence area using distributed scatterers InSAR: case study in the Xiaolangdi Basin of the Yellow River, China. Bull Eng Geol Environ. 80(1):25–39. doi: 10.1007/s10064-020-01929-1.
- Liu Y, Zhao C, Zhang Q, Yang C, Zhang J. 2018. Land subsidence in Taiyuan, China, monitored by InSAR technique with multisensor SAR datasets from 1992 to 2015. IEEE J Sel Topics Appl Earth Observ Remote Sens. 11(5):1509–1519.
- Lu L, Fan H, Liu J, Liu JL, Yin J. 2019. Time series mining subsidence monitoring with temporarily coherent points interferometry synthetic aperture radar: a case study in Peixian, China. Environ Earth Sci. 78(15):461. doi: 10.1007/s12665-019-8475-x.
- Mora O, Mallorqui JJ, Broquetas A. 2003. Linear and nonlinear terrain deformation maps from a reduced set of interferometric SAR images. IEEE Trans Geosci Remote Sens. 41:2243–2253.
- Pang Z, Kong Y, Pang J, Hu S, Wang J. 2017. Geothermal resources and development in Xiongan New Area. Bull Chinese Acad Sci. 32(11):1224–1230.
- Parizzi A,Brcic R. 2011. Adaptive InSAR Stack Multilooking Exploiting Amplitude Statistics: A Comparison Between Different Techniques and Practical Results. IEEE Geosci Remote Sensing Lett. 8(3):441–445. doi: 10.1109/LGRS.2010.2083631.
- Pepe A, Yang Y, Manzo M, Lanari R. 2015. Improved EMCF-SBAS processing chain based on advanced techniques for the noise-filtering and selection of small baseline multi-look DInSAR interferograms. IEEE Trans Geosci Remote Sens. 53(8):4394–4417.
- Robertson L, Andrew D, McNairn H, Hosseini M, Mitchell S, Abelleyra D, Verón S, Cosh MH. 2020. Synthetic aperture radar (SAR) image processing for operational space-based agriculture mapping. Int J Remote Sens. 41(18):7112–7144.
- Sun Q, Jiang L, Jiang M, Lin H, Ma P, Wang H. 2018. Monitoring coastal reclamation subsidence in Hong Kong with distributed scatterer interferometry. Remote Sens. 10:1738.
- Verde S, Reale D, Pauciullo A, Fornaro G. 2018. Improved small baseline processing by means of CAESAR eigen-interferograms decomposition. ISPRS J Photogramm Remote Sens. 139:1–13. doi: 10.1016/j.isprsjprs.2018.02.019.
- Wang H, Wang Y, Jiao X, Qian G. 2014. Risk management of land subsidence in Shanghai. Desalination Water Treat. 52:1122–1129.
- Wang M, Li T, Jiang L. 2016. Monitoring reclaimed lands subsidence in Hong Kong with InSAR technique by persistent and distributed scatterers. Nat Hazards. 82(1):531–543. doi: 10.1007/s11069-016-2196-1.
- Wang Y, Zhu X. 2016. Robust estimators for multipass SAR interferometry. IEEE Trans Geosci Remote Sens. 54(2):968–980.
- Xia J, Zhang Y. 2017. Water resource and pollution safeguard for Xiongan New Area construction and its sustainable development. Bull Chinese Acad Sci. 32(11):1199–1205.
- Xu X, Zhao D, Ma C, Lian D. 2021. Monitoring subsidence deformation of Suzhou subway using InSAR timeseries analysis. IEEE Access. 9:3400–3416. doi: 10.1109/ACCESS.2020.3047574.
- Yazici BV, Gormus ET. 2021. Investigating persistent scatterer InSAR (PSInSAR) technique efficiency for landslides mapping: a case study in Artvin dam area, in Turkey. Geocarto Int. 37(8):2293–2311.
- Yu Z, Huang G, Zhang C, Zhao X. 2021. SBAS-InSAR deformation reconstruction based on low-rank matrix completion in Southern Zibo, China. Arabian J Geosci. 14(4):1–9.
- Zhang L, Ding X, Lu Z. 2011. Ground settlement monitoring based on temporarily coherent points between two SAR acquisitions. ISPRS J Photogramm Remote Sens. 66(1):146–152. doi: 10.1016/j.isprsjprs.2010.10.004.
- Zhang Y, Li M, Wu H, Liu B, Kang Y, He Q. 2019. Ground subsidence monitoring over full territory of Jiangsu province with InSAR. Sci Surv Mapp. 44(6):114–120.
- Zhang Y, Liu B, Wu H, Cheng X, Kang YH. 2018. Ground subsidence in Xiong’an new area from 2012 to 2016 monitored by InSAR technique. J Earth Sci Environ. 40(5):652–662.
- Zhang Y, Wu H, Kang Y, Zhu C. 2016. Ground subsidence in the Beijing-Tianjin-Hebei region from 1992 to 2014 revealed by multiple SAR stacks. Remote Sens. 8:675.
- Zhang Y, Wu H, Li M, Kang Y, Lu Z. 2021. Investigating ground subsidence and the causes over the whole Jiangsu province, China using sentinel-1 SAR data. Remote Sens. 13(2):179.