
 ?Mathematical formulae have been encoded as MathML and are displayed in this HTML version using MathJax in order to improve their display. Uncheck the box to turn MathJax off. This feature requires Javascript. Click on a formula to zoom.
Abstract
In Jakarta, Indonesia, rapid urbanization and intensive groundwater extraction have led to significant land subsidence, posing challenges for sustainable urban management. This study utilized Interferometry Synthetic Aperture Radar (InSAR) integrated with multi-track data analysis to generate refined time-series and velocities of 2D displacement across Greater Jakarta. This study reveals notable variation in subsidence rates across different areas, with the most significant subsidence observed in Cikarang and the coastal regions of North Jakarta, which remains linear to this day. Notably, while the 2D approach improved accuracy by up to 53% at some locations, discrepancies at others indicated that simpler descending projections might sometimes yield better results. This underscores the necessity for a nuanced application of geodetic methods based on specific site conditions to effectively monitor and manage land subsidence in complex urban environments. Our findings highlight the critical importance of integrating multiple monitoring approaches to comprehensively address both vertical and horizontal displacement.
1. Introduction
Jakarta, a bustling metropolitan city situated on the north coast of Java Island, is characterized by its location above Quaternary alluvium soil (Cipta et al. Citation2018a). This geological context renders the city vulnerable to seismic amplification and rapid subsidence, exacerbated by excessive water extraction (Cipta et al. Citation2018b). Flood inundation in Jakarta and its satellite cities is progressively expanding annually, largely because of land subsidence and natural soil consolidation occurring not only along the coastal areas but also inland (Bott et al. Citation2021). The primary cause of coastal flooding in Jakarta is land subsidence, evidenced by an annual subsidence rate exceeding 10 cm per year, far surpassing the sea level rise of just a few millimeters per year (Takagi et al. Citation2016; Tay et al. Citation2022). Linear land subsidence dominates in Jakarta and Semarang, resulting in amplified consequences, particularly on infrastructure (Andreas et al. Citation2018). Urgent action to mitigate land subsidence is imperative to prevent escalating damage exposure and the need for more costly and challenging adaptation strategies in the future (Ward et al. Citation2011).
The continuous expansion of the Jakarta region, encompassing Jakarta, Bogor, Depok, Tangerang, and Bekasi Regency (Greater Jakarta), underscores the pressing necessity for comprehensive and extensive monitoring of land subsidence across broader areas. This necessity aligns with the increasing demand for groundwater among the population, coupled with changes in land cover and reports of excessive groundwater consumption in industrial regions throughout Greater Jakarta (Taftazani et al. Citation2022). Excessive groundwater withdrawal stemming from residential and industrial activities, alongside alterations in land cover, serves as the principal driver of land subsidence in this region (Chaussard et al. Citation2013; Bott et al. Citation2021).
Given the widespread impact of land subsidence on urban infrastructure and water management, robust and accurate methodologies for monitoring subsidence is paramount. Since around 1980, various geodetic measurements, each with unique strengths and limitations, have been utilized to discern land subsidence, particularly in Jakarta. These methodologies include leveling (Abidin et al. Citation2005), Global Navigation Satellite System (GNSS) (Abdullah et al. Citation2021), Light Detection and Ranging (LiDAR) (Park et al. Citation2016), microgravity (Rosid et al. Citation2021), and widespread usage of Interferometry Synthetic Aperture Radar (InSAR) (Ardha et al. Citation2021; Rafiei et al. Citation2022; Suhadha et al. Citation2023b). Although geodetic leveling boasts high accuracy in detecting subsidence, its labor-intensive and repetitive nature makes it unsuitable for ongoing, real-time monitoring of subsidence (Raspini et al. Citation2014). The contemporary necessity for subsidence observations across urban growth and metropolitan area expansion demands accuracy, precision over broad regions, and continuous observation. Over the past three decades, InSAR observations have proven their reliability in meeting the current requirements of subsidence observations (Crosetto et al. Citation2016; Pepe and Calò Citation2017; Suhadha et al. Citation2023).
The progression of InSAR capabilities is intricately linked to the development of several validated methodologies, beginning with single-pair InSAR (Hanssen Citation2001), Persistent Scatterer Interferometry (PSI) (Ferretti et al. Citation2001), and evolving to Small Baseline Subset (SBAS) (Berardino et al. Citation2002). Each approach computes Line-of-Sight (LOS) displacements by analyzing the phase change of each pixel (for SBAS) and point (for PSI) in SAR images across different observation epochs. LOS displacement quantifies elevation shifts along the satellite’s LOS, indicating that the observed displacements are projections within the satellite’s viewing geometry. Consequently, the comprehensive displacement, incorporating both vertical and horizontal movements, may not be fully captured (Ferretti Citation2014; Fuhrmann and Garthwaite Citation2019; Suhadha and Julzarika Citation2022).
Although the utilization of InSAR in Jakarta has become increasingly prevalent, the majority, if not all, of InSAR observations in the area still concentrate on LOS measurements. outlines the evolution of the InSAR technique for monitoring land subsidence in Jakarta and its environs. Primarily, InSAR monitoring in Jakarta continues to rely on data from a single orbit, with vertical displacement projected from LOS displacement. SAR satellites observe the Earth from oblique angles, capturing images from the northeast (ascending) and northwest (descending) directions. Analyzing vertical displacement in InSAR data becomes problematic when only one orbit is utilized, as it cannot discern between vertical and horizontal deformation (Ng et al. Citation2012).
Table 1. Analysis of land subsidence in Jakarta and surrounding areas categorized based on input data, employing the InSAR technique, and the resulting displacement geometry.
The fusion of data from both orbits has become imperative to attain more precise vertical and high-precision horizontal measurements, particularly in the east-west (EW) direction (Samsonov and d’Oreye Citation2012; Fuhrmann and Garthwaite Citation2019; Morishita and Kobayashi Citation2022; Suhadha et al. Citation2023). However, the limitations of InSAR in accurately measuring displacements in the north-south (NS) direction owing to the satellite’s orbital proximity to the pole must be acknowledged. Previous research has primarily focused on analyzing displacement fields caused by sudden events such as earthquakes or volcanic eruptions, or averaging 3D displacement velocities over extended periods. This approach simplifies the analysis by employing only one pair of data rather than conducting a time-series analysis.
The evolution of InSAR techniques for time-series data analysis from multi-track SAR data has witnessed significant contributions from researchers striving to enhance the precision and flexibility of deformation monitoring. Ozawa and Ueda (Citation2011) pioneered time-series data analysis by amalgamating interferograms from multiple orbit tracks, grappling with challenges associated with large datasets. Pepe et al. (Citation2016) introduced a novel approach utilizing minimum acceleration regularization to refine LOS displacement analysis, addressing the integration of datasets with varying acquisition times. Then, Wang et al. (Citation2012) applied Tikhonov regularization to integrate multi-track data for determining vertical velocity by ignoring the horizontal which can raise bias when observed at locations where horizontal displacement is dominant. Previous multi-track combinations of time-series data rely on a robust calculation that needs extensive computation whereas there is a challenge for computational resources and extensive SAR nowadays. Moreover, current open SAR data often correspond to different time acquisitions (Hu et al. Citation2014).
In this study, we integrate multi-temporal (MT)-InSAR observations from multi-track observations, using a straightforward approach, addressing the challenge of detecting vertical displacement in the extensive dataset, using a study case in Greater Jakarta. By leveraging the nearest acquisition periods of non-redundant observations, as in Wang et al. (Citation2012), we aim to overcome the hurdles of time-series data integration and the applicability of MT-InSAR techniques through this approach. Our results reveal significant subsidence rates, particularly in the Cikarang, North Jakarta, and West Jakarta-Tangerang border areas, with rates reaching up to −10.96 cm/year. The 2D displacement approach has enhanced the measurement precision, reducing standard deviation and RMSE values compared to GNSS data. Consequently, our study underscores the importance of continuous monitoring and a multidisciplinary approach to effectively manage and mitigate land subsidence in urban environments like Greater Jakarta, ensuring sustainable urban development and infrastructure resilience.
2. Regional setting
Jakarta, the capital city of Indonesia and home to nearly 10 million permanent residents has undergone dramatic growth over the past four decades, establishing itself as one of the 28 major cities. Statistics indicate that in 2022, Jakarta was inhabited by 10,679,951 individuals, resulting in a population density of 16,084 people per square kilometer, with an annual growth rate of 0.66% (BPS DKI Jakarta Citation2023). Looking ahead 30 years, Greater Jakarta will firmly be categorized as a Metacity (Younger Greater Jakarta). This trajectory will further stimulate urban development, including the conversion of land use and cover from agricultural to residential and industrial, impacting the demand for groundwater and building density.
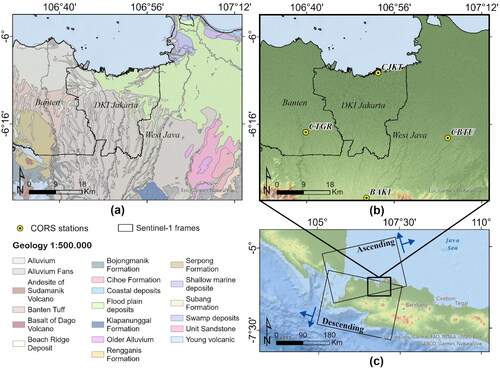
According to the Ministry of Energy and Mineral Resources, the five primary landforms dominating Greater Jakarta are alluvium, andesite, beach ridge deposit, coastal deposit, and floodplain deposits () (Gafoer and Samodra Citation1993). The formation of these landforms can be attributed to the accumulation of sedimentation from mountains located south of Jakarta. This sedimentation accumulates in the north, undergoes accretion, and forms fluviovolcanic fans at the mouths of rivers. Geologically, the north coast of Java lies on the Sunda shelf, consisting of pre-Tertiary sedimentary rocks, crystalline igneous rocks, and metamorphic rocks (Verstappen Citation2019). Another important aspect to note is that Jakarta is intersected by approximately 13 natural and artificial rivers, some of which serve as essential sources of public water supply. These geological features, coupled with the intensive extraction of groundwater, are believed to exacerbate land subsidence in Jakarta, affecting both shallow (less than 40 m) and deep (more than 40 m) areas (Abidin et al. Citation2005).
Figure 1. (a) Geological overview of Greater Jakarta. (b) Elevation profiles of each city within Greater Jakarta overlaid with available GNSS continuous operating Reference system (CORS) stations. (c) Sentinel-1 track footprint on ascending and descending orbits. (Data source: DEM – BIG; Geology – Geological Agency, Ministry of Energy and Mineral Resources, Republic of Indonesia).
Although the utilization of InSAR for monitoring land subsidence in Jakarta is well-established, its methodologies can still be improved. For instance, Hakim et al. (Citation2020) analyzed data from two distinct orbits (ascending and descending) from 2017 to 2020 without integrating them. Despite Jakarta’s relatively gentle topography, notable variations were observed in the InSAR measurements between the two Sentinel-1 orbits. Consequently, this study aims to bridge this gap by combining InSAR images from the Sentinel-1 satellite in ascending and descending orbits to derive both vertical and horizontal displacements in a 2D displacement analysis using long time-series data. As highlighted by Ng et al. (Citation2012), whereas Jakarta is primarily subjected to vertical deformation, the failure to segregate vertical and horizontal data may lead to reduced accuracy.
Therefore, this research endeavors to comprehensively map land subsidence in Jakarta, commencing with the border region encompassing Greater Jakarta, with precision for broader areas and high accuracy for each time series. This approach is anticipated to fulfill the requirement for complete land subsidence mapping, serving as a crucial input to mitigate the risk of tidal floods transitioning to river floods when land subsidence is the primary contributing factor.
3. Material and methods
Before detailing our methodology, contextualizing previous studies on land subsidence in Jakarta is necessary. Monitoring land subsidence using InSAR in Jakarta is not a new concept, as several previous studies have demonstrated its reliability through various methodologies and sensors. The literature review presented in outlines the evolution of the InSAR approach, which has been utilized to monitor land subsidence in Jakarta and its surroundings. Overall, InSAR monitoring predominantly relies on single-orbit InSAR, with vertical displacement estimated from projected LOS displacement based on incidence angle. Building upon this previous work, our study leverages Sentinel-1A (S1A) data to further investigate land subsidence patterns in Jakarta using multi-track data to decompose 2D displacement. The subsequent sections provide detailed insights into the datasets and methodologies employed.
3.1 Datasets
This study utilized two tracks of S1A to investigate land subsidence. The tracks comprise the ascending and descending flight directions of the Sentinel-1 satellite. Sentinel-1 employs a C-band with a wavelength of 5.547 cm to acquire images at an oblique angle with a right-looking configuration. Two S1A datasets from each orbit, spanning from 2017 to 2022, were utilized to observe long-term subsidence.
illustrates the time frame of each dataset, encompassing both ascending and descending datasets. Additionally, provides details on the acquisition periods, data volume, essential image specifications, and the mean standard error of decorrelation.
Figure 2. Temporal distribution of S1A data used in this study spanning from 2017 to 2022.
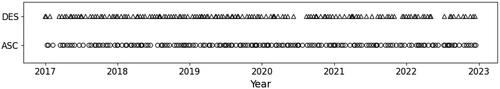
Table 2. Basic specifications of the Sentinel-1 dataset and associated uncertainties. (Data source: Sentinel-1 ascending (asc) and descending (des) data acquired from ESA; processed by the authors).
3.2 Methodology
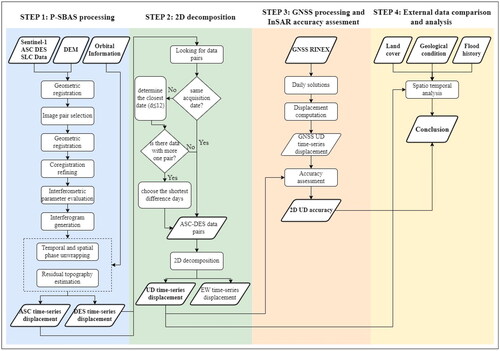
The methodology comprises four main steps to generate for generating and validating displacement from the SBAS multi-track (refer to ). First, the SAR data from both ascending and descending orbits were processed using Parallel SBAS (P-SBAS). Second, the resulting Line-of-Sight (LOS) measurements from the P-SBAS processing were decomposed into 2D displacement components. Next, statistical metrics such as standard deviation and Root Mean Square Error (RMSE) were used to evaluate the precision and reliability of the model. Finally, an extensive analysis was conducted using external data sources to contextualize the displacement measurements. This included incorporating land cover data to understand surface characteristics, satellite imagery to visualize changes over time, and historical flood data to correlate observed displacements with known flooding events.
Figure 3. Diagram outlining the four primary stages for analyzing vertical displacement using 2D decomposition in Greater Jakarta.
3.2.1. InSAR processing
InSAR technology leverages the phase differences between consecutive passes over the same location to calculate displacement. This phase difference is attributed to changes in proximity to the Earth’s surface (Hanssen Citation2001). A multi-temporal InSAR approach was adopted to address conventional D-InSAR’s limitations and acquire time-series displacement over extensive regions while mitigating decorrelation effects (Ferretti et al. Citation2001; Berardino et al. Citation2002).
The P-SBAS method, developed by the European Space Agency (ESA) and implemented within the ESA Geohazard Exploitation Platform (GEP), represents an advancement of the standard SBAS technique, specifically tailored for parallel computing environments (Casu et al. Citation2014). Despite its successful applications in many global geohazard studies, its implementation remains limited in Indonesia (Cigna and Tapete Citation2021; Suhadha and Harintaka Citation2024).
In this study, the P-SBAS processing method initiates the collection of data from Sentinel-1 SLC data in both ascending and descending directions, as well as SRTM digital elevation model (DEM) data and orbital information. Subsequently, the images undergo geometric registration, and pairs with high coherence, defined by a coherence threshold of 0.7, are selected to minimize decorrelation effects. The subsequent steps involve refining coregistration and generating interferograms through interferometric parameter evaluation, which is crucial for assessing phase differences. The method proceeds with temporal and spatial phase unwrapping to resolve phase ambiguities, followed by estimating any residual topography not captured by the DEM. To improve the accuracy of the results, a Ground Control Point from the runway of Soekarno–Hatta International Airport is integrated into the process. Finally, the method compiles the time series of displacement for both ascending and descending satellite data, providing comprehensive monitoring of surface movements over time.
The P-SBAS algorithm treats atmospheric correction as a subsequent step, distinct from the primary process of estimating displacement (Casu et al. Citation2014). Therefore, in line with the direct application of the P-SBAS algorithm, our focus was on evaluating displacement estimation within the Greater Jakarta setting.
3.2.2. 2D Displacement decomposition
In terms of procedure, InSAR observations yield displacements in a 1D geometry, specifically the LOS. The geometry is defined by the incidence angle (θ) and satellite heading (α). LOS measurements are taken in a direction orthogonal to the satellite’s heading, with most current SAR satellites utilizing the right look. The LOS displacement comprises Easting (E), Northing (N), and Upward (U) projection components (EquationEquation (1)(1)
(1) ) that can be utilized to convert it into 1D vertical, 2D (vertical UD and EW), and even complete 3D displacement (UD, EW, and NS) (Fialko et al. Citation2001):
(1)
(1)
When only one track of InSAR data is available, LOS displacement can be directly projected into a vertical direction using EquationEquation (2)(2)
(2) (Hanssen Citation2001; Fuhrmann and Garthwaite Citation2019). However, this approach may introduce bias as it neglects horizontal displacement, despite the primary displacement occurring vertically. Ng et al. (Citation2012) emphasized that although vertical subsidence predominates in Jakarta, horizontal displacement near subsidence bowl rims can distort vertical displacement projections from LOS data, with a horizontal shift of just 10 mm/year potentially causing an 8 mm/year error in vertical measurement.
Moreover, if at least two passes of SAR data are available at the observation site, most recent research suggests 2D displacement modeling (Bechor and Zebker Citation2006; Pepe and Calò Citation2017). This recommendation aligns with the significant error contribution of the NS component since the orbits of most current SAR satellites are near-polar. EquationEquation (3)(3)
(3) is employed to compute vertical and EW displacements while disregarding the NS component (Fuhrmann and Garthwaite Citation2019; Suhadha and Harintaka Citation2024). The UD and EW displacements are termed 2D displacements in the subsequent section.
(2)
(2)
(3)
(3)
where
and
represent the LOS displacement in ascending and descending orbits, respectively. The incidence angle ranges from 32.205– 43.483 and 30.751–43.082 for ascending and descending, respectively. Additionally, the heading angle has a constant value both for ascending and descending ().
EquationEquation (3)(3)
(3) is applicable for calculating 2D displacements for velocity and can be solved using least square adjustment (LSA). The vertical displacement is denoted by
whereas the EW displacement is denoted by
However, challenges arise when applying this 2D formation to time-series data because of variations in acquisition time between satellite platforms (Hu et al. Citation2014).
This study employs a 2D construction method for time-series data, utilizing the closest acquisition period. The detailed workflow is depicted in step 2 of . The process begins by searching for data pairs. If a pair with the same acquisition date is found, the time series can be decomposed based on these pairs. If not, the search continues for data with the smallest time gap between acquisitions, considering the revisit time of Sentinel-1 is 12 days. Initially, a 12-day interval was used for the first loop determination. However, other areas with different revisit times were also considered to determine the shortest difference in dates for the second loop. After identifying pairs with the same acquisition date, this condition can be expressed mathematically:
Let A = {a1, a2, … , an} be the set of acquisition dates for the ascending dataset and D = {d1, d2,…, dm} be the set for the descending dataset. We aim to find the pair (ai, dj) such that the absolute difference in days between ai and dj is minimized. We denote this minimum difference as Δdmin.
Mathematically, the condition to find the optimal pair (ai, dj) is
(4)
(4)
The constraint is that Δdmin should be as close to zero as possible, but not greater than the revisit time T of Sentinel-1 for the first loop. For the second loop, the constraint is relaxed to find the smallest Δdmin across the entire dataset without the T constraint.
The standard deviation (σ) of each dataset is calculated using the formula:
(5)
(5)
where
are the individual measurements,
is the mean of these measurements, and N is the number of measurements.
3.2.3. GNSS data processing
InSAR observations procedurally yield displacements in one-dimensional geometry (LOS), with the geometry being defined by the incidence angle (θ) and satellite heading (α). To assess the accuracy of the 2D displacement derived from P-SBAS, we compared it with external deformation data obtained from the GNSS Continuous Operating Reference System (GNSS CORS) monitoring provided by the Indonesian Geospatial Information Agency (BIG), considering velocity and time-series contexts. The GNSS CORS data were accessible for sites in Jakarta (CJKT), Cibitung (CBTU), Tangerang (CTGR), and Bogor (BAK1). However, the 2D displacement resulting from the fusion of ascending and descending data did not encompass the broader Bogor area, and the site BAK1 was excluded from the fused displacement.
Susilo et al. (Citation2023) provided processed GNSS data and time-series displacement for each station, processed using MIT/Global Kalman filtering (GAMIT/GLOBK) software. We utilized the time-series displacement data of the GNSS CORS from 2017 to 2021. The processing of GNSS data described involves two main steps using the GAMIT and GLOBK software packages. Initially, the GAMIT software employs double-differencing methods to process ionosphere-free linear combination GPS phase observations, estimating daily station positions, atmospheric parameters, satellite orbits, and Earth orientation parameters. This step entails fixing satellite orbits to International GNSS Services (IGS) final orbits, applying second-order ionospheric corrections, adjusting for various geophysical effects such as ocean and earth tides, atmospheric pressure loading, and integrating data from IGS stations to align with the International Terrestrial Reference Frame 2014 (ITRF2014) reference frame.
In the second phase, the GLOBK software integrates these daily solutions with global GPS solutions, aligning them to the ITRF2014 frame by minimizing position disparities of selected reference sites through the computation of Helmert transformation parameters. This comprehensive approach enables the precise determination of GNSS station positions and the computation of daily time-series coordinates relative to the IGb14 realization of ITRF2014, ensuring high accuracy and alignment with global positioning standards.
The accuracy of the vertical component of the 2D displacement produced by P-SBAS was then assessed using the RMSE method. presents the vertical accuracy under time-series conditions.
Table 3. Standard deviation and root mean square error (RMSE) of the P-SBAS InSAR-derived time-series vertical (UD) displacement compared to vertical measurements from GNSS CORS stations at each station from 2017–2021. (Data source: Sentinel-1 ascending and descending - ESA; GNSS CORS - BIG; processed by the authors).
4. Result
4.1. 1D And 2D displacement
The P-SBAS was utilized to calculate LOS displacement. illustrate the projected vertical displacement velocity for each orbit, ranging from −9.29 cm/year to 4 cm/year. These figures demonstrate varying vertical displacement velocities across different orbits, particularly evident around Cikarang, the coastal areas of North Jakarta, and the border region between West Jakarta and Tangerang. These observations are consistent with the findings of Hakim et al. (Citation2020), which also highlight similar differences between ascending and descending observations in the area.
Figure 4. (a–b) 1D Displacement velocities illustrating projected vertical displacement. (c) Scatter plot of 1D displacement between ascending and descending orbital acquisitions. (d) Vertical displacement and (e) EW displacement derived from 2D displacement decomposition. (Data source: ESA, processed on GEP by the authors).
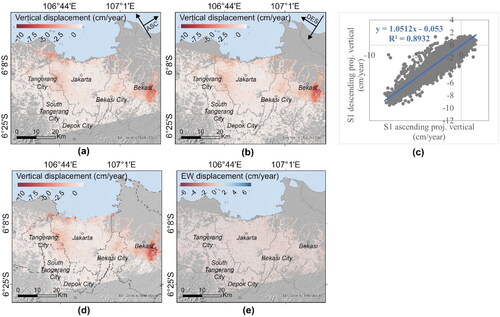
The Cikarang region exhibited the most significant subsidence rates, reaching up to −10.96 cm/year, followed by West Jakarta and North Jakarta with maximum velocities of −5.58 and −8.47 cm/year, respectively. These observations are supported by the scatterplot in . Using the LSA method, the 2D displacement revealed both UD and EW displacements. illustrate these displacements, respectively.
4.2. Main subsidence center
Jakarta’s landscape has been significantly influenced by water, with numerous areas of the city situated on floodplains vulnerable to tidal surges and river flooding. These floodplains, primarily located along the northern coast, regularly receive sediment deposits from rivers, notably originating from the Bogor area to the south of Jakarta, a phenomenon extensively documented by researchers such as Verstappen (Citation2000).
Our analysis utilizing 2D displacement derived from InSAR has identified four key regions within Greater Jakarta experiencing substantial subsidence, as delineated in :
Figure 5. (a) Primary subsidence centers in Greater Jakarta derived from 2D displacement, comprising at least four main locations, namely, (b) the border between west Jakarta and Tangerang cities, (c) the Western part of Northern Jakarta, (d) the Eastern part of Northern Jakarta bordering Bekasi, and (e) Cikarang, Bekasi, detailed with satellite imagery and their subsidence time series. (f–g) time-series pattern of each location’s vertical displacement over time. (Satellite imagery source: MAXAR imagery).
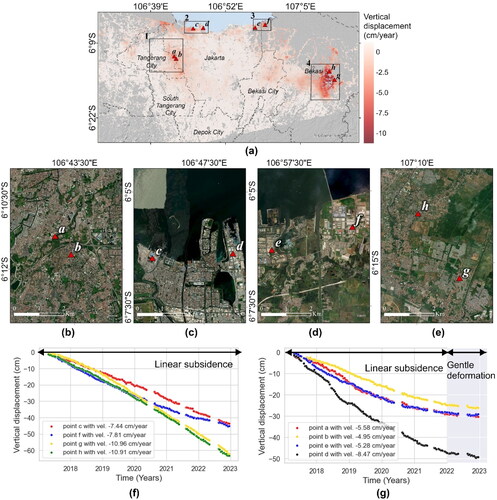
West Jakarta and Tangerang City Border: Data spanning from 2017 to 2022 depict significant subsidence in this area. illustrates the annual vertical displacement time series for sites a and b, recording subsidence velocities of −5.58 and −4.95 cm/year, respectively.
Coastal Areas of North Jakarta City: highlights sites c and d, registering displacements of −7.44 and −8.47 cm/year, respectively. A notable surge in subsidence occurred around mid-2018, followed by a deceleration by 2022, suggesting a potential stabilization in subsidence rates.
Bekasi Regency and North Jakarta Coastal Areas: Sites e and f experienced relatively consistent linear subsidence from 2017 to 2022, with velocities of −5.28 and −7.81 cm/year, respectively. The displacement patterns here remained steady, with no significant fluctuations observed over the observed period.
Cikarang, City of Bekasi: As depicted in , this locality exhibited the highest rates of subsidence within the study area. Points g and h displayed average annual displacements of −10.96 and −10.91 cm/year, respectively. The data indicates a significant increase in subsidence rates beginning around mid-2018, highlighting the vulnerability of these areas to subsidence intensification.
Additionally, we analyzed the time-series patterns of each identified significant subsidence point (a-h), categorizing them into two groups as shown in . In , critical Points (c, f, g, and h) depict a consistent and substantial linear decline in subsidence up to the present, primarily located in North Jakarta and Bekasi City. By contrast, demonstrates that although these points exhibited a high linear decrease in subsidence until the end of 2021, the rate of land subsidence steepened beginning from early 2022, characterized as ‘gentle deformation’.
4.3. Validation using GNSS measurement
To evaluate the accuracy of the 2D displacement, we compared it with data from GNSS CORS to derive a time-series displacement. All GNSS stations are situated on pixels with adequate InSAR data, as evidenced by the presence of InSAR measurements around the station, comprising at least three points within a maximum distance of 45 meters. This ensures that the distance between the InSAR observation locations and GNSS falls within the spatial coverage of the P-SBAS observations, within 90 m × 90 m.
Our focus was specifically on assessing the consistency of our vertical displacement derived from InSAR measurements by comparing them with GNSS data in terms of standard deviation and RMSE—two statistical metrics indicative of precision and accuracy. Our analysis revealed that after applying a technique known as 2D displacement decomposition to the InSAR data, the quality of the vertical displacement from InSAR significantly improved.
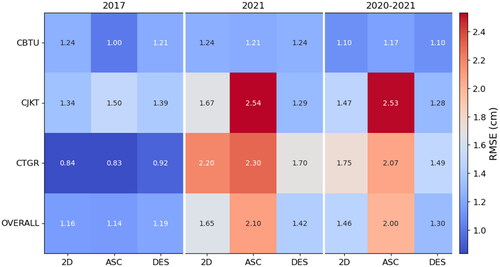
For instance, the InSAR measurements at the CJKT station exhibited a larger discrepancy from the GNSS data compared with other locations. provides a detailed breakdown of the RMSE values for InSAR-derived vertical displacement compared with GNSS measurements from 2020 to 2022. The results demonstrate that our refined InSAR measurements (following the application of the 2D technique) witnessed a decrease in standard deviation of 41.3% over the original ascending measurements and a 51.9% decrease over the descending ones. However, it is noteworthy that the GNSS data displayed a higher standard deviation than all InSAR measurements, suggesting that although GNSS generally offers accuracy, it can sometimes exhibit greater variability.
Regarding RMSE, which offers insights into the accuracy of our approach, the InSAR data closely aligned with the GNSS measurements, particularly at the CBTU station, where the vertical accuracy from 2D improved by approximately 43% and 52% compared to ascending and descending observations, respectively. Nonetheless, inconsistencies were observed in other stations as well as in the overall calculation.
illustrates a comparison of displacement observed through GNSS CORS with time-series SAR acquisitions. The UD displacement derived from the 2D decomposition fitter falls between the ascending and descending observations, with CTGR demonstrating a more consistent measurement. A significant disparity between the ascending and descending observations suggests the presence of EW displacement, consistently observed across all analyzed locations. However, in 2020, the gap between the ascending and descending observations widened to approximately −1 cm/year, accompanied by an EW displacement of around −1 cm/year. This trend persisted with a nearly −2 cm/year displacement in 2022, coupled with a continued increase in EW displacement. Furthermore, the trend lines of vertical displacement derived from GNSS have generally exhibited good agreement with the InSAR observations, with an overall RMSE of approximately 1.398 cm.
Figure 6. Comparison of displacement derived from InSAR over time with GNSS CORS stations at (a) CJKT, (b) CBTU, and (c) CTGR stations. (Data source: BIG, processed by the authors).
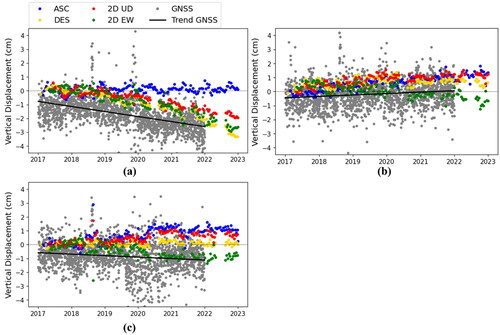
Our analysis shows that while the 2D decomposition method generally reduces the RMSE and standard deviation, this is not uniformly true across all stations. In particular, stations such as CJKT exhibited larger discrepancies in 2D velocities compared to direct descending projections. This variability can be attributed to local obstructions, atmospheric conditions, and the inherent limitations of the 2D decomposition method.
5. Discussion
The observed displacement patterns offer a comprehensive perspective on the complexities of land subsidence in Greater Jakarta. The implementation of a 2D displacement analysis has unveiled both vertical and lateral ground movements, providing a detailed understanding of the city’s intricate deformation patterns over time. Subsequently, several implications of the results are discussed below.
5.1. Reliability of time-series 2D approach to estimate subsidence
The ability of InSAR to observe from both ascending and descending orbits confers an advantage in capturing displacement dynamics. As demonstrated in this study, the fusion of multi-track InSAR observations addresses the challenge of discerning vertical displacement in Greater Jakarta by isolating both vertical and horizontal movements. One of the subtleties of this research lies in the pairing strategy of the ascending and descending time-series measurements.
By aligning data based on the smallest time gap, the measurements are treated as if they were acquired almost simultaneously. This approach aims to minimize temporal discrepancies and leverage the strengths of both orbital perspectives. However, pairing data with minor time gaps can introduce variability because of differences in data availability and atmospheric conditions between the two observations. For example, Sentinel-1 did not acquire images during the June period of 2020 while the ascending observation was conducted.
The validation of the 2D displacement decomposition method against GNSS CORS data has underscored the accuracy and reliability of the InSAR measurements. A notable finding from this validation, as evidenced by the data presented in , is the enhancement in measurement quality of the 2D time-series decomposition. This improvement was particularly evident in the enhanced standard deviation figures, which, in some cases, exhibited greater performance compared with the GNSS measurements.
The reduction in standard deviation for the vertical displacement of 2D compared to individual LOS measurements is due to the fusion of two independent measurements from different perspectives, which only cover pixels observed in both directions. This condition eliminates pixels with high uncertainty; for instance, pixels obstructed by high buildings in one SAR image direction will not be processed in the 2D decomposition. This data fusion inherently reduces the overall uncertainty, leading to a lower variety of vertical displacement deviations. This principle is well-supported in the literature, emphasizing the benefits of multi-track InSAR data fusion (Bechor and Zebker Citation2006; Pepe and Calò Citation2017).
For accuracy assessment, 2D InSAR measurements at the CBTU station demonstrated notable accuracy, as evidenced by lower RMSE values compared with both ascending and descending tracks. However, it is important to note that this accuracy improvement, as well as the standard deviation, was not consistent across all stations. Although CBTU, CTGR, and OVERALL showed enhanced accuracy with the 2D method, CJKT exhibited mixed results, with 2D RMSE improving over the ascending track but not the descending track. This variability can be attributed to several factors, including:
Obstructions at specific sites: Locations like CJKT, which had the highest standard deviation among the three stations, likely face obstructions that affect measurement reliability.
Atmospheric conditions: Ascending tracks are particularly susceptible to atmospheric delays that can distort measurements. This aligns with recent findings by Hakim et al., (Citation2020).
The discrepancy between ASC-DES pairs: Significant differences in measurements obtained from ascending and descending passes indicate that each pass captures different aspects of ground deformation. In such cases, the 2D method offers a more balanced representation by integrating the directional biases inherent in each track.
Our findings indicate that the 2D decomposition method enhances accuracy in certain contexts, particularly in areas with significant horizontal displacement components. However, in some cases, such as in heterogeneous building locations or obstructed sites, a simple projection of ascending and descending data may provide more reliable results. This is evidenced by larger discrepancies observed at obstructed stations such as CJKT. This suggests a hybrid approach, where the choice of method is tailored to the specific conditions of each site, may be most effective.
For consistency measurements, we analyzed the temporal evolution of measurement accuracy by assessing RMSE over different periods, as depicted in . The 2D method achieved the lowest RMSE in the overall category for 2017. However, as the temporal extent of the data increases, as observed in the periods for 2021 and the comprehensive span of 2020–2021, a rise in RMSE is evident. This increase indicates error propagation inherent in longer time-series analyses from the input dataset (single measurement). Additionally, the accuracy improvement and variation mentioned in the previous paragraph remain consistent across different observation periods, as illustrated in .
Figure 7. Extension of covering 2 years and a sample for a single year.
5.2. Reliability of GNSS measurements
Although GNSS measurements are typically considered the gold standard for ground positioning, acknowledging their limitations is important. Multipath errors, occurring when GNSS signals bounce off nearby structures before reaching the receiver, can distort readings (Iliev et al. Citation2020). Atmospheric conditions can also affect the signal’s path, potentially introducing inaccuracies (Yang et al. Citation2011).
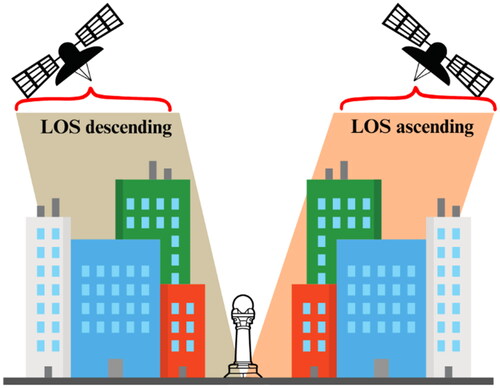
GNSS data exhibits a higher standard deviation than all InSAR measurements. This condition arises because GNSS processing is limited to 30-s intervals. Moreover, the area around the GNSS pillar in Greater Jakarta is surrounded by many buildings, causing obstruction and signal multipath. For instance, the CJKT pillar contains numerous buildings inducing obstruction and signal multipath, resulting in the highest standard deviation and RMSE of InSAR, indicating less consistency of data compared to GNSS measurements. Similar to the multipath effect in GNSS measurements, InSAR observations in this location are influenced by geometrical factors, leading to a complex mix of direct reflections from the detected source ().
Figure 8. SAR signal reflection scheme to the obstructed GNSS pillar.
Our analysis, as reflected in , underscores GNSS’s reliability in our study’s context. Despite a slightly higher standard deviation of 1.765 cm compared with InSAR measurements, the overall RMSE of GNSS data closely aligns with InSAR data trends. This highlights the general reliability of GNSS as a method for validating subsidence patterns detected by InSAR. However, this comparison also emphasizes the variability within GNSS measurements, underscoring the importance of using accurate methods to understand and interpret subsidence accurately.
5.3. Factor contributing to subsidence
The subsidence patterns in Greater Jakarta, illustrated in , reveal a complex interplay of factors. Analyzing each sample point considering its geological condition, land use, and proximity to recent flooding events uncovers several interconnected factors influencing land subsidence.
At Point ‘a’, situated atop the volcanic Banten Tuff formation, urban sprawl exacerbates subsidence. Building pressure on this young geological feature contributes to sinking ground, whereas poroelastic behavior, influenced by groundwater extraction, plays a crucial role (Maryadi et al. Citation2021). Points ‘b’ and ‘c’, located on alluvial fans and based on alluvial deposits, experience subsidence because of sediment composition. Alluvial sediments, comprising sand, silt, and clay, vary in incompressibility. Fine-grained materials, like clay, compact significantly under urban development and groundwater extraction pressures. This compaction involves effective stress and soil consolidation, where reduced pore water pressure increases stress on soil grains, resulting in subsidence (Harvey et al. Citation2005).
The floodplain deposits at Points ‘d’, ‘f’, ‘g’ and ‘h’ are prone to subsidence because of their fine-grained composition. These sediments compact significantly when water is extracted. Terzaghi’s consolidation theory explains how sediment layers compress over time under load, a process accelerated by groundwater removal that typically supports the sediment structure (Zoysa et al. Citation2021).
Point ‘e’ is situated on beach ridge deposits with sandy, permeable layers, faces unique challenges. The coarser sand structure allows for rapid particle rearrangement and densification, leading to subsidence. Granular flow principles and packing efficiency help elucidate this process (Otvos, Citation2005).
Substantial groundwater withdrawal from detrital aquifers exacerbates subsidence across various sediment types. Reduced pore water pressure increases effective stress on sediment particles, promoting compaction. Notable studies by Galloway et al. (Citation1999) analyze groundwater-induced subsidence in different geological contexts.
Besides geological factors, anthropogenic activities significantly contribute. Urban development dominates all points, implying intense human activity, infrastructure development, and potential groundwater extraction, evident from the predominantly urban land cover, reflecting its classification as a Metacity (). The concentration of structures and groundwater extraction in urban settings imposes immense stress on underlying soils, especially those of alluvium and floodplains, often leading to soil compaction and subsequent land subsidence. The demand for groundwater for industrial processes is notable in industrial areas, including Points ‘c’, ‘d’ and ‘e’, leading to accelerated groundwater drawdown and land sinking.
Figure 9. (a) Land cover (LC) in 2021 derived from random Forest-supervised classification and significant subsidence locations analyzed in the subsequent chapter, (b) flood occurrences in 2021 obtained from quantitative surveys and photo documentation of remaining flood inundation at significant locations. (LC data source: Planetscope imagery; photo source: field observation by the authors, taken on July 29, 2022).
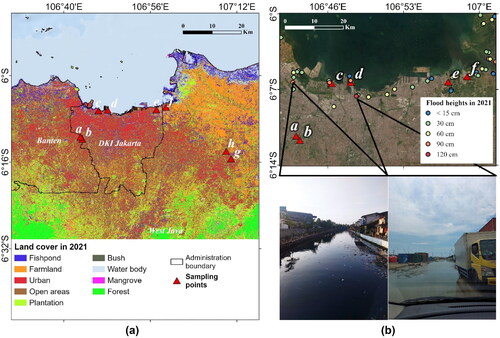
Environmental determinants, notably flooding, are also crucial (). The significant flooding event in 2021, impacting areas close to Points ‘b’, ‘d’ and others, vividly demonstrates this impact. Floodwaters add weight to the soil, causing compaction, especially during a rapid recession, potentially exacerbating ground settling and sinking.
5.4. Remedial measures and recommendations
Consistently employing the 2D displacement approach in urbanized regions like Greater Jakarta is crucial because of its capability to fully capture both vertical and horizontal displacements. However, a single InSAR measurement could be used when the potential obstruction is high. Regular monitoring utilizing InSAR and GNSS techniques should be integrated with data on groundwater levels, land cover changes, flood occurrences, and other geophysical and geodetic measurements, ensuring a comprehensive assessment of subsidence trends.
The significant subsidence in Jakarta is notably driven by groundwater extraction, particularly from the upper confined aquifer system. Urgent measures are needed to regulate extraction rates and establish sustainable limits. Additionally, urban planning requires reevaluation, particularly in high-subsidence areas. Construction regulations should restrict the height and weight of new buildings to alleviate further land pressure, whereas foundation designs should be adjusted to minimize their impact on subsidence.
Community Focus and Flood Management: Recognizing the strong correlation between subsidence and flooding, enhancing flood defenses, such as constructing large-scale embankments in vulnerable areas, is imperative. Community relocation should be considered for the most vulnerable regions. Flood preparedness education and the establishment of early warning systems are vital for residents who remain. Public awareness campaigns and collaborations among stakeholders can foster a unified approach to subsidence management.
6. Conclusions
In summary, our study demonstrates the value of integrating multi-track InSAR data to derive 2D displacement measurements in Greater Jakarta. While the 2D approach generally enhances measurement precision, the variability observed at certain stations indicates that a simple projection may sometimes yield more accurate results. This highlights the need for a nuanced application of different methodologies based on specific conditions to effectively monitor and manage land subsidence. However, if the monitoring considers not only the vertical displacement but also the horizontal displacement, this approach is advised.
Our analysis highlights the highest subsidence rates in Cikarang, Bekasi, reaching up to −10.96 cm/year, with substantial displacement also observed in North Jakarta and the West Jakarta-Tangerang border areas. By employing a 2D displacement approach, we achieved enhanced measurement precision, significantly reducing standard deviation and RMSE values compared to GNSS data, particularly evident at the CBTU station. This method effectively isolates both vertical and horizontal movements, providing a comprehensive understanding of ground deformation dynamics.
Despite the overall improvement, certain locations, such as the CJKT station, exhibited variability due to factors like obstructions and atmospheric conditions, underscoring the need for further refinement and application to other conditions, like semi-urban or rural areas. The validation of our approach against GNSS measurements has demonstrated the reliability of the InSAR-derived vertical displacement. This comparative analysis underscores the importance of integrating multiple measurement methods to accurately assess subsidence.
Our findings attribute the subsidence in Jakarta to a complex interplay of geological conditions and anthropogenic activities, notably groundwater extraction and urban development. The compressibility of alluvial sediments and the impact of flooding events further exacerbate the issue, highlighting the need for comprehensive mitigation strategies.
To address these challenges, we recommend regulating groundwater extraction, reevaluating urban planning to restrict building specifications in high-subsidence areas, and enhancing flood defenses. Integrating continuous InSAR and GNSS monitoring with additional geophysical and geodetic measurements will provide a robust framework for managing subsidence trends. Our study underscores the critical importance of a multidisciplinary approach and continuous monitoring to effectively manage and mitigate land subsidence in urban environments like Greater Jakarta, ensuring sustainable urban development and infrastructure resilience.
Author contributions
Harintaka contributed to manuscript writing, review, and editing, as well as supervising the work. Argo Galih Suhadha played a pivotal role in conceptualization, data curation, methodology, validation, visualization, and original manuscript writing, review, and editing. Agung Syetiawan participated in field data investigation, formal analysis, project administration, and original draft writing. Mohammad Ardha contributed to field data investigation, data curation, and original draft writing. Anisa Rarasati contributed to data curation, formal analysis, and manuscript review and editing. All authors have reviewed and approved the final manuscript.
Acknowledgements
The authors gratefully acknowledge the European Space Agency (ESA) for providing Sentinel-1 data. Additionally, ESA and Terradue are acknowledged for their provision of P-SBAS processing on the Geohazard Exploitation Platform (GEP) under a cooperative research agreement involving Kemen-PUPR, the Asian Institute of Technology (AIT), the National Research and Innovation Agency (BRIN), and funding support from the Asian Development Bank (ADB). We also thank the Indonesian Geospatial Agency (BIG) for providing GNSS and DEMNAS data.
Disclosure statement
No potential conflict of interest was reported by the authors.
Data availability statement
Sentinel-1 imageries obtained from ESA, can be accessed via https://scihub.copernicus.eu. GNSS CORS can be accessed via http://srgi.big.go.id/. Processed data will be made available upon request.
Additional information
Funding
References
- Abdullah FM, Andriyanto H, Nababan JR, Abdillah F, Sulistyawan RIH. 2021. Results of land subsidence measurement using GPS method in the Jakarta groundwater basin in 2015–2019. IOP Conf Ser Earth Environ Sci. 873(1):012034. doi: 10.1088/1755-1315/873/1/012034.
- Abidin HZ, Andreas H, Gamal M, Djaja R, Subarya C, Hirose K, Maruyama Y, Murdohardono D, Rajiyowiryono H. 2005. Monitoring land subsidence of Jakarta (Indonesia) using leveling, GPS survey and InSAR techniques. Int Assoc Geodesy Symposia. 128:561–566. doi: 10.1007/3-540-27432-4_95/COVER.
- Andreas H, Zainal Abidin H, Pradipta D, Anggreni Sarsito Di, Gumilar I. 2018. Insight look the subsidence impact to infrastructures in Jakarta and Semarang area; Key for adaptation and mitigation. MATEC Web of Conferences. 147. doi: 10.1051/matecconf/201814708001.
- Ardha M, Suhadha AG, Julzarika A, Yulianto F, Yudhatama D, Darwista RZ. 2021. Utilization of Sentinel-1 satellite imagery data to support land subsidence analysis in DKI Jakarta. Indonesia J Degrade Mining Land Manag. 8:2585–2591. doi: 10.15243/jdmlm.2021.082.2585.
- Bechor NBD, Zebker HA. 2006. Measuring two-dimensional movements using a single InSAR pair. Geophys Res Lett. 33(16):1–5. doi: 10.1029/2006GL026883.
- Berardino P, Fornaro G, Lanari R, Sansosti E. 2002. A new algorithm for surface deformation monitoring based on small baseline differential SAR interferograms. IEEE Trans Geosci Remote Sensing. 40(11):2375–2383. doi: 10.1109/TGRS.2002.803792.
- Bott LM, Schöne T, Illigner J, Haghshenas Haghighi M, Gisevius K, Braun B. 2021. Land subsidence in Jakarta and Semarang Bay – the relationship between physical processes, risk perception, and household adaptation. Ocean Coast Manag. 211:105775. doi: 10.1016/j.ocecoaman.2021.105775.
- BPS DKI Jakarta. 2023. Provinsi DKI Jakarta dalam angka 2023: DKI Jakarta Province in Figures. BPS-Statistics of DKI Jakarta Province, Jakarta.
- Casu F, Elefante S, Imperatore P, Zinno I, Manunta M, De Luca C, Lanari R. 2014. SBAS-DInSAR parallel processing for deformation time-series computation. IEEE J Sel Top Appl Earth Observ Remote Sens. 7(8):3285–3296. doi: 10.1109/JSTARS.2014.2322671.
- Chaussard E, Amelung F, Abidin H, Hong SH. 2013. Sinking cities in Indonesia: ALOS PALSAR detects rapid subsidence due to groundwater and gas extraction. Remote Sens Environ. 128:150–161. doi: 10.1016/j.rse.2012.10.015.
- Cigna F, Tapete D. 2021. Sentinel-1 big data processing with P-SBAS InSAR in the geohazards exploitation platform: an experiment on coastal land subsidence and landslides in Italy. Remote Sens (Basel). 13(5):885. doi: 10.3390/rs13050885.
- Cipta A, Cummins P, Dettmer J, Saygin E, Irsyam M, Rudyanto A, Murjaya J. 2018a. Seismic velocity structure of the Jakarta Basin, Indonesia, using trans-dimensional Bayesian inversion of horizontal-to-vertical spectral ratios. Geophys J Int. 215(1):431–449. doi: 10.1093/gji/ggy289.
- Cipta A, Cummins P, Irsyam M, Hidayati S. 2018b. Basin resonance and seismic hazard in Jakarta, Indonesia. Geosciences (Basel). 8(4):128. doi: 10.3390/geosciences8040128.
- Crosetto M, Monserrat O, Cuevas-González M, Devanthéry N, Crippa B. 2016. Persistent scatterer interferometry: a review. ISPRS J Photogramm Remote Sens. 115:78–89. doi: 10.1016/j.isprsjprs.2015.10.011.
- Cyntia C, Pudja IP. 2018. Subsidence analysis in DKI Jakarta using Differential Interferometry Synthetic Aperture Radar (DInSAR) Method. SJES. 2(3):118–127. doi: 10.22515/sustinere.jes.v2i3.48.
- Ferretti A. 2014. Satellite InSAR Data: Reservoir Monitoring from Space. Houten, The Netherlands: EAGE Publications. doi: 10.3997/9789073834712
- Ferretti A, Prati C, Rocca F. 2001. Permanent scatterers in SAR interferometry. IEEE Trans Geosci Remote Sens. 39(1):8–20. doi: 10.1109/36.898661.
- Fialko Y, Simons M, Agnew D. 2001. The complete (3-D) surface displacement field in the epicentral area of the 1999 MW7.1 Hector Mine Earthquake, California, from space geodetic observations. Geophys Res Lett. 28(16):3063–3066. doi: 10.1029/2001GL013174.
- Fuhrmann T, Garthwaite MC. 2019. Resolving three-dimensional surface motion with InSAR: constraints from multi-geometry data fusion. Remote Sens (Basel). 11(3):241. doi: 10.3390/rs11030241.
- Gafoer S, Samodra H. 1993. Peta Geologi Indonesia, Lembar Jakarta. Puslitbang Geologi, Bandung.
- Galloway DL, Jones DR, Ingebritsen SE. 1999. Land Subsidence in the United States. U.S. Geological Survey, United States. doi: 10.3133/CIR1182.
- Hakim WL, Achmad AR, Eom J, Lee CW. 2020. Land subsidence measurement of Jakarta coastal area using time series interferometry with Sentinel-1 SAR data. J Coast Res. 102(sp1):75–81. doi: 10.2112/SI102-010.1.
- Hanssen RF. 2001. Radar Interferometry: Data Interpretation and Error Analysis, 1st ed, Remote Sensing and Digital Image Processing. Berlin: Springer Dordrecht. doi: 10.1007/0-306-47633-9.
- Harvey AM, Mather AE, Stokes M. 2005. Alluvial fans: geomorphology, sedimentology, dynamics. In Geological Society. London: Special Publications; p. 251. doi: 10.1144/GSL.SP.2005.251.
- Hu J, Li ZW, Ding XL, Zhu JJ, Zhang L, Sun Q. 2014. Resolving three-dimensional surface displacements from InSAR measurements: a review. Earth Sci Rev. 133:1–17. doi: 10.1016/j.earscirev.2014.02.005.
- Iliev TB, Stoyanov IS, Sokolov SA, Beloev IH. 2020. The influence of multipath propagation of the signal on the accuracy of the GNSS receiver. 2020 43rd International Convention on Information, Communication and Electronic Technology, MIPRO 2020 – Proceedings 508–511. doi: 10.23919/MIPRO48935.2020.9245409.
- Koudogbo FN, Duro J, Arnaud A, Bally P, Abidin HZ, Andreas H. 2012. Combined X- and L-band PSI analyses for assessment of land subsidence in Jakarta. Remote Sens Agri Ecosyst Hydrol. XIV 8531, 853107. doi: 10.1117/12.974821.
- Maryadi M, Sausan Champai FM, Nyoman Triananda I, Darmawan A, Jabbar GA. 2021. Investigation of Rawa Dano volcanic deposits and its paleotopography using ground-penetrating radar. IOP Conf Ser Earth Environ Sci. 873(1):012069. doi: 10.1088/1755-1315/873/1/012069.
- Morishita Y, Kobayashi T. 2022. Three-dimensional deformation and its uncertainty derived by integrating multiple SAR data analysis methods. Earth Planets Space. 74(1):16. doi: 10.1186/s40623-022-01571-z.
- Ng AH, M, Ge L, Li X, Abidin HZ, Andreas H, Zhang K. 2012. Mapping land subsidence in Jakarta, Indonesia using persistent scatterer interferometry (PSI) technique with ALOS PALSAR. Int J Appl Earth Obs Geoinf. 18:232–242. doi: 10.1016/j.jag.2012.01.018.
- Otvos, EG, Encyclopedia of Coastal Science, Beach Ridges, Schwartz, Maurice L., Springer, Dordrecht, 2005
- Ozawa T, Ueda H. 2011. Advanced interferometric synthetic aperture radar (InSAR) time series analysis using interferograms of multiple-orbit tracks: a case study on Miyake-jima. J Geophys Res. 116:B12407. doi: 10.1029/2011JB008489.
- Park H, Kwon SJ, Hadi S. 2016. Land subsidence survey and policy development in Pantai Mutiara, Jakarta Bay, Indonesia. J Coast Res. 75(sp1):1447–1451. doi: 10.2112/SI75-300.1.
- Pepe A, Calò F. 2017. A review of interferometric synthetic aperture RADAR (InSAR) multi-track approaches for the retrieval of earth’s surface displacements. Appl Sci. 7(12):1264. doi: 10.3390/app7121264.
- Pepe A, Solaro G, Calo F, Dema C. 2016. A minimum acceleration approach for the retrieval of multiplatform InSAR deformation time series. IEEE J Sel Top Appl Earth Observ Remote Sens. 9(8):3883–3898. doi: 10.1109/JSTARS.2016.2577878.
- Rafiei F, Gharechelou S, Golian S, Johnson BA. 2022. Aquifer and land subsidence interaction assessment using sentinel-1 data and DInSAR technique. IJGI. 11(9)202211. doi: 10.3390/ijgi11090495.
- Raspini F, Loupasakis C, Rozos D, Adam N, Moretti S. 2014. Ground subsidence phenomena in the Delta municipality region (Northern Greece): Geotechnical modeling and validation with Persistent Scatterer Interferometry. Int J Appl Earth Obs Geoinf. 28:78–89. doi: 10.1016/j.jag.2013.11.010.
- Rosid MS, Prastama RA, Yusuf M, Daud Y, Riyanto A. 2021. Monitoring of Jakarta subsidence applying 4D microgravity survey between 2014 and 2018. GEOMATE. 20(79):132–138. doi: 10.21660/2021.79.j2031.
- Samsonov S, d’Oreye N. 2012. Multidimensional time-series analysis of ground deformation from multiple InSAR data sets applied to Virunga Volcanic Province. Geophys J Int. 191:1095–1108. doi: 10.1111/j.1365-246X.2012.05669.x.
- Suhadha AG, Harintaka H. 2024. Multidimensional displacement analysis of Semeru Volcano, Indonesia following December 2021 eruption from multitrack InSAR observation. Earth Sci Inform. 17(2):1539–1552. doi: 10.1007/s12145-024-01248-z.
- Suhadha AG, Julzarika A. 2022. Dynamic displacement using DInSAR of Sentinel-1 in Sunda Strait. Trends Sci. 19(13):4623. doi: 10.48048/tis.2022.4623.
- Suhadha AG, Prayoga, O, Harintaka. 2023b. Precise coseismic displacement related to the 2022 Pasaman earthquake using multi-geometry of Sentinel-1 InSAR. Jakarta, Indonesia, p. 030008. doi: 10.1063/5.0181385.
- Suhadha AG, Julzarika A, Susilo S, Meilano I, Syetiawan A, Ramdani D. 2023a. Identification of tectonic activity of the Baribis fault revealed by present Sentinel-1 InSAR observation. Jakarta, Indonesia. p. 030010. doi: 10.1063/5.0181387.
- Susilo S, Salman R, Hermawan W, Widyaningrum R, Wibowo ST, Lumban-Gaol YA, Meilano I, Yun S-H. 2023. GNSS land subsidence observations along the northern coastline of Java, Indonesia. Sci Data. 10(1):421. doi: 10.1038/s41597-023-02274-0.
- Taftazani R, Kazama S, Takizawa S. 2022. Spatial analysis of groundwater abstraction and land subsidence for planning the piped water supply in Jakarta, Indonesia. Water (Basel). 14(20):3197. doi: 10.3390/w14203197.
- Takagi H, Esteban M, Mikami T, Fujii D. 2016. Projection of coastal floods in 2050 Jakarta. Urban Clim. 17:135–145. doi: 10.1016/j.uclim.2016.05.003.
- Tay C, Lindsey EO, Chin ST, McCaughey JW, Bekaert D, Nguyen M, Hua H, Manipon G, Karim M, Horton BP, et al. 2022. Sea-level rise from land subsidence in major coastal cities. Nat Sustain. 5(12):1049–1057. doi: 10.1038/s41893-022-00947-z.
- Verstappen HT. 2000. Outline of the Geomorphology of Indonesia: A Case Study on Tropical Geomorphology of a Tectogene Region. International Institute for Aerospace Survey and Earth Sciences.
- Verstappen HT. 2019. Garis Besar Geomorfologi Indonesia (3rd ed.). Sleman: Gadjah Mada University Press, Yogyakarta.
- Wang H, Wright TJ, Yu Y, Lin H, Jiang L, Li C, Qiu G. 2012. InSAR reveals coastal subsidence in the Pearl River Delta, China. Geophys J Int. 191(3):1119–1128. doi: 10.1111/j.1365-246X.2012.05687.x.
- Ward PJ, Marfai MA, Yulianto F, Hizbaron DR, Aerts, JC, JH. 2011. Coastal inundation and damage exposure estimation: a case study for Jakarta. Nat Hazards. 56(3):899–916. doi: 10.1007/s11069-010-9599-1.
- Widodo, Joko, Herlambang, Arie, Sulaiman, Albertus, Razi, Pakhrur, Perissin, Daniele, Kuze, Hiroaki, Sri Sumantyo, Josaphat Tetuko, Yohandri, 2019. Land subsidence rate analysis of Jakarta Metropolitan Region based on D-InSAR processing of Sentinel data C-Band frequency. J Phys Conf Ser. 1185: 012004. doi: 10.1088/1742-6596/1185/1/012004.
- Yang L, Elmas Z, Hill C, Aquino M, Moore T. 2011. An innovative approach for atmospheric error mitigation using new GNSS signals. J Navigation. 64(S1):S211–S232. doi: 10.1017/S0373463311000373.
- Zoysa RS, De Schöne T, Herbeck J, Illigner J, Haghighi M, Simarmata H, Porio E, Rovere A, Hornidge AK. 2021. The ‘wickedness’ of governing land subsidence: policy perspectives from urban Southeast Asia. PLoS One. 16(6):e0250208. doi: 10.1371/JOURNAL.PONE.0250208.