
Abstract
In the face of rapid urbanization in Saudi Arabia, understanding the impact of landscape changes on land surface temperature (LST) is crucial for sustainable urban planning. This study assesses the influence of landscape morphology on LST and predicts future LST changes. A multi-temporal land use and land cover (LULC) analysis using random forest (RF) quantified urban expansion and its ecological impacts. Accuracy assessment using the kappa coefficient illustrated the precision of the classification techniques. Morphological Spatial Pattern Analysis (MSPA), developed in Python, analyzed the structural evolution of urban areas, vegetation and exposed rocks. Polynomial regression models established the relationship between landscape morphology and LST and predicted future temperature trends. Results for Asir show a significant improvement in accuracy of the LULC models over three decades, with overall accuracy increasing from 89.99% in 1990 to 91.72% in 2020. The bootstrapping trend analysis showed an urban expansion with a positive slope of 9.27 and a decline in water bodies with a negative slope of −0.03. The MSPA analysis reflected a significant urban expansion, with the core area growing from 45.19 km2 in 2001 to 230.33 km2 in 2021. The vegetated areas showed resilience and dynamic connectivity despite slight reduction and fragmentation. The polynomial regression predicted an increase in future average LST by 2030, with urban core areas reaching 58.47 °C, vegetated cores 42.19 °C and exposed rock cores 55.79 °C. These results highlight the link between urban expansion and LST rise and make the case for integrating green infrastructure and cooling strategies into urban development.
1. Introduction
The phenomenon of rapid urbanization has been particularly pronounced in the twenty first century and has profoundly changed the global demographic landscape (Cohen Citation2004; Scott Citation2012; Hussain et al. Citation2024). At the beginning of this century, over 50% of the world’s population lived in urban areas, up from 30% in 1950 (Randers Citation2012). By 2023, this percentage will rise to around 56%, which corresponds to around 4.4 billion urban dwellers (World Bank Citation2023). This trend is expected to continue, with the urban population more than doubling by 2050, reaching almost 70% or around 6.7 billion people (UN Citation2023; World Bank Citation2023). The strongest growth is expected in the developing regions of Africa and Asia, where urbanization rates are likely to exceed those of the more developed regions (Zhao et al. Citation2017; Sakketa Citation2023). In Saudi Arabia, cities such as Abha, Khamis Mushayet, Alwadean and Ahad Rufaida illustrate this global trend. Abha, the capital of Asir province, has experienced significant urban expansion, reflecting the overall trends of rapid development and population growth in the region (Saleh Citation2002; AlQadhi et al. Citation2021; Bindajam et al. Citation2021). This urban growth is driven by various factors, including economic development, infrastructure improvements and policy initiatives aimed at diversifying the economy away from oil dependence. The consequences of this rapid urbanization include increased demand for housing, transportation and services, as well as significant ecological and environmental challenges such as the urban heat island (UHI) effect and changes in land surface temperature (LST) (Hassan and Lee Citation2015; Sarkodie et al. Citation2020; Goel and Vishnoi Citation2022).
While urbanization drives socio-economic progress, it also brings with it various ecological and environmental challenges (Hassan and Lee Citation2015; Sarkodie et al. Citation2020; Goel and Vishnoi Citation2022). These challenges are acute in rapidly urbanizing cities such as Abha, Khamis Mushayet, Alwadean and Ahad Rufaida (AlQadhi et al. Citation2021; Bindajam et al. Citation2021). The conversion of natural or rural landscapes into urban environments leads to deforestation, increased pollution and the Urban Heat Island (UHI) effect (Atasoy Citation2020; Halder et al. Citation2022; Wu et al. Citation2022; Kumar et al. Citation2023). The UHI effect leads to higher temperatures in cities compared to the surrounding rural areas (Heisler and Brazel Citation2010; Ojeh et al. Citation2016), which is due to changing surface properties, more impermeable surfaces and less vegetation cover (Vujovic et al. Citation2021). These changes affect the radiation balance, thermal properties and moisture regime of urban areas (Shahmohamadi et al. Citation2010; Garuma et al. Citation2018) and lead to ecological disturbances (Bradshaw et al. Citation2009; Myers et al. Citation2013).
Land surface temperature (LST) is an important metric for understanding the UHI effect, as it serves as a direct indicator of the thermal energy radiated from the Earth’s surface (Almeida et al. Citation2021). LST variations are closely related to land use and land cover changes (LULC) caused by urbanization, such as the replacement of vegetated areas by buildings and roads (Zhou et al. Citation2022). These changes influence the local climate and contribute to the UHI phenomenon (Kim and Brown Citation2021; Ghanbari et al. Citation2023; Badugu et al. Citation2024). The relationship between landscape morphology and LST is complex and non-linear (Liang et al. Citation2020; Zhou et al. Citation2022; Han Citation2023). Urban morphology, including the spatial configuration and composition of built-up areas and green spaces, significantly shapes the urban thermal environment (Terfa et al. Citation2020; Yang et al. Citation2021; Cilek and Uslu Citation2022). Larger, well-connected green spaces can mitigate UHI effects by facilitating air movement and improving evapotranspiration, thereby lowering ambient temperatures (Khan et al. Citation2022; Qian and Li Citation2023). However, conventional landscape metrics such as patch size, edge length and connectivity often fail to represent the ecological value of certain landscape features, such as ecological corridors (Keeley et al. Citation2021; Petsas et al. Citation2021; Tiang et al. Citation2021).
Morphological Spatial Pattern Analysis (MSPA) is an advanced technique that improves the understanding of landscape configurations (Lin et al. Citation2021, Citation2023). It is characterized by the identification and categorization of various landscape elements, such as linear corridors and core areas, which are critical for ecological connectivity and biodiversity conservation in urban environments (Yang et al. Citation2021; Tao et al. Citation2023; Zhang et al. Citation2023). When MSPA is integrated with geographic information systems (GIS) and remote sensing technologies, it enables a comprehensive analysis of urban expansion and its ecological impacts (Pan et al. Citation2023). Therefore, the prediction of LST and its relationship with urban morphology requires a detailed study of spatial patterns, especially the distribution and configuration of green spaces and impervious surfaces (Song et al. Citation2020). Innovative urban design solutions are necessary to maintain environmental quality and quality of life in cities undergoing urban transformation (Gherraz et al. Citation2020; Hu et al. Citation2022). Improving the spatial arrangement of urban green spaces is a strategic measure to mitigate the UHI effect (Tao et al. Citation2023). MSPA facilitates the differentiation of land use categories and reveals their ecological impacts (Zhang et al. Citation2023). This capability is crucial for urban ecological research and planning as it enables the identification of strategic areas for green space expansion or restoration to optimize urban cooling and ecological benefits (Yang et al. Citation2021; Lin et al. Citation2023; Pan et al. Citation2023).
In the context of urbanization and LST, the integration of MSPA with thermal remote sensing data to study the non-linear relationships between landscape morphology and LST is still in its infancy. Research is needed to develop methods that effectively combine these data sources to predict the impact of urbanization on local and regional climate patterns. In addition, the role of the various morphological elements identified by MSPA in influencing urban microclimate and the overall UHI effect should be further explored. The present study aims to fill these research gaps with three objectives. The first objective is to comprehensively assess the spatio-temporal changes in land use and their impact on the UHI phenomenon. The second objective is to describe and analyze the morphological changes in urban and natural landscapes using MSPA to understand their structural evolution over time. The third objective is to predict future LST changes using advanced polynomial regression models taking into account the identified morphological features. The novelty of this research lies in its integrated approach that combines LULC accuracy assessment, MSPA and LST prediction in a unified framework. This approach is essential for the development of sustainable urban planning strategies as it explores and predicts the non-linear relationship between landscape morphology and LST. The integration of advanced spatial analysis techniques such as MSPA with remote sensing and GIS enables urban planners to better understand and manage the ecological impacts of urbanization, promoting sustainable development amidst rapid urban growth.
2. Materials and methods
2.1. Study area
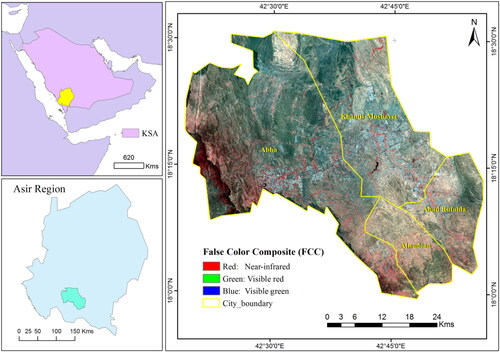
The study area located in the Asir region in Saudi Arabia covers 2287 km2 and includes the main cities of Abha, Khamis Mushayet, Alwadean and Ahad Rufaida. Asir is located in the southwestern part of Saudi Arabia, the largest nation in the Middle East, between latitudes 17°59'21.452 "N and 18°30'33.812 "N and longitudes 42°18'56.269 "E and 42°56'25.909 "E (). The landscape is characterised by rolling hills with altitudes varying between 1038 and 2990 m, with an average altitude of 2,180 m. The region receives an average of 355 mm of rainfall per year, mainly from April to June, and temperatures range from 18.50 °C to 31.50 °C. The Asir Mountains, especially the area around Jabal Al-Sooda, are particularly rich in flora and are home to a variety of plant species. The region’s varied climate and geographical features contribute to its great plant diversity. However, human activities, the steep and fragile terrain and rainfall patterns have led to significant land degradation and environmental problems. Abha, the capital of Asir, had a population of 289,975 in 2012, of which 78% are Saudis. The cities’ diverse landscapes have fuelled urban growth and the mountainous landscape attracts visitors. The significant urban expansion expected in these key cities of Asir shows the importance of sustainable urban planning to improve living conditions and attract tourism.
Figure 1. Study Area map of Abha, Khamis Mushayet, Alwadean and Ahad Rufaida cities.
2.2. Data source
The study analyzed landscape and land surface temperature (LST) changes over three decades using Landsat satellite imagery from different time periods: 1990, 2000 and 2020. The images were downloaded from Earth Explorer (https://earthexplorer.usgs.gov/) and selected according to their minimum cloud cover and clear contrast (see ). The pre-processing included several important steps to ensure the accuracy and reliability of the data. First, an atmospheric correction was performed using the dark object subtraction (DOS) method to remove atmospheric effects from the images. A radiometric calibration was then performed to convert the digital numbers (DN) to top of atmosphere reflectance (TOA), accounting for variations in sensor sensitivity and illumination conditions. A geometric correction was then applied to align the images to a map coordinate system and ensure accurate spatial referencing. These corrections were essential for reliable land use/land cover (LU/LC) analysis. Data processing and analysis was supported by field surveys conducted from June 20 to July 5, 2020 using Garmin GPS devices to collect ground-truth data. Software tools such as ArcGIS 10.3 and the R programming language were used for data analysis, while Python in a Jupyter Notebook environment facilitated the machine learning and mapping tasks. This comprehensive approach to pre-processing the data ensured high quality and accurate data for subsequent analysis and interpretation.
Table 1. Details of the satellite images utilized in this research.
2.3. Method for LULC mapping and accuracy assessment
In this study, LULC classification was performed using the RF algorithm with grid search optimization for the years 1990, 2000 and 2018 to understand the temporal changes in the landscape of the cities of Abha, Khamis Mushayet, Alwadean and Ahad Rufaida. The modeling was performed using the R programming language. The RF algorithm, an ensemble learning method for classification, uses multiple decision trees to improve prediction accuracy and prevent overfitting (Ampomah et al. Citation2020; Talukdar et al. 2020). The random Forest package in R was used to train the model on LULC data. The grid search optimization, implemented with packages such as caret, systematically worked through multiple combinations of parameter settings, performing cross-validation to determine the best parameters for the RF model. This process improved the performance of the model by selecting the optimal number of trees (n_estimators), the depth of trees (max_depth), the minimum number of samples required to split an internal node (min_samples_split), the minimum number of samples required for a leaf node (min_samples_leaf), and the number of features considered in the search for the best split (max_features).
Applying an RF model optimized for grid search for LULC mapping in the cities of Abha, Khamis Mushayet, Alwadean and Ahad Rufaida, for the years 1990, 2000 and 2020 resulted in different optimal hyperparameters for each period, reflecting the dynamic environmental and urban landscape. In 1990, the model favored a moderate tree depth (max_depth: 25) and a higher number of trees (n_estimators: 150). In 2000, deeper trees (max_depth: 30) and stricter node splitting criteria (min_samples_split: 5, min_samples_leaf: 2) were preferred. By 2020, an increase in the number of trees (n_estimators: 200) with a similar tree depth to 1990 was observed, indicating a response to more diverse data inputs. Across all time periods, 'auto’ was consistently selected for max_features, indicating a stable approach to feature selection. These parameters ensured accurate mapping of the different LULC classes such as built-up areas, water bodies and different vegetation types, capturing the evolving landscape of Abha, Khamis Mushayet, Alwadean and Ahad Rufaida cities over three decades.
The assessment of the accuracy of the multi-class LULC classification includes several key metrics calculated using a confusion matrix. The confusion matrix is a table that compares the predicted classifications with the actual ground-truth classifications, providing a comprehensive overview of the classification accuracy. Several metrics can be derived from this matrix. The omission error, also known as false negative rate, occurs when pixels belonging to a certain class are incorrectly classified into other classes. The commission error or false positive rate occurs when pixels from other classes are incorrectly assigned to the given class. User’s Accuracy (UA) is calculated by dividing the number of correctly classified pixels in a given class by the total number of pixels classified into that class and indicates the reliability of the classification for users. Producer’s Accuracy (PA) is the ratio of correctly classified pixels in a given class to the total number of actual pixels in that class and reflects the ability of the classifier to correctly identify that class. The kappa coefficient (κ) is a statistical measure that takes into account the randomly occurring correspondence. It is calculated by comparing the observed accuracy with an expected accuracy (random agreement) and ranges from −1 to 1, with values closer to 1 indicating a strong agreement. This comprehensive approach ensures a robust assessment of classification accuracy, which is essential for understanding the reliability of LULC maps.
2.4. Modeling landscape morphological analysis in Python
Morphological landscape analysis is a very scientific method for quantitatively analysing the shape, structure and spatial arrangement of landscape elements, usually using Morphological Spatial Pattern Analysis (MSPA) (An et al. Citation2021). This technique, based on mathematical morphology, is central to understanding the configuration and connectivity of landscape features (Soille and Vogt Citation2022). MSPA categorises the landscape into different morphological elements based on the spatial relationships and configurations of habitat or land use patches (Tang et al. Citation2022). Key elements identified in MSPA include core areas, edges, bridges, loops, branches, islets, and perforations (Soille and Vogt Citation2022). Core areas represent the central part of a habitat patch that is not affected by edge effects, while edges characterise the transition zones between different land covers or between habitat and non-habitat areas. Bridges are narrow stretches of land that connect two core areas and facilitate the movement of species between habitats. Loops are circular habitat areas that connect to themselves, enhancing internal connectivity. Branches extend outwards from the core and indicate potential expansion or connectivity paths, while islets are small, isolated patches separated from the main habitat. Perforations are holes or gaps within the core areas that indicate internal fragmentation (Soille and Vogt Citation2022).
The technical process of MSPA involves the conversion of spatial data into binary images in which the targeted landscape feature (e.g. a green space or a built-up area) is marked as foreground (1) against the background (0) (Soille and Vogt Citation2022). Modern image processing techniques such as skeletonisation are used to reduce the feature to its basic shape while preserving its topological and geometric properties (Brasil et al. Citation2022). This step is crucial for the identification of linear features such as bridges and branches. The analysis uses connectivity rules, often figure-of-eight connectivity in a raster grid, to evaluate the relationship between neighbouring pixels and determine how they contribute to the overall structure of the landscape. By setting thresholds for size and connectivity (e.g. edge width), MSPA delineates the landscape into its morphological classes. The result is a detailed categorisation that not only highlights the spatial arrangement and connectivity of landscape features, but also provides insights into potential ecological corridors, fragmentation and the impact of human activities on landscape structure. This methodological framework enables ecologists, urban planners and conservationists to assess landscape configuration and develop management strategies that promote biodiversity, connectivity and sustainable land use planning. We performed the MSPA modelling in Python to ensure the reproducibility and flexibility of our analysis and to avoid the limitations of proprietary software.
2.5. Method for LST modeling
Estimating land surface temperature (LST) is vital for analyzing climatic changes, urban heat islands, and ecological behaviors (Abdullah and Barua Citation2022). Satellite remote sensing effectively captures LST at a regional level, and methods like the Simulated Single Image (SSI) technique have been used to identify urban heat islands by analyzing LANDSAT series data (Ngie Citation2020). The Mono-Window (MW) algorithm is commonly used for LST estimation from thermal infrared (TIR) data, based on the radiative transfer equation linking satellite radiance with ground emissivity and LST (Sekertekin and Bonafoni Citation2020). Initially, the satellite’s brightness temperature is calculated from the thermal band’s digital numbers or radiance, adjusted for sensor calibration to convert to radiance and then to brightness temperature using the Planck function (Wang et al. Citation2023). However, to accurately represent LST, adjustments for atmospheric conditions, particularly water vapor, are necessary. The Mono-Window algorithm corrects for these effects, factoring in atmospheric water vapor and average atmospheric temperature (Wang et al. Citation2023). For LST analysis in Abha, Khamis Mushayet, Alwadean and Ahad Rufaida cities during 1990, 2000, and 2020, thermal infrared band data from multispectral datasets are essential, with Landsat’s thermal bands providing the necessary spectral range. Brightness temperatures for these periods are then refined using the Mono-Window Technique, accounting for local atmospheric conditions and land cover variability, which may require an emissivity map derived from LULC data or other sources to accurately reflect emissivity differences across Abha, Khamis Mushayet, Alwadean and Ahad Rufaida.
2.6. Method for advanced statistical analysis
In this study, advanced statistical methods, including trend analysis with linear regression and bootstrapping, and kernel density estimation (KDE) of the LST distribution were used to analyze the effects of landscape morphology and LST over time. The first method involved calculating temporal trends in landscape features using linear regression and bootstrapping for robustness. Specifically, the trend analysis function calculated the trend of each LULC category over the years 1990, 2000, and 2020. The bootstrapping included 1000 repetitions to ensure statistical significance and reliability. Samples with replacement were drawn at each replicate and a linear regression was performed for each sample to calculate the slope of the trend line. The median of the slope from the bootstrap distribution was used as the estimated trend, with a 95% confidence interval to measure the precision of this estimate. The p-value from the original linear regression assessed the significance of the trend. This procedure ensured that each sample included all unique years to avoid ambiguous values that could arise from non-representative samples. Ambiguous values related to issues such as non-representative or inconsistent samples were accounted for by ensuring that each bootstrap sample represented all unique years. Samples that did not represent all years were discarded and new samples were drawn. This filtering process ensured the robustness of the trend analysis, mitigated the effects of outliers and provided reliable trend estimates.
The second method used KDE to visualize the distribution of LST across different land cover types over time. In this process, a mask was applied to the LST data to isolate relevant pixels for each land cover type and filter out ambiguous values. The KDE plots provided a smooth representation of the data distribution, augmented by key statistical measures such as mean, maximum, minimum and coefficient of variation. These plots, arranged in a grid corresponding to different land cover types and years, allowed comparative analysis across time and space.
2.7. Method for developing pipeline of polynomial regression for assessing the relationship and forecasting of LST
We used polynomial regression to analyze the relationship between time and LST and to predict future trends. This technique extends linear regression by considering higher degree terms of the independent variables, which allows for a more nuanced representation of non-linear relationships. For the implementation, we created a polynomial regression model using a pipeline that includes three main steps: scaling the independent variable (year), generating polynomial features, and fitting a linear regression model. This approach, implemented with scikit-learn’s make_pipeline function, ensures a streamlined and efficient workflow. The pipeline approach combines these steps into a single process, simplifying the model fitting and prediction phases. In our study, we applied this pipeline to the preprocessed data and fitted different polynomial levels (degree 1, 2 and 3) to capture different degrees of data complexity and curvature. The pipeline allowed us to efficiently scale the data, generate polynomial features, and fit the linear regression model in a coherent manner.
The goodness of fit and predictive accuracy of the model were evaluated using metrics such as R-squared (R2) and Root Mean Squared Error (RMSE). This pipeline-based approach enabled robust and accurate modeling of the non-linear relationship between time and LST and facilitated predictions for future years to forecast LST trends.
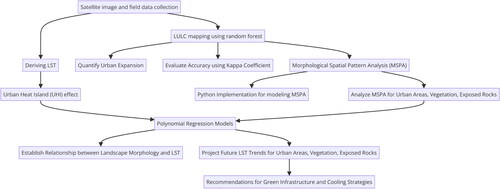
This predictive analysis helps to understand potential climatic changes and supports urban planning and sustainability efforts. Our comprehensive approach, which combines rigorous statistical modeling with applied environmental science, enables a detailed understanding of urban heat dynamics and their evolution over time. All the methods employed in this study were presented in a hierarchical flow chart ().
Figure 2. Hierarchical flow chart of the used methods of this study.
3. Results
3.1. Spatiotemporal dynamics of LULC and accuracy assessment
The application of the RF models optimized for grid search for LULC mapping in Abha, Khamis Mushayet, Alwadean and Ahad Rufaida cities for the years 1990, 2000 and 2020 resulted in accurate classification of different LULC classes, including built-up areas, water bodies, dense vegetation, sparse vegetation, agricultural land, scrubland and bare ground with exposed rock (). After the classification process, an accuracy assessment was carried out to evaluate the precision of the LULC models. In 1990, the model achieved an overall accuracy of 90.40% and a kappa coefficient of 0.88, with user accuracies of 84.90%, 97.50%, 88.20%, 82.40%, 86.60%, 95.10%, and 97.00% for built-up areas, water bodies, dense vegetation, sparse vegetation, agricultural land, scrubland, and bare soil with exposed rocks, respectively (Supplementary Tables 1 and 2). In 2000, the model maintained a high overall accuracy of 90.30% and a kappa coefficient of 0.88, with user accuracy for the same classes at 85.90%, 97.00%, 93.10%, 80.90%, 85.90%, 90.90%, and 97.05%, respectively (Supplementary Tables 3 and 4). In 2020, the model’s performance improved further, reaching an overall accuracy of 91.90% and a kappa coefficient of 0.90, with user accuracy for the classes at 88.20%, 98.00%, 88.90%, 84.00%, 91.00%, 96.00% and 97.30%, respectively (Supplementary Tables 5 and 6). These results highlight the model’s ability to accurately capture the evolving landscape of Abha, Khamis Mushayet, Alwadean and Ahad Rufaida over three decades.
Figure 3. Spatial representation of LULC classes derived using RF algorithm for the years 1990, 2000, and 2020.
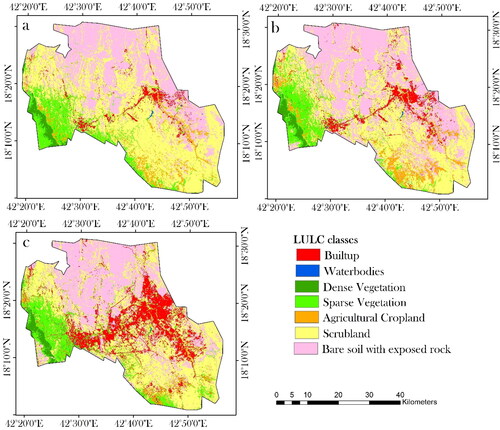
Table 2. Estimated trends and statistical significance for LULC classes over time.
Table 3. Estimated trends and statistical significance for MSPA elements in the urban landscapes over time.
Table 4. Estimated trends and statistical significance for MSPA elements in the vegetation landscapes over time.
Table 5. Estimated trends and statistical significance for MSPA elements in the exposed rocks landscapes over time.
Table 6. Comparative forecast analysis of future mean LST for the year 2030 across different MSPA classes within urban, vegetation, and exposed rock areas.
The analysis of LULC changes in Abha, Khamis Mushayet, Alwadean and Ahad Rufaida from 1990 to 2020 shows significant shifts in land use and land cover categories, largely due to anthropogenic activities (Supplementary Table 7 and ). The built-up area increased dramatically from 69.40 km2 in 1990 to 117.60 km2 in 2000 and further to 338.74 km2 in 2020, indicating rapid urbanization and infrastructural development, with an estimated trend of 9.28 (p = 0.105). This urban expansion has likely led to an increase in impervious surfaces, altering the local microclimate and potentially exacerbating the effects of the urban heat island. Conversely, the area of water bodies decreased from 1.51 km2 in 1990 to 1.14 km2 in 2000 and further to 0.54 km2 in 2020, showing a significant negative trend of −0.03 (p = 0.032). This decrease can be attributed to the diversion of water resources for urban use, leading to the depletion of natural water bodies and affecting local hydrology and aquatic ecosystems. Dense vegetation showed a positive trend, increasing from 43.36 km2 in 1990 to 47.23 km2 in 2000 and to 52.22 km2 in 2020, with an estimated trend of 0.29 (p = 0.075). This increase could reflect reforestation or afforestation efforts, which have a positive impact on biodiversity and carbon sequestration. However, the trend is not statistically significant. Sparse vegetation showed a non-significant fluctuating trend, decreasing from 228.46 km2 in 1990 to 193.52 km2 in 2000 and then increasing to 237.21 km2 in 2020, with an estimated trend of 0.56 (p = 0.758). This variability suggests alternating periods of degradation and natural regeneration, possibly influenced by changing land management practices and climatic conditions. The area under cultivation initially increased from 105.24 km2 in 1990 to 135.03 km2 in 2000, but then decreased significantly to 64.76 km2 in 2020, with a trend of −1.66 (p = 0.490). This decrease in agricultural land could be due to urban encroachment and the conversion of arable land to other crops, potentially affecting food security and the local agricultural economy. Bushland showed a decreasing trend from 1032.72 km2 in 1990 to 785.58 km2 in 2000, followed by a slight increase to 827.35 km2 in 2020, with an estimated trend of −5.57 (p = 0.555). This trend indicates a significant change in land cover, possibly due to urban expansion and land clearing, affecting soil stability and habitat availability. Bare soil with exposed rocks initially increased from 765.88 km2 in 1990 to 966.47 km2 in 2000, but then decreased to 725.76 km2 in 2020, with a non-significant trend of −2.87 (p = 0.780). These changes may reflect phases of construction activity and subsequent stabilization or reclamation measures. Overall, these LULC changes highlight the significant impact of human activity on the landscape and emphasize the need for sustainable land management practices to balance urban development and environmental protection.
3.2. Spatiotemporal dynamics of landscape morphology through quantitative MSPA approach
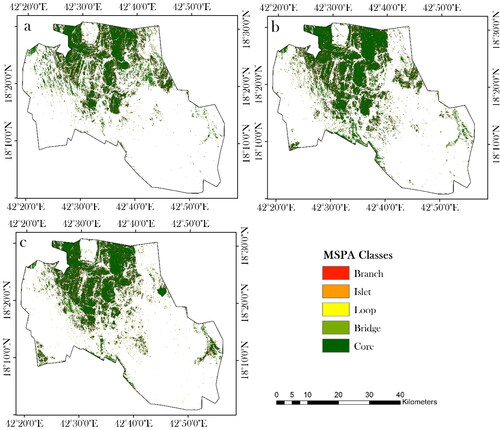
In this analysis, MSPA is used to decipher the spatial and structural evolution of urban areas, vegetation and exposed rocks over time (). Through a detailed examination of core, bridge, loop, islet, and branch elements, the study quantitatively assesses the dynamics of landscape morphology and the underlying ecological and urban development processes. The MSPA analysis for urban areas shows a significant increase in the size of the core area from 45.19 km2 in 2001 to 230.33 km2 in 2021, indicating a strong expansion of built-up regions. The trend analysis for the urban core area with an estimated trend of 9.26 and a p-value of 0.217 indicates a remarkable upward trend, even if it is not statistically significant within the 95% confidence interval (). An upward trend is also evident for bridge, loop, islet, and branching structures, with estimated trends of 0.85, 0.88, 0.34 and 2.14, respectively. These trends, despite their p-values (between 0.197 and 0.258), illustrate an increasing complexity of urban morphology characterised by an increase in connectivity and isolated urban formations. However, the statistical insignificance suggests that these changes over the years could be influenced by variable factors. In terms of vegetation, the core area has slightly decreased from 210.15 km2 in 1990 to 199.68 km2 in 2020, with a slight negative estimated trend of −0.215, reflecting possible fluctuations in dense and sparse vegetation cover. While this trend is consistent (as indicated by the narrow confidence interval), it is not statistically significant (p-value = 0.810), indicating that the slight decrease in vegetation core areas may not represent a continuous or consistent pattern (). In contrast, the positive trends in bridge, loop, islet, and branch structures (with trends of 0.353, 0.392, 0.144 and 0.177, respectively) indicate an increase in vegetative connectivity and fragmentation (). However, these trends indicate fragmented vegetation conditions. The exposed rocky areas showed a different trend, with the core area first increasing from 403.33 km2 in 1990 to 505.34 km2 in 2000 and then decreasing to 427.99 km2 in 2020. Despite the high p-value of 0.972, the slight positive trend of 0.152 in the core area indicates minor fluctuations in the coverage of exposed rocks (). Trends in bridge, loop, islet, and branch elements show mixed changes (with estimates of 0.207, −0.019, 0.078 and 0.088, respectively), suggesting changes in the spatial configuration of rocky landscapes (). However, these trends are not statistically significant, particularly with p-values between 0.073 and 0.741, highlighting the inherent variability and perhaps robustness of rocky landscapes to substantial morphological change.
Figure 4. MSPA of the urban areas demonstrating the evolution of urban morphology in terms of core, bridge, loop, islet, and branch structures for (a) 1990, (b) 2000, and (c) 2020.
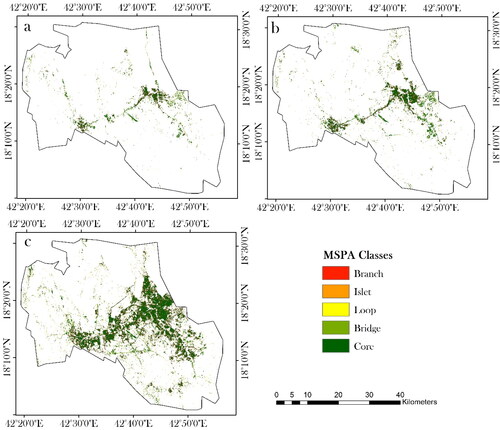
Figure 5. MSPA of the vegetation demonstrating the evolution of vegetation morphology in terms of core, bridge, loop, islet, and branch structures for (a) 1990, (b) 2000, and (c) 2020.
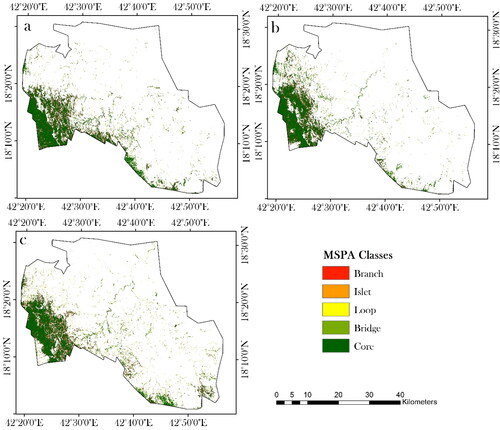
Figure 6. MSPA of the bare soil with exposed rock demonstrating the evolution of its morphology in terms of core, bridge, loop, islet, and branch structures for (a) 1990, (b) 2000, and (c) 2020.
The MSPA analysis across different landscape types therefore reveals a nuanced picture of the evolution of landscape morphology. Urban areas are becoming increasingly complex and interconnected, vegetated landscapes show high resilience and dynamic connectivity, while exposed rocky areas show relative stability with little fluctuation. Statistical analysis indicates trends, but often falls short of significance. This indicates that although patterns are recognisable, they are not uniformly pronounced or consistent over the periods studied, which illustrates the complex interplay of natural and anthropogenic factors in landscape morphology.
3.3. Spatiotemporal assessment of LST
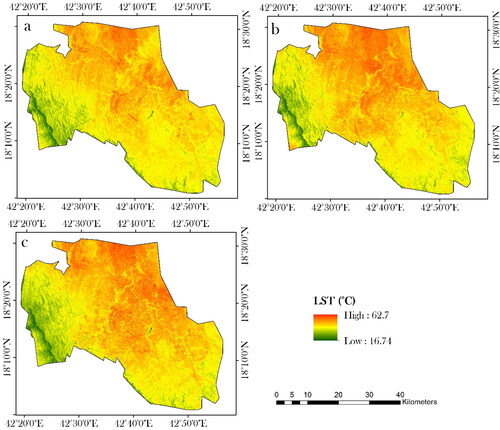
From 1990 to 2020, the study area, exhibited a discernible trend in LST corresponding with urban expansion and the intensification of the UHI effect (). At the beginning, the average LST in 1990 was 40.55 °C with a standard deviation of 3.64 and a median of 40.77 °C. A decade later, the average rose slightly to 41.29 °C with a slightly lower standard deviation of 3.50, while the median rose to 41.76 °C. By 2020, a significant increase in mean LST to 46.73 °C and a median of 47.77 °C with a lower standard deviation of 3.23 indicates a general warming, which is emphasised by the rightward shift of the LST distribution and a tripling of the area exceeding 50 °C from 36.58 km2 in 1990 to 133.52 km2 in 2020. In particular, urban areas warmed more strongly, starting with a mean LST of 43.71 °C in 1990 and reaching 50.46 °C in 2020, with standard deviations of 4.54 and 4.47 respectively. This significant increase in LST in cities, which is stronger than in the region as a whole, highlights the escalating UHI effect associated with urban growth and reinforces the link between urbanisation and rising LST values.
Figure 7. Spatial distribution of LST for (a) 1990, (b) 2000, and (c) 2020 with minimum-maximum legend for uniform visualization to show gradual changes of temperature.
3.4. Assessing non-linear relationship between landscape morphology and LST over time and forecasting
3.4.1. The application of KDE
Analysing the LST distribution across different LULC types over three decades shows significant changes (). In built-up areas, the mean LST increased from 43.71 °C in 1990 to 46.84 °C in 2020, with the variability (CV: Coefficient of Variation) decreasing slightly from 10.39% to 10.54%, indicating a slight increase in temperature uniformity in these urban areas. The opposite trend was observed in the vegetative areas: The mean LST decreased from 37.26 °C in 1990 to 36.97 °C in 2020, combined with a decrease in variability from 17.77% to 15.86%. This could reflect an increase in vegetation density or health status, which are often associated with cooler temperature distributions. In exposed rocks, the mean LST started with a higher value of 50.60 °C in 1990, decreased slightly to 49.97 °C in 2000 and then fluctuated again to 49.77 °C in 2020. Interestingly, the variability in exposed rocks decreased over time, from 10.56% in 1990 to 10.19% in 2020, suggesting a more homogeneous temperature profile in these areas.
Figure 8. Distribution of LST across different LULC types in 1990, 2000, and 2020.
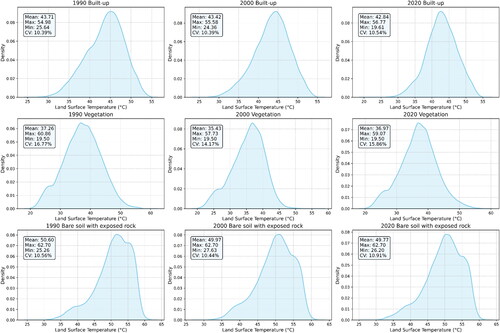
The detailed examination of the maximum LST values also shows remarkable trends. Built-up areas recorded a steady increase from 54.98 °C in 1990 to 56.77 °C in 2020, which is consistent with the urban heat island effect, where urban structures accumulate and radiate heat. Conversely, vegetated areas reached a peak of 60.86 °C in 1990 and then declined to a lower peak of 59.07 °C in 2020, which could be due to environmental management measures or natural adjustments. Exposed rocks maintained relatively high maximum temperatures, peaking at 62.70 °C in 1990 and declining only slightly to 62.70 °C by 2020, emphasising the inherent resilience or stability of these ecosystems to temperature changes. The minimum LST values for all LULC types remained comparatively stable, indicating that the basic temperature conditions of the areas have not changed drastically.
3.4.2. Development of pipeline of polynomial regression for assessing the relationship and forecasting of LST
3.4.2.1. Forecasting and relationship between urban morphology and LST
This study uses a pipeline of polynomial regression analyses to shed light on the intricate relationship between landscape morphology and land surface temperature and to provide an outlook on future thermal patterns. The performance of the model in the different MSPA classes of urban areas, as assessed by the R2 and RMSE values, generally indicates high accuracy, especially for higher degree polynomials, which all show a perfect fit (R2=1.00) with an RMSE of 0.00 ( and Supplementary Table 8). In particular, for the Core class, a first degree polynomial provides a strong fit (R2=0.97) with a significant magnitude of change (7.13 °C) projecting an increasing LST trend leading to a significant projected mean LST of 58.47 °C by 2030. Higher degrees confirm the increasing trend, but with lower projected mean LSTs of 49.31 °C and 49.17 °C for the second and third grades, respectively (). In contrast, the bridge class shows strong but less perfect agreement for the first degree polynomial (R2=0.83), which predicts a future mean LST of 53.74 °C, indicating a warmer environment possibly caused by urban development and associated heat. However, higher degree polynomials predict a cooler future, with 36.05 °C and 35.80 °C for the second and third degree, respectively. This divergence could indicate a non-linear impact of landscape change on LST or a saturation point beyond which the UHI effect no longer increases at the same rate. Similarly, the Loop and Islet classes show increasing trends with the first-degree model and predict an average LST of 52.37 °C and 52.68 °C respectively by 2030 (). Again, the higher degree models indicate lower future temperatures, suggesting a complex interaction between landscape morphology and temperature that cannot be captured by a simple linear trend. Finally, the Branch class follows a similar pattern, showing a first-degree prediction for a substantial increase to 59.60 °C, while higher degrees attenuate this to around 48.20 °C. This emphasises the importance of considering complex models for LST prediction in different MSPA classes (Supplementary Table 8).
3.4.2.2. Forecasting and relationship between vegetation morphology and LST
The analysis of the MSPA of the vegetation areas using polynomial regression shows a clear trend towards an increase in LST in the various fragmentation classes (). The core class shows a high degree of model fit for a first-degree polynomial with an R2 of 0.98 and an RMSE of 0.48, which predicts an increase in mean LST of 5.21 °C, leading to a projected value of 42.19 °C by 2030. Although second and third degree polynomials show perfect fits (R2=1), they predict a slightly lower mean LST of around 37.27 °C and 37.20 °C respectively, suggesting a possible weakening of the rising trend (Supplementary Table 9 and ).
Figure 9. Trend analysis and forecasting of mean LST for various MSPA classes of urban areas from 1990 to 2010 with projections to 2030 using polynomial regression of degrees 1–3.
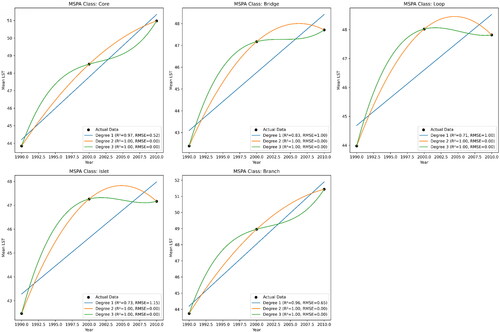
Figure 10. Trend analysis and forecasting of mean LST for various MSPA classes of vegetation areas from 1990 to 2010 with projections to 2030 using polynomial regression of degrees 1–3.
For the bridge class, the first degree polynomial model performs exceptionally well (R2=0.99) with a low RMSE of 0.30, indicating an increase of 5.99 °C to a future mean LST of 49.12 °C (). The models for the higher degrees show a slight weakening of this trend and predict future mean LSTs of 46.06 °C and 46.01 °C for the second and third degrees, respectively. The loop class also shows a near perfect fit for the first degree polynomial (R2=0.998), with a significant projected increase from 6.92 °C to 49.30 °C in 2030, while the second and third degree models indicate a slightly higher mean LST of over 51 °C, a unique case where higher degrees predict a warmer future. The class of islet shows the best fit (R2=0.999) for the first degree polynomial with an extremely low RMSE, and the mean LST is expected to increase by 6.59–50.09 °C in the future. Interestingly, the second and third degree models predict a further increase, albeit only slightly higher, suggesting a strong and consistent upward trend. Finally, the branch class with an R2 of 0.97 and an RMSE of 0.66 for the first degree polynomial predicts a future mean LST increase from 4.93 °C to 42.56 °C. Again, the higher degree models slightly weaken this trend and predict future mean LSTs around 35.86 °C and 35.76 °C for the second and third degree, respectively (). These results emphasise a general trend towards increasing LSTs in the fragmented MSPA classes of vegetation areas, albeit to varying degrees depending on the polynomial degree considered, highlighting the importance of model selection based on the ecological and climatic context of the study area.
3.4.2.3. Forecasting and relationship between exposed rock morphology and LST
The polynomial regression analysis for the MSPA of the exposed rock areas shows a recognisable trend of increasing LST in all MSPA classes with varying degrees of confidence and predicted changes (). In the Core class, the first degree polynomial shows good agreement (R2=0.745) and predicts a significant increase of 4.94 °C to a future mean LST of 55.79 °C by 2030 (Supplementary Table 10 and ). However, the second- and third-degree models predict a significantly lower mean LST of 34.92 °C and 34.62 °C, respectively, with both achieving a perfect fit (R2=1), suggesting a possible non-linear relationship between LST and landscape morphology in exposed rock areas (Supplementary Table 10 and ).
Figure 11. Trend analysis and forecasting of mean LST for various MSPA classes of exposed rocks areas from 1990 to 2010 with projections to 2030 using polynomial regression of degrees 1–3.
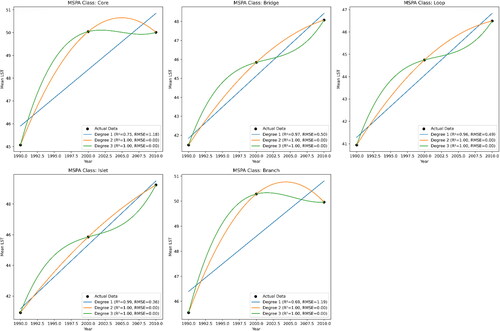
The bridge class also shows an increasing trend, with the first degree polynomial providing an excellent fit (R2=0.966) and predicting an increase from 6.59 °C to a mean LST of 55.03 °C by 2030 (Supplementary Table 10 and ). The higher degree models also indicate an increase, but predict a cooler future with mean LST values of 46.16 °C and 46.03 °C, possibly reflecting complex interactions in the rock landscapes that influence LST. For the Loop class, the first degree model predicts an increase of 5.55–52.38 °C by 2030 with an R2 of 0.956, while the second and third degree models again predict lower future temperatures of around 43.80 °C and 43.68 °C, illustrating a general but not uniform warming trend (Supplementary Table 10 and ). The Islet class with the highest model fit of R2=0.989 for the first degree polynomial predicts the largest temperature increase of all classes to 57.83 °C, which corresponds to an increase of 8.33 °C by 2030. The higher degree models slightly attenuate this warming with 51.40 °C and 51.30 °C, indicating that the microclimate of the exposed rocks may influence the lower warming effect (Supplementary Table 10 and ). Finally, the Branch class with the lowest fit for a first degree polynomial (R2=0.695) still predicts an increase of 4.41 °C to 55.22 °C by 2030, but the second and third degree models predict a future mean LST of 34.11 °C and 33.81 °C, respectively, suggesting a smaller effect of increasing temperatures (Supplementary Table 10 and ). These analyses show that while exposed bedrock areas are expected to experience an increase in mean LST, the magnitude and trends vary by polynomial degree, highlighting the complexity of the LST response to changes in landscape morphology.
3.4.2.4. Overall assessment of the relationship and forecasting
The projections derived from indicate an overarching trend of rising mean LST in different MSPA classes by 2030, which has significant implications for urban planning, ecological management and climate resilience strategies. In urban areas, a pronounced increase in LST emphasises the urgency to implement heat mitigation strategies, such as green infrastructure and cooling surfaces, especially in urban core zones where the heat island effect is strongest. In vegetated areas, although the trend is also increasing, the lower temperature projections compared to urban areas emphasise the role of vegetation in regulating the microclimate, suggesting that the expansion of green spaces could be an important approach to counteract urban warming.
For exposed rocky areas, the expected increase in LST requires monitoring and possibly management of visitor access and conservation efforts, especially in nature reserves or parks, to minimise ecological disturbance that could result from increased temperatures. In all MSPA classes and land cover types, continued increases in LST may affect species distributions, hydrological cycles and ecosystem services, requiring adaptive management to maintain biodiversity and ecosystem functionality.
4. Discussion
In this study, we conducted a comprehensive analysis of the spatiotemporal dynamics of LULC, urban morphology and LST in the cities of Abha, Khamis Mushayet, Alwadean and Ahad Rufaida, Saudi Arabia. By combining LULC classification, MSPA and polynomial regression modelling, we aimed to understand the intricate relationships between urban expansion, structural changes in the landscape and thermal fluctuations over time. This approach allowed us to quantify and predict the impact of urbanisation on the local environment and contribute to the sustainable urban planning initiatives of Saudi Vision 2030.
4.1. Discussion on the impact of landscape morphology and LST
Analysis of LULC changes in Asir has revealed significant urban expansion, reflecting the overall urbanization trends driven by Saudi Vision 2030. This initiative, which aims to shift the economy away from oil dependence, has driven rapid infrastructure development and urban sprawl, increasing Asir’s built-up area from 45.19 km2 in 2001 to 230.33 km2 in 2021. This expansion underscores the city’s economic growth and highlights the urgent need for effective land management strategies to balance development and environmental sustainability. Our findings are consistent with several similar studies in regions experiencing rapid urbanization. In Al Baha, for example, urban areas have expanded significantly, consuming pasture, forest and scrubland, similar to the reduction of natural landscapes in Asir (Alsharif et al. Citation2022). Similarly, urban growth in Dammam, Raipur, and Hydrabad has led to an increase in LST, which is consistent with our projected increase in LST due to the urban heat island effect in Asir (Rahman et al. Citation2017; Guha et al. Citation2023; Guha and Govil Citation2023). The study in Gautam Budh Nagar found significant urban expansion at the expense of agricultural land, which is consistent with urban sprawl affecting natural resources in Asir (Somvanshi et al. Citation2020). Studies in Mekelle City and Nizwa also show that urban growth leads to a reduction in agricultural land and vegetation, reflecting the environmental pressures of urbanization similar to Asir (Fenta et al. Citation2017; Mansour et al. Citation2020). The Bisha watershed study also found an increase in LST and a decrease in vegetation due to urban expansion, similar to Asir (Mallick et al. Citation2022). In Ibri, Oman, rapid urbanization is predicted to convert desert and undeveloped land into urban areas, indicating similar environmental problems as in Asir (Mansour et al. Citation2022). Studies in Riyadh, Jeddah and Mecca show that the strong growth of cities leads to a reduction in agricultural land, which is consistent with the trends observed in Asir (Alqurashi and Kumar Citation2019). The study on the twin city of Asir-Khamis highlights the considerable urban expansion and its impact on ecosystem services, which supports our findings on the need for sustainable land management strategies (Bindajam et al. Citation2021).
MSPA is widely used to understand urban expansion and its impacts on natural landscapes. In the Colombo Metropolitan Area, MSPA showed a significant increase in urban footprint and highlighted the predominant jump pattern of urban expansion, mirroring the dynamics observed in Asir (Subasinghe et al. Citation2022). In Nanjing, the MSPA also showed strong forest fragmentation due to urban expansion, indicating a high correlation between urban growth and forest edge expansion, which is consistent with our observations in Asir (Zhang et al. Citation2020). The assessment of polycentric urban growth in Rome with MSPA showed chaotic urban expansion without significant formation of sub-centers, comparable to the fractal and dispersed urban growth patterns in Asir (Salvati Citation2015). In Pukou, China, MSPA combined with landscape connectivity analyzes provided insights into the spatial priority of green infrastructure planning, highlighting the need for integrated approaches in rapidly urbanizing regions such as Asir (Wei et al. Citation2018). Finally, the application of MSPA to green corridors in Gaoyou City showed how urban expansion affects ecological connectivity, similar to urban-induced environmental pressures in Asir (Wang and Pei Citation2020).
In contrast, some studies show different patterns. In Ranchi, India, urban area growth exceeded projections by 11%, indicating less controlled urban expansion compared to Asir (Ahmad et al. Citation2017). The study in Kano metropolis, Nigeria, showed significant urban growth leading to an increase in vegetation and a reduction in barren land, which contrasts with the reduction in natural landscapes in Asir (Koko et al. Citation2021). Urban expansion in Morogoro, Tanzania, led to a significant increase in planned land use, which differs from the unplanned urban sprawl in Asir (Mshana et al. Citation2022). In Lahore, Pakistan, urbanization led to a temperature increase of 4.3 °C, indicating a strong urban heat island effect (Ramzan et al. Citation2022). Finally, in Rajpur-Sonarpur, India, the study found a significant increase in built-up area and a loss of vegetation, which contrasts with the relatively stable exposed rocky areas in Asir (Halder et al. Citation2021).
The predictive analysis of our study, which shows the future heat landscape in the context of ongoing urban development, underlines the need for urban planners and policy makers to develop adaptation strategies. This approach is particularly crucial in the context of the Saudi Vision 2030 to mitigate negative environmental impacts and promote a sustainable urban environment. The comprehensive analysis conducted in this study provides a detailed understanding of the complex interplay between urbanization, landscape morphology and LST in Asir. The results emphasize the need for integrated urban planning approaches that take into account the ecological and thermal impacts of landscape change.
4.2. Novelty of this study
The technological novelty of this study lies in the integrative application of advanced spatial analysis techniques and machine learning algorithms to assess and predict the environmental impacts of urbanization. Using high-resolution satellite imagery, we employed RF classification to analyze land use change with exceptional accuracy, overcoming the limitations of conventional classification methods. This approach ensures robust and precise identification of urban expansion patterns and their ecological impacts. Silibello et al. (Citation2021) demonstrated the effectiveness of integrating different data sources with machine learning algorithms for accurate environmental monitoring, which supports our integrative approach. Moreover, Feizizadeh et al. (Citation2021) showed higher accuracy and spatial confidence in monitoring land use/land cover changes using a fuzzy object-based deep learning approach, confirming the advanced capabilities of combining deep learning with spatial analysis. Furthermore, Meyer et al. (Citation2019) have emphasized the importance of spatial variable selection in machine learning applications to ensure reliable spatial predictions and overcome the challenges of spatial autocorrelation. A particularly innovative aspect of our study is the use of MSPA in Python to study changes in landscape morphology in detail. MSPA, traditionally underutilized in urban studies in the Saudi Arabian context, provided comprehensive insights into the structural evolution of urban and natural areas. This method allowed us to capture and analyze the dynamic interactions between natural processes and anthropogenic activities with a level of detail not commonly found in similar studies. In addition, we developed a polynomial regression analysis to predict the LST, which represents a significant advance in predictive environmental modeling. This approach allowed us to understand the complex, non-linear relationship between landscape morphology and LST, and provided accurate predictions of future temperatures. The ability to predict LST changes with high precision is critical for urban planners and policy makers, especially in rapidly urbanizing regions such as Abha, Khamis Mushayet, Alwadean and Ahad Rufaida, where the UHI effect is a major challenge. These technological innovations not only improve the accuracy of environmental monitoring and prediction, but also provide scalable and adaptable methods for urban planners and policy makers to effectively address the challenges of rapid urbanization and climate change. By integrating machine learning algorithms with spatial analysis techniques, our study provides a sophisticated framework that can be applied to various urban contexts worldwide, providing valuable insights and tools for sustainable urban development.
4.3. Targeted management strategies
For the cities of Abha, Khamis Mushayet, Alwadean and Ahad Rufaida, the increase in LST associated with urban expansion requires targeted management strategies to mitigate the UHI effect. The significant growth of the urban core area from 45.19 km2 in 2001 to 230.33 km2 in 2021, as identified in the MSPA, underlines the need to integrate green spaces into the urban fabric. D’Silva (Citation2020) emphasized the importance of integrating green spaces into the urban environment to mitigate the UHI effect and supported the development of urban parks, rooftop gardens and green corridors to provide cooling and promote biodiversity. In addition, building materials with higher albedo values and investment in cool roofs can reflect more sunlight and absorb less heat, lowering the overall temperature of the built environment, as shown by Ren et al. (Citation2020). As for water bodies, the negative trend in land area and slight deterioration in water quality necessitate the adoption of sustainable water management practices. Huang and Wang (Citation2020) emphasized the importance of sustainable water management practices, including the restoration of natural water bodies and the creation of artificial lakes or ponds to support urban cooling and replenish groundwater. In addition, trend analysis showing a slight increase in vegetated areas suggests that the cities of Abha, Khamis Mushayet, Alwadean and Ahad Rufaida could benefit from an urban forestry program focused on planting native and drought-resistant tree species. Chaturvedi and de Vries (Citation2021) proposed urban forestry programs that focus on planting native and drought-resistant tree species to cool urban areas and contribute to carbon sequestration, which supports our strategy. This program would not only help cool the urban area, but also contribute to carbon sequestration and provide recreational spaces for residents. Given the slight, but not significant, decline in vegetation cover, it is crucial to enforce land use policies that prevent unnecessary deforestation and promote the sustainable development of green spaces. Stability in exposed rocky areas suggests that these regions can be preserved as natural landmarks and integrated into the city’s green infrastructure network. By focusing on the preservation of natural landscapes and the strategic development of urban green spaces, the cities of Abha, Khamis Mushayet, Alwadean and Ahad Rufaida can effectively counteract the negative effects of rapid urbanization and rising temperatures and promote a sustainable and livable urban environment.
5. Conclusion
The comprehensive study highlighted the intricate relationship between urbanisation, landscape morphology and LST in the context of Saudi Arabia’s rapid urban development. Multitemporal LULC analyses, MSPA and polynomial regression predictions provided significant insights into the spatio-temporal dynamics of urban expansion and its environmental impacts. The accuracy of LULC models improved over the decades, indicating a refinement of classification techniques and data quality. The study revealed a remarkable expansion of urban core areas, underpinning the robust urbanisation process. The results of the MSPA study highlight the increasing complexity and connectivity of urban landscapes, while vegetated areas show high resilience despite a slight reduction in the size of core areas. Exposed rocks showed relative stability, indicating minimal morphological changes over time. Polynomial regression modelling predicted a significant increase in LST by 2030, highlighting the warming trend associated with urban growth and the need for sustainable urban planning to mitigate the UHI effect. This research emphasises the central role of green infrastructure and cooling strategies in urban development plans to combat temperature rise. The quantitative modelling in this study provides a robust framework for predicting LST variability and serves as an important tool for policy makers in urban environmental management and planning.
However, the study is not without limitations. The dependence on specific modelling techniques and the scale of the data may affect the generalisability of the results. Future research should consider the integration of more diverse data sources, such as satellite imagery over longer time periods, and the use of machine learning algorithms to improve predictive accuracy and insights into the complex interactions between urbanisation, landscape morphology and LST. In addition, research into the socio-economic factors contributing to urban growth and their impact on the environment could provide a more holistic understanding of the urbanisation phenomenon and its impact on sustainability.
Author contributions
Conceptualization, Ahmed Ali A. Shohan, Mohammed J. Alshayeb, Ahmed Ali Bindajam, Hoang Thi Hang; Data curation, Javed Mallick, Mohammed J. Alshayeb, Hoang Thi Hang; Formal analysis, Ahmed Ali A. Shohan, Ahmed Ali Bindajam, Hoang Thi Hang; Funding acquisition, Mohammed J. Alshayeb; Methodology, Mohammed J. Alshayeb, Ahmed Ali A. Shohan, Hoang Thi Hang; Project administration, Ahmed Ali A. Shohan, Mohammed J. Alshayeb, Ahmed Ali Bindajam, Javed Mallick; Resources, Hoang Thi Hang, Mohammed J. Alshayeb, Ahmed Ali Bindajam; Software, Hoang Thi Hang; Supervision, Mohammed J. Alshayeb, Ahmed Ali Bindajam, Hazem Ghassan Abdo; Validation: Hoang Thi Hang; Writing – original draft, Ahmed Ali A. Shohan, Ahmed Ali Bindajam, Hoang Thi Hang; Writing – review & editing, Javed Mallick, Hazem Ghassan Abdo.
Supplementary.docx
Download MS Word (35.2 KB)Acknowledgement
The authors extend their appreciation to the Deanship of Scientifc Research at King Khalid University for funding this work through Research Group under grant number RGP2/349/44.
Disclosure statement
No potential conflict of interest was reported by the author(s).
Data availability statement
The data that support the findings of this study are available from the corresponding author upon reasonable request.
Additional information
Funding
References
- Abdullah S, Barua D. 2022. Modeling land surface temperature with a mono-window algorithm to estimate urban heat island intensity in an expanding urban area. Environ Process. 9(1):14. doi: 10.1007/s40710-021-00554-8.
- Ahmad F, Goparaju L, Qayum A. 2017. LULC analysis of urban spaces using Markov chain predictive model at Ranchi in India. Spat Inf Res. 25(3):351–359. doi: 10.1007/s41324-017-0102-x.
- Almeida CRD, Teodoro AC, Gonçalves A. 2021. Study of the urban heat island (UHI) using remote sensing data/techniques: a systematic review. Environments. 8(10):105. doi: 10.3390/environments8100105.
- AlQadhi S, Mallick J, Talukdar S, Bindajam AA, Shohan AAA, Shahfahad. (2021). Quantification of urban sprawl for past-to-future in Abha City, Saudi Arabia. Comp Modeling Eng Sci. 129(2), 755–786. doi: 10.32604/cmes.2021.016640.
- Alqurashi AF, Kumar L. 2019. An assessment of the impact of urbanization and land use changes in the fast-growing cities of Saudi Arabia. Geocarto Int. 34(1):78–97. doi: 10.1080/10106049.2017.1367423.
- Alsharif M, Alzandi AA, Shrahily R, Mobarak B. 2022. Land use land cover change analysis for urban growth prediction using landsat satellite data and Markov Chain Model for Al Baha region Saudi Arabia. Forests. 13(10):1530. doi: 10.3390/f13101530.
- Ampomah EK, Qin Z, Nyame G. 2020. Evaluation of tree-based ensemble machine learning models in predicting stock price direction of movement. Information. 11(6):332. doi: 10.3390/info11060332.
- An Y, Liu S, Sun Y, Shi F, Beazley R. 2021. Construction and optimization of an ecological network based on morphological spatial pattern analysis and circuit theory. Landscape Ecol. 36(7):2059–2076. doi: 10.1007/s10980-020-01027-3.
- Atasoy M. 2020. Assessing the impacts of land-use/land-cover change on the development of urban heat island effects. Environ Dev Sustain. 22(8):7547–7557. doi: 10.1007/s10668-019-00535-w.
- Badugu A, Arunab KS, Mathew A. 2024. Predicting land surface temperature using data-driven approaches for urban heat island studies: a comparative analysis of correlation with environmental parameters. Model Earth Syst Environ. 10(1):1043–1076. doi: 10.1007/s40808-023-01822-2.
- Bindajam AA, Mallick J, Talukdar S, Islam ARMT, Alqadhi S. 2021. Integration of artificial intelligence–based LULC mapping and prediction for estimating ecosystem services for urban sustainability: past to future perspective. Arab J Geosci. 14(18):1–23. doi: 10.1007/s12517-021-08251-4.
- Bradshaw CJ, Sodhi NS, Brook BW. 2009. Tropical turmoil: a biodiversity tragedy in progress. Front Ecol Environ. 7(2):79–87. doi: 10.1890/070193.
- Brasil IDS, Corte APD, Moura MM, Nakajima NY, Sanquetta CR, Rex FE, Mallmann AA. 2022. Contributions of forest regeneration after intense fragmentation in the Amazon through morphological spatial pattern analysis. Forest Sci. 68(5–6):508–520. doi: 10.1093/forsci/fxac034.
- Chaturvedi V, de Vries WT. 2021. Machine learning algorithms for urban land use planning: a review. Urban Sci. 5(3):68. doi: 10.3390/urbansci5030068.
- Cilek MU, Uslu C. 2022. Modeling the relationship between the geometric characteristics of urban green spaces and thermal comfort: the case of Adana city. Sust Cities Soc. 79:103748. doi: 10.1016/j.scs.2022.103748.
- Cohen B. 2004. Urban growth in developing countries: a review of current trends and a caution regarding existing forecasts. World Dev. 32(1):23–51. doi: 10.1016/j.worlddev.2003.04.008.
- D’Silva, K. 2020. Modeling urban venue dynamics through spatio-temporal metrics and complex networks [Doctoral dissertation]. Apollo - University of Cambridge Repository. doi: 10.17863/CAM.58444.
- Feizizadeh B, Mohammadzade Alajujeh K, Lakes T, Blaschke T, Omarzadeh D. 2021. A comparison of the integrated fuzzy object-based deep learning approach and three machine learning techniques for land use/cover change monitoring and environmental impacts assessment. GIScience Remote Sens. 58(8):1543–1570. doi: 10.1080/15481603.2021.2000350.
- Fenta AA, Yasuda H, Haregeweyn N, Belay AS, Hadush Z, Gebremedhin MA, Mekonnen G. 2017. The dynamics of urban expansion and land use/land cover changes using remote sensing and spatial metrics: the case of Mekelle City of northern Ethiopia. Int J Remote Sens. 38(14):4107–4129. doi: 10.1080/01431161.2017.1317936.
- Garuma GF, Blanchet JP, Girard É, Leduc M. 2018. Urban surface effects on current and future climate. Urban Clim. 24:121–138. doi: 10.1016/j.uclim.2018.02.003.
- Ghanbari R, Heidarimozaffar M, Soltani A, Arefi H. 2023. Land surface temperature analysis in densely populated zones from the perspective of spectral indices and urban morphology. Int J Environ Sci Technol. 20(3):2883–2902. doi: 10.1007/s13762-022-04725-4.
- Gherraz H, Guechi I, Alkama D. 2020. Quantifying the effects of spatial patterns of green spaces on urban climate and urban heat island in a semi-arid climate. Bull Soc Roy Sc de Liège. 89:164–185. doi: 10.25518/0037-9565.9821.
- Goel RK, Vishnoi S. 2022. Urbanization and sustainable development for inclusiveness using ICTs. Telecommun Policy. 46(6):102311. doi: 10.1016/j.telpol.2022.102311.
- Guha S, Govil H. 2023. Evaluating the stability of the relationship between land surface temperature and land use/land cover indices: a case study in Hyderabad city, India. Geol Ecol Landscapes. 1–13. doi: 10.1080/24749508.2023.2182083.
- Guha S, Govil H, Mukherjee S. 2023. Long-term evaluation of land surface temperature with bare surface index and surface vegetation index: a case study of a central Indian city. Pap Appl Geography. 9(4):425–441. doi: 10.1080/23754931.2023.2240803.
- Halder B, Bandyopadhyay J, Khedher KM, Fai CM, Tangang F, Yaseen ZM. 2022. Delineation of urban expansion influences urban heat islands and natural environment using remote sensing and GIS-based in industrial area. Environ Sci Pollut Res Int. 29(48):73147–73170. doi: 10.1007/s11356-022-20821-x.
- Halder B, Haghbin M, Farooque AA. 2021. An assessment of urban expansion impacts on land transformation of Rajpur-Sonarpur Municipality. Kbes. 2(3):34–53. doi: 10.51526/kbes.2021.2.3.34-53.
- Han W. 2023. Analyzing the scale dependent effect of urban building morphology on land surface temperature using random forest algorithm. Sci Rep. 13(1):19312. doi: 10.1038/s41598-023-46437-w.
- Hassan AM, Lee H. 2015. Toward the sustainable development of urban areas: an overview of global trends in trials and policies. Land Use Policy. 48:199–212. doi: 10.1016/j.landusepol.2015.04.029.
- Heisler GM, Brazel AJ. 2010. The urban physical environment: temperature and urban heat islands. Urban Ecosystem Ecol. 55:29–56.
- Hu D, Meng Q, Schlink U, Hertel D, Liu W, Zhao M, Guo F. 2022. How do urban morphological blocks shape spatial patterns of land surface temperature over different seasons? A multifactorial driving analysis of Beijing, China. Int J Appl Earth Obs Geoinf. 106:102648. doi: 10.1016/j.jag.2021.102648.
- Huang B, Wang J. 2020. Big spatial data for urban and environmental sustainability. Geo-Spat Information Sci. 23(2):125–140. doi: 10.1080/10095020.2020.1754138.
- Hussain S, Mubeen M, Nasim W, Mumtaz F, Abdo HG, Mostafazadeh R, Fahad S. 2024. Assessment of future prediction of urban growth and climate change in district Multan, Pakistan using CA-Markov method. Urban Clim. 53:101766. doi: 10.1016/j.uclim.2023.101766.
- Keeley AT, Beier P, Jenness JS. 2021. Connectivity metrics for conservation planning and monitoring. Biol Conserv. 255:109008. doi: 10.1016/j.biocon.2021.109008.
- Khan N, Jhariya MK, Raj A. 2022. Urban greening toward sustainable development and sustainability. In: Biodiversity, conservation and sustainability in asia: volume 2: prospects and challenges in South and Middle Asia. Cham: Springer International Publishing. p. 345–373.
- Kim SW, Brown RD. 2021. Urban heat island (UHI) intensity and magnitude estimations: a systematic literature review. Sci Total Environ. 779:146389. doi: 10.1016/j.scitotenv.2021.146389.
- Koko AF, Wu Y, Abubakar GA, Alabsi AAN, Hamed R, Bello M. 2021. Thirty years of land use/land cover changes and their impact on urban climate: a study of Kano metropolis, Nigeria. Land. 10(11):1106. doi: 10.3390/land10111106.
- Kumar A, Upreti M, Pandey AC, Saikia P, Khan ML. 2023. Contribution of landscape transformation in the development of heat islands and sinks in urban and peri-urban regions in the Chota–Nagpur Plateau, India. Resources. 12(5):58. doi: 10.3390/resources12050058.
- Liang Z, Wu S, Wang Y, Wei F, Huang J, Shen J, Li S. 2020. The relationship between urban form and heat island intensity along the urban development gradients. Sci Total Environ. 708:135011. doi: 10.1016/j.scitotenv.2019.135011.
- Lin J, Huang C, Wen Y, Liu X. 2021. An assessment framework for improving protected areas based on morphological spatial pattern analysis and graph-based indicators. Ecol Indic. 130:108138. doi: 10.1016/j.ecolind.2021.108138.
- Lin J, Zeng Y, He Y. 2023. Spatial optimization with morphological spatial pattern analysis for green space conservation planning. Forests. 14(5):1031. doi: 10.3390/f14051031.
- Mallick J, Singh VP, Almesfer MK, Talukdar S, Alsubhi M, Ahmed M, Khan RA. 2022. Spatio-temporal analysis and simulation of land cover changes and their impacts on land surface temperature in urban agglomeration of Bisha Watershed, Saudi Arabia. Geocarto International. 37(25):7591–7617. doi: 10.1080/10106049.2021.1980616.
- Mansour S, Alahmadi M, Atkinson PM, Dewan A. 2022. Forecasting of built-up land expansion in a desert urban environment. Remote Sensing. 14(9):2037. doi: 10.3390/rs14092037.
- Mansour S, Al-Belushi M, Al-Awadhi T. 2020. Monitoring land use and land cover changes in the mountainous cities of Oman using GIS and CA-Markov modelling techniques. Land Use Policy. 91:104414. doi: 10.1016/j.landusepol.2019.104414.
- Meyer H, Reudenbach C, Wöllauer S, Nauss T. 2019. Importance of spatial predictor variable selection in machine learning applications–Moving from data reproduction to spatial prediction. Ecol Modell. 411:108815. doi: 10.1016/j.ecolmodel.2019.108815.
- Mshana GD, Mbilinyi B, Msigula PH. 2022. Characterization and quantification of urban expansion and impact on urban planning practice in Morogoro Municipality, Tanzania. JSRR. 28(8):57–71. doi: 10.9734/jsrr/2022/v28i830539.
- Myers SS, Gaffikin L, Golden CD, Ostfeld RS, Redford KH, Ricketts TH, Turner WR, Osofsky SA. 2013. Human health impacts of ecosystem alteration. Proc Natl Acad Sci U S A. 110(47):18753–18760. doi: 10.1073/pnas.1218656110.
- Ngie A. 2020. Thermal remote sensing of urban climates in South Africa through the mono-window algorithm. Int Arch Photogramm Remote Sens Spatial Inf Sci. XLII-3/W11:117–123. doi: 10.5194/isprs-archives-XLII-3-W11-117-2020.
- Ojeh VN, Balogun AA, Okhimamhe AA. 2016. Urban-rural temperature differences in Lagos. Climate. 4(2):29. doi: 10.3390/cli4020029.
- Pan J, Wang Y, Zhang Z. 2023. Identification and optimization of ecological network in arid inland river basin using MSPA and spatial syntax: a case study of Shule River Basin, NW China. Land. 12(2):292. doi: 10.3390/land12020292.
- Petsas P, Almpanidou V, Mazaris AD. 2021. Landscape connectivity analysis: new metrics that account for patch quality, neighbors’ attributes and robust connections. Landscape Ecol. 36(11):3153–3168. doi: 10.1007/s10980-021-01319-2.
- Qian W, Li X. 2023. A cold island connectivity and network perspective to mitigate the urban heat island effect. Sustainable Cities and Society. 94:104525. doi: 10.1016/j.scs.2023.104525.
- Rahman MT, Aldosary AS, Mortoja MG. 2017. Modeling future land cover changes and their effects on the land surface temperatures in the Saudi Arabian eastern coastal city of Dammam. Land. 6(2):36. doi: 10.3390/land6020036.
- Ramzan M, Saqib ZA, Hussain E, Khan JA, Nazir A, Dasti MYS, Ali S, Niazi NK. 2022. Remote sensing-based prediction of temporal changes in land surface temperature and land use-land cover (LULC) in urban environments. Land. 11(9):1610. doi: 10.3390/land11091610.
- Randers J. 13 June, 2012. 2052: A global forecast for the next forty years. Illustrated edition. Vermont, USA: Chelsea Green Publishing.
- Ren X, Mi Z, Georgopoulos PG. 2020. Comparison of Machine Learning and Land Use Regression for fine scale spatiotemporal estimation of ambient air pollution: modeling ozone concentrations across the contiguous United States. Environ Int. 142:105827. doi: 10.1016/j.envint.2020.105827.
- Sakketa TG. 2023. Urbanisation and rural development in sub-Saharan Africa: a review of pathways and impacts. Res Globalization. 6:100133. doi: 10.1016/j.resglo.2023.100133.
- Saleh MAE. 2002. A vision for directing future planning efforts: the case of villages of southwestern Saudi Arabia. Habitat Int. 26(1):51–72. doi: 10.1016/S0197-3975(01)00033-9.
- Salvati L. 2015. Assessing polycentric urban growth through a mathematic morphology approach. Int J Ecol Econ Stat. 36(1):44–56.
- Sarkodie SA, Owusu PA, Leirvik T. 2020. Global effect of urban sprawl, industrialization, trade and economic development on carbon dioxide emissions. Environ Res Lett. 15(3):034049. doi: 10.1088/1748-9326/ab7640.
- Scott AJ. 2012. A world in emergence: cities and regions in the 21st century. Cheltenham, United Kingdom: Edward Elgar Publishing.
- Sekertekin A, Bonafoni S. 2020. Land surface temperature retrieval from Landsat 5, 7, and 8 over rural areas: assessment of different retrieval algorithms and emissivity models and toolbox implementation. Remote Sensing. 12(2):294. doi: 10.3390/rs12020294.
- Shahmohamadi P, Che-Ani AI, Ramly A, Maulud KNA, Mohd-Nor MFI. 2010. Reducing urban heat island effects: a systematic review to achieve energy consumption balance. Int J Phys Sci. 5(6):626–636.
- Silibello C, Carlino G, Stafoggia M, Gariazzo C, Finardi S, Pepe N, Radice P, Forastiere F, Viegi G. 2021. Spatial-temporal prediction of ambient nitrogen dioxide and ozone levels over Italy using a Random Forest model for population exposure assessment. Air Qual Atmos Health. 14(6):817–829. doi: 10.1007/s11869-021-00981-4.
- Soille P, Vogt P. 2022. Morphological spatial pattern analysis: open source release. Int Arch Photogramm Remote Sens Spatial Inf Sci. XLVIII-4/W1-2022:427–433. doi: 10.5194/isprs-archives-XLVIII-4-W1-2022-427-2022.
- Somvanshi SS, Bhalla O, Kunwar P, Singh M, Singh P. 2020. Monitoring spatial LULC changes and its growth prediction based on statistical models and earth observation datasets of Gautam Budh Nagar, Uttar Pradesh, India. Environ Dev Sustain. 22(2):1073–1091. doi: 10.1007/s10668-018-0234-8.
- Song Y, Song X, Shao G. 2020. Effects of green space patterns on urban thermal environment at multiple spatial–temporal scales. Sustainability. 12(17):6850. doi: 10.3390/su12176850.
- Subasinghe S, Wang R, Simwanda M, Murayama Y, Vitanova LL. 2022. Neighborhood dynamics of urban expansion based on morphological spatial pattern analysis and geospatial techniques: a case study of the Colombo metropolitan area, Sri Lanka. Asian Geographer. 39(2):155–175. doi: 10.1080/10225706.2021.1903519.
- Swapan T, Singha P, Mahato S, Shahfahad, Pal S, Liou Y-A, Rahman A. (2020). Land-use land-cover classification by machine learning classifiers for satellite observations—a review. Remote Sensing, 12(7), 1135. doi: 10.3390/rs12071135.
- Tang Q, Li J, Tang T, Liao P, Wang D. 2022. Construction of a forest ecological network based on the forest ecological suitability index and the morphological spatial pattern method: a case study of Jindong forest farm in Hunan Province. Sustainability. 14(5):3082. doi: 10.3390/su14053082.
- Tao L, Chen Y, Chen F, Li H. 2023. Construction of green ecological network in Qingdao (Shandong, China) based on the combination of morphological spatial pattern analysis and biodiversity conservation function assessment. Sustainability. 15(24):16579. doi: 10.3390/su152416579.
- Terfa BK, Chen N, Zhang X, Niyogi D. 2020. Spatial configuration and extent explains the urban heat mitigation potential due to green spaces: analysis over Addis Ababa, Ethiopia. Remote Sensing. 12(18):2876. doi: 10.3390/rs12182876.
- Tiang DCF, Morris A, Bell M, Gibbins CN, Azhar B, Lechner AM. 2021. Ecological connectivity in fragmented agricultural landscapes and the importance of scattered trees and small patches. Ecol Process. 10(1):1–16. doi: 10.1186/s13717-021-00284-7.
- [UN] United Nations. 2023. World urbanization prospects. https://population.un.org/wup/
- Vujovic S, Haddad B, Karaky H, Sebaibi N, Boutouil M. 2021. Urban heat island: causes, consequences, and mitigation measures with emphasis on reflective and permeable pavements. CivilEng. 2(2):459–484. doi: 10.3390/civileng2020026.
- Wang H, Pei Z. 2020. Urban green corridors analysis for a rapid urbanization city exemplified in Gaoyou City, Jiangsu. Forests. 11(12):1374. doi: 10.3390/f11121374.
- Wang M, Li M, Zhang Z, Hu T, He G, Zhang Z, Wang G, Li H, Tan J, Liu X. 2023. Land surface temperature retrieval from Landsat 9 TIRS-2 data using radiance-based split-window algorithm. IEEE J Sel Top Appl Earth Observations Remote Sensing. 16:1100–1112. doi: 10.1109/JSTARS.2022.3232621.
- Wei J, Qian J, Tao Y, Hu F, Ou W. 2018. Evaluating spatial priority of urban green infrastructure for urban sustainability in areas of rapid urbanization: a case study of Pukou in China. Sustainability. 10(2):327. doi: 10.3390/su10020327.
- World Bank. 2023. Urban development overview. https://www.worldbank.org/en/home.
- Wu Y, Hou H, Wang R, Murayama Y, Wang L, Hu T. 2022. Effects of landscape patterns on the morphological evolution of surface urban heat island in Hangzhou during 2000–2020. Sustainable Cities Soc. 79:103717. doi: 10.1016/j.scs.2022.103717.
- Yang J, Shi Q, Menenti M, Wong MS, Wu Z, Zhao Q, Abbas S, Xu Y. 2021. Observing the impact of urban morphology and building geometry on thermal environment by high spatial resolution thermal images. Urban Clim. 39:100937. doi: 10.1016/j.uclim.2021.100937.
- Yang R, Bai Z, Shi Z. 2021. Linking morphological spatial pattern analysis and circuit theory to identify ecological security pattern in the loess plateau: taking Shuozhou City as an example. Land. 10(9):907. doi: 10.3390/land10090907.
- Zhang Y, Li X, Li M. 2023. Assessing spatio-temporal variation and associated factors of forest fragmentation from morphological spatial pattern analysis and geo-detector analyses: a case study of Xinyu City, Jiangxi Province of Eastern China. Forests. 14(12):2376. doi: 10.3390/f14122376.
- Zhang Y, Shen W, Li M, Lv Y. 2020. Assessing spatio-temporal changes in forest cover and fragmentation under urban expansion in Nanjing, eastern China, from long-term Landsat observations (1987–2017). Appl Geogr. 117:102190. doi: 10.1016/j.apgeog.2020.102190.
- Zhao SX, Guo NS, Li CLK, Smith C. 2017. Megacities, the world’s largest cities unleashed: major trends and dynamics in contemporary global urban development. World Dev. 98:257–289. doi: 10.1016/j.worlddev.2017.04.038.
- Zhou L, Hu F, Wang B, Wei C, Sun D, Wang S. 2022. Relationship between urban landscape structure and land surface temperature: spatial hierarchy and interaction effects. Sust Cities and Society. 80:103795. doi: 10.1016/j.scs.2022.103795.