
Abstract
Background and objectives: We have recently described a mechanistic action of autophagy on hematopoiesis in which autophagy sustains hematopoietic stem cell multilineage differentiation by direct targeting of intracellular Notch. However, the upstream signal that triggers autophagy to degrade Notch during hematopoiesis remains elusive.
Methods: Conditional autophagy-essential gene Atg7 knockout mouse model is used for identifying signals regulating autophagy in the promotion of hematopoiesis.
Results: We find here that generation of reactive oxygen species (ROS) is progressively increased during hematopoietic stem cell differentiation, and inhibition of ROS production was found to attenuate the differentiation of hematopoietic stem cells. In hematopoietic stem and progenitor cells (HSPCs) of wild-type mice, inhibition of ROS production downregulated autophagy activity but upregulated intracellular Notch and its downstream effectors. In contrast, in the HSPCs of autophagy fully defective mice, ROS inhibition did not alter myeloid differentiation, and hematopoietic stem cell differentiation to multi-lineages no longer responded to ROS inhibition.
Discussion: The ROS-regulating hematopoiesis is mitochondrial origin, and this action depends on intact autophagy machinery capable of degrading intracellular Notch.
Conclusion: ROS functions as an upstream signal in the autophagic promotion of hematopoietic stem cell differentiation.
Introduction
Hematopoiesis is essentially a differentiation program that promotes morphological, structural and functional changes in hematopoietic stem and progenitor cells (HSPCs) to produce functionally specified and mature blood cells. Autophagy is a cellular metabolic mechanism in which excessive or harmful cytoplasmic constituents are driven to the lysosome for degradation and recycling.Citation1 Autophagy was previously found to maintain hematopoietic stem cells (HSCs),Citation2,Citation3 and is essential for monocyte-macrophage differentiationCitation4 and vitamin D3-induced leukemia cell differentiation.Citation5 We have recently observed that autophagy regulates the cell cycle to maintain a proper quiescence of HSCsCitation6 and promotes megakaryopoiesis, megakaryocyte differentiation and thrombopoiesis.Citation7 We have further identified that autophagy machinery is differentially installed in hematopoietic hierarchy, suggesting more vulnerability of hematopoietic stem cells due to lack of alternative autophagy.Citation8 reactive oxygen species (ROS) is primarily produced by mitochondria under normal cellular metabolic processes, and serves as signaling molecules by regulating the activity of their oxidized targets and a number of cellular cascades including autophagy.Citation9 Autophagy in turn, is able to reduce oxidative damage.Citation10,Citation11 Unlike somatic cells or active cycling cells where ROS is constantly generated during cellular metabolism,Citation10,Citation12 stem cells reside in dominancy at a low metabolic rate, with less mitochondria than differentiated somatic cells, and rely more on anaerobic pathways for their energy supply.Citation13 Therefore, less ROS may be generated under physiological conditions in stem cells. More recently, we have found that autophagy promotes HSC differentiation and hematopoiesis by direct degrading intracellular Notch.Citation14 However, the upstream signal that triggers autophagy to drive the progression of hematopoiesis remains elusive. In this study, we used wild-type mice and a conditional autophagy-defective mouse model to study the role of ROS in autophagic regulation of hematopoiesis.
Experimental methods
Animals
Atg7f/f mice kindly provided by Dr. Komatsu were crossed Vav-Cre mice (from Jackson Laboratories, USA)Citation15 to obtain Atg7f/f:Vav-Cre mice.Citation6–Citation8,Citation14 Histological and biological analysis was performed for both male and female mice at 8–11 weeks of age. The mouse experiments were performed according to the protocols approved by Institutional Animal Use and Care Committee of Soochow University. In each experiment with mice, 6–10 mice for each treatment group were used.
Cell lines
Human leukemia cell lines NB4 and K562 obtained from ATCC were maintained in RPMI medium 1640 supplemented with 10% fetal bovine serum (Hyclone, USA).
MitoQ treatment
MitoQ was generously provided by Dr. Michael Murphy (Medical Research Council Dunn Human Nutrition Unit, Cambridge, UK).Citation16 K562 cells and lineage negative cells form wild-type mice were treated with 0.25 and 1 μM MitoQ, respectively.
Mitochondrial membrane potential analysis
JC-1 (Beyotime, USA) is a lipophilic cationic dye that enters the inner mitochondrial matrix in its monomeric form when the mitochondrial membrane is polarized. The JC-1 was prepared at the manufacturer's recommended concentration from stock solutions directly prior to use. The surface markers were stained prior to addition of JC-1 dye, which were stained for 25 minutes in a humidified incubator at 37°C, 5% CO2. Then the JC-1 stained LSK cells were analyzed on a BD Fluorescence-activated cell sorting (FACS)-Calibur flow cytometer.
Rapamycin treatment
Rapamycin was reconstituted in dimethyl sulfoxide (DMSO) or ethanol as a carrier at 10 mg/ml and diluted in 5% Tween-80 and 5% PEG-400. For in vivo treatment, mice received 4 mg/kg rapamycin by i.p. injection every other day; for in vitro treatment in premature hematopoietic cells, 1 μM of rapamycin was used.
N-acetyl-l-cysteine (NAC) treatment
For in vivo treatment, pan ROS scavenger NAC was delivered through feeding water at 1 mg/ml; for in vitro treatment of K562 cell line, 1 mM and 5 mM NAC was used.
Benzidine staining of erythroid cells
Erythroid differentiation was scored by the benzidine staining method for the determination of the percentage of hemoglobin-positive K562 cells induced by rapamycin. Briefly, cells were washed twice and then resuspended in 20 μl phosphate buffered saline (PBS). Ten microliter of benzidine solution (0.2% benzidine, 0.6% H2O2, 0.5 M acetic acid) was added and incubated for 2 minutes at room temperature in the dark. Benzidine-positive cells (blue-black staining) were quantitated by light microscopy. At least 100 cells were counted in triplicate for each condition.
Flow cytometry and cell sorting
To determine the effects of N-[N-(3,5-Difluorophenacetyl)-L-alanyl]-S-phenylglycine t-butyl Ester (DAPT) or rapamycin treatment on the cell differentiation, human leukemia cells were pelleted by centrifugation for 5 minutes at 400 × g. The cells were then washed twice in PBS before incubation with FITC-conjugated anti-CD11b antibody for 30 minutes, and analyzed by the use of a FACS Calibur flow cytometer (BD Biosciences, USA). Mouse bone marrow cells were isolated from the iliac crests, tibiae, and femurs of wild-type and Atg7 knockout mice. Linage negative cells were purified by magnetic-activated cell sorting, followed by cell sorting for isolation of pluripotent, multipotent, oligopotent hematopoietic stem cells with BD FACS AriaIII cell sorter. For the activated-Notch 1 analysis, K562 cells were fixed with fix/permealization buffer (ADG), and then incubate with anti-actived-Notch1 antibody and PE-conjugated secondary antibody (eBiosciences, USA), respectively for 30 minutes at room temperature. The samples were analyzed by flow cytometry after the removal of unbound antibodies. In addition, mouse LSK and LK cells were sorted by costaining with anti-Sca-1 and anti-c-Kit. Lineage negative cells were isolated with lineage depletion kit (Miltenyi Biotech, USA).
Measurement of ROS
ROS was measured by DCF-DA (Invitrogen, USA) staining at 10 μM for 15 minutes at 37°C after staining of surface markers, according to the manufacturer's manual. For MitoSox Red-based flow cytometric detection of mitochondrial superoxide, lineage negative cells were isolated with lineage depletion kit (Miltenyi Biotec, USA). Cells were stained with surface marker and then incubated with 5 μM MitoSox Red superoxide indicator (Invitrogen, USA) for 30 minutes and washed before analyzed on a FACS Calibur (BD, USA).
Colony forming cell (CFC) assay
Lineage negative cells were first isolated from wild-type, Atg7f/+:Vav-Cre and Atg7f/f:Vav-Cre mice. Cells were then seeded in methylcellulose (Stem Cell, Canada) with DMSO (carrier), 10 μM DAPT at a density of 3000 cells per dish, and cultured for 7 days. At the end, cells were counted under light microscopy. The graph shows the mean number of colonies counted on day 7. *P < 0.05; **P < 0.01.
Statistical analysis
Statistical analyses were performed with a two-tailed unpaired t-test. P < 0.05 was considered statistically significant. *P < 0.05; **P < 0.01.
Results and discussion
Mitochondrial ROS promotes hematopoietic stem cell differentiation but attenuates Notch signaling
The connection between ROS and autophagy in stem cells remains largely obscure. We found that ROS generation measured with flow cytometry is progressively increased during the progression of in vivo hematopoietic stem cell differentiation from LSK to Lin+ cells (Fig. A), similar to the pattern we recently observed in which autophagy activity is progressively upregulated in stem cell differentiation whilst Notch signaling was simultaneously downregulated.Citation14 We also noticed that mitochondrial membrane potential is progressively reduced in the progression of hematopoietic stem cell differentiation (Fig. B), which is in agreement with the increase in total ROS production (Fig. A).
Figure 1 Mitochondrial ROS promotes hematopoietic stem cell differentiation but attenuates Notch signaling. (A) ROS generation is progressively increased during hematopoietic stem cell differentiation (LSK, LK, Lin- and Lin+) measured by flow cytometry. **P < 0.01; ns, P > 0.05. (B) Overlays of mitochondrial membrane potential stained with JC-1 in WT mice LSK, LK, Lin- and Lin+ cells. (C) Indicated cells were stained with 5 μM MitoSOX Red, specific for mitochondrial O2−·, for 15 minutes and then analyzed flow cytometry. Percentage of MitoSox Red positive cells was quantified. **P < 0.01. (D, E) NAC and MitoQ inhibited rapamycin-induced differentiation measured by benzidine staining. Percentage of benzidine-positive cells was quantified (right panel). **P < 0.01; ns, P > 0.05. (F) Comparison of in vitro CFU-C in control and MitoQ treated hematopoietic stem and progenitor cells (LSK) and counted on day 7. The numbers of colonies were quantified (right panel). *P < 0.05. (G) Blood routine examination of peripheral blood form control and NAC treated wild-type mice. *P < 0.05. (H) Cytometric measurement of intracellular Notch protein level in LSK cells isolated from wild-type mice treated with or without NAC. *P < 0.05. (I) qRT-PCR detection of the expression for Notch target genes Hey2 and Cyclin D1 in LSK cells isolated from NAC treated wild-type mice. *P < 0.05; **P < 0.01.
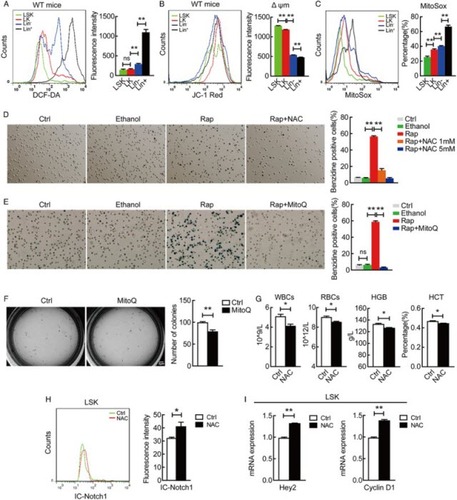
To confirm whether mitochondrial ROS drives hematopoietic stem cell differentiation, we first measured ROS generated in mitochondria by using MitoSox detection, and the result showed a progressive increase in mitochondrial ROS production during hematopoiesis (Fig. C), a pattern similar to the increase in total ROS during the progression of hematopoietic stem cell differentiation (Fig. A). We thus evaluated whether mitochondrial ROS triggers autophagy to drive stem cell differentiation by targeting Notch signaling. Inhibition of total ROS by NAC, a pan ROS scavenger, or inhibition of mitochondrial ROS by MitoQ,Citation16 a mitochondria-targeted antioxidant, inhibited its differentiation in premature hematopoietic cells evidenced by enhanced benzidine staining (Fig. D, E). More importantly, inhibition of mitochondrial ROS generation by MitoQ attenuated the ability in differentiation of LSK hematopoietic stem cells as evidenced by CFC assay data (Fig. F). Consistently, the in vivo inhibition of ROS generation with NAC inhibited terminal hematopoietic cell differentiation (Fig. G), mimicking the multilineage differentiation failure that we recently observed when autophagy is conditionally defective in mouse hematopoietic system.Citation8,Citation14 Furthermore, examination of intracellular Notch protein and its target genes showed that inhibition of ROS generation with NAC caused upregulated Notch signaling (Fig. H, I). These data suggest that ROS, in particular mitochondrial ROS, promotes hematopoietic stem cell differentiation but attenuates Notch signaling.
ROS regulation of hematopoietic stem cell differentiation depends on autophagy pathway
Flow cytometric analysis indicates that the ex vivo activation of autophagy with rapamycin, a strong autophagy activator, reduced the ROS generation in mouse HSPCs (Fig. A), and the conditional autophagy defect due to Atg7 deletion elevated the ROS level in LSK, LK and Lin+ cells in hematopoietic hierarchy (Fig. B), suggesting a role of autophagy in limiting ROS generation during the hematopoietic stem cell differentiation. However, the inhibition of ROS generation by the NAC in LSK, but not LK or Lin+ cells, of the Atg7−/− mice failed to decrease the ROS level (Fig. B, left panel), suggesting that stem cells and early progenitors are more dependent on autophagy for reducing ROS generation through degradation of damaged or excessive mitochondria than differentiated or somatic cells. These data confirm the role of autophagy in reducing ROS generation by degrading damaged or excessive mitochondria, in particular in HSPCs.
Figure 2 ROS regulates hematopoietic stem cell differentiation in an autophagy-dependent manner. (A) Rapamycin reduced ROS level in wild-type mouse LSK cells, measured by DCF-DA staining. Results were quantified (lower panel). **P < 0.01. (B) Autophagy defect in different stages (LSK, LK and Lin+) of hematopoietic hierarchy caused elevated ROS generation and different response to NAC treatment. *P < 0.05; **, P < 0.01; ns, P > 0.05. (C) qRT-PCR detection of the expression for autophagy-essential genes in LSK cells isolated from NAC treated or not treated wild-type mice. *P < 0.05; **P < 0.01. (D) NAC reduced the percentage of CD11b and Ly6G-Ly6C bone marrow cells in wild-type, not Atg7−/− mice, measured by flow cytometry. **P < 0.01, *P < 0.05. (E) Autophagy defect impaired multilineage differentiation and caused a failure in response to NAC treatment. Wild-type and Atg7−/−mice were treated with or without NAC, and peripheral blood was counted **P < 0.01; ns, P > 0.05. All experiments were repeated at least three times. n ≥ 5.
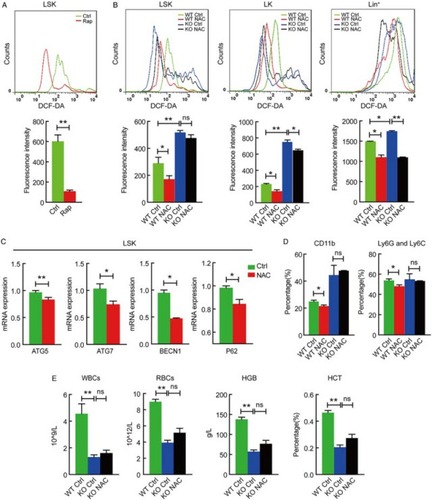
On the other hand, however, ROS was found to positively regulate hematopoietic stem cell differentiation and negatively regulate Notch signaling (Fig. ), which is in accordance with the upregulation of autophagy activity we recently described.Citation14 To examine whether ROS is the trigger that regulates hematopoietic stem cell differentiation via autophagy pathway, we inhibited ROS generation using NAC in the mouse models. The results showed that in wild-type mice, the inhibition of ROS generation by NAC significantly caused the downregulation of a group of autophagy-essential genes encoding Atg5, Atg7, Becn1 and p62 in LSK HSPCs (Fig. C). In autophagy-defective mice (Atg7−/−), however, NAC treatments did not alter Notch target gene expression (data not shown). Similarly, inhibition of ROS generation by NAC administration reduced myeloid differentiation (CD11b+ cells) including granulocyte differentiation (Ly6G-Ly6C) in wild-type mice, but NAC was unable to inhibit myeloid differentiation in Atg7−/− mice (Fig. D), suggesting that ROS regulates hematopoietic differentiation via autophagy pathway. Furthermore, hematopoietic multilineage differentiation in the autophagy-defective mice no longer responded to ROS inhibition (Fig. E), as opposed to the response to NAC in wild-type mice (Fig. G). This further reflected an autophagy-dependent differentiation of hematopoietic stem cells triggered by ROS as an upstream signal for autophagy.
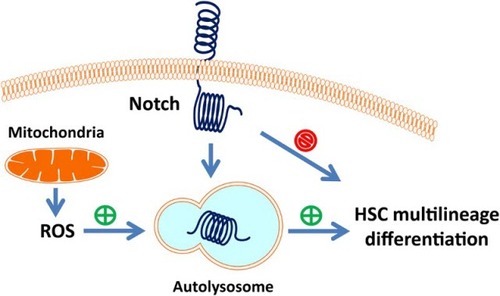
In conclusion, our data suggest that mitochondrial ROS generated in metabolic processes triggers autophagy to downregulate intracellular Notch, thereby promoting hematopoietic stem cell differentiation. An illustration representing the model of ROS regulation of HSC differentiation through *autophagy–Notch axis is shown in Fig. .
Figure 3 A cartoon illustrating ROS regulation of HSC differentiation. ROS generated in the mitochondria acts as an upstream signal to activate autophagy, and autophagy in turn targets intracellular Notch, thereby relieving its suppression on hematopoietic stem cell multilineage differentiation.
Disclaimer statements
Contributors YC and JW designed the study. CY, YF, JC, XL, NY and SZ conducted the experiment. YC and JW analyzed the data and wrote the manuscript. All authors read and approved the final manuscript.
Funding This work was supported by grants from National Science Foundation of China (No. 31071258, No. 81272336, No. 31271526 and No. 81570126 to J.W.), National Basic Research Program of China, The Ministry of Science and Technology of China (No. 2011CB512101), and a project funded by the Priority Academic Program Development of Jiangsu Higher Education Institutions.
Conflict of interest The authors declare that they have no competing interests.
Ethics approval Experiment with mice is approved by the authors' institution.
Related Research Data
References
- Mizushima N, Levine B. Autophagy in mammalian development and differentiation. Nat Cell Biol. 2010;12:823–30. doi: 10.1038/ncb0910-823
- Mortensen M, Soilleux EJ, Djordjevic G, Tripp R, Lutteropp M, Sadighi-Akha E, et al. The autophagy protein atg7 is essential for hematopoietic stem cell maintenance. J Exp Med. 2011;208:455–67. doi: 10.1084/jem.20101145
- Liu F, Lee JY, Wei H, Tanbe O, Engel JD, Morrison SJ. FIP200 is required for the cell-autonomous maintenance of fetal hematopoietic stem cells. Blood. 2010;116:4806–14. doi: 10.1182/blood-2010-06-288589
- Zhang Y, Morgan MJ, Chen K, Choksi S, Liu E. Induction of autophagy is essential for monocyte-macrophage differentiation. Blood. 2012;119:2895–905. doi: 10.1182/blood-2011-08-372383
- Wang J, Lian H, Zhao Y, Kauss MA, Spindel S, Wang J. Vitamin D3 induces autophagy of human myeloid leukemia cells. J Biol Chem. 2008;283:25596–605. doi: 10.1074/jbc.M801716200
- Cao Y, Zhang A, Cai J, Yuan N, Lin W, Liu S, et al. Autophagy regulates hematopoietic stem and progenitor cell cycle in a nutrient-dependent manner. Exp Hematol. 2015;43:229–42. doi: 10.1016/j.exphem.2014.11.002
- Cao Y, Cai J, Zhang S, Yuan N, Li X, Fang F, et al. Loss of autophagy leads to failure in megakaryopoiesis, megakaryocyte differentiation and thrombopoiesis. Exp Hematol. 2015;43:488–94. doi: 10.1016/j.exphem.2015.01.001
- Cao Y, Zhang S, Yuan N, Wang J, Li X, Xu F, et al. Hierarchal autophagic divergence of hematopoietic system. J Biol Chem. 2015;290:23050–63. doi: 10.1074/jbc.M115.650028
- Scherz-Shouval R, Shvets E, Fass E, Shorer H, Gil L, Elazar E. Reactive oxygen species are essential for autophagy and specifically regulate the activity of Atg4. EMBO J. 2007;26:1749–60. doi: 10.1038/sj.emboj.7601623
- Scherz-Shouval R, Elazar Z. Regulation of autophagy by ROS: physiology and pathology. Trends Biochem Sci. 2011;6:30–8. doi: 10.1016/j.tibs.2010.07.007
- Koch U, Lehal R, Radtke F. Stem cells living with a Notch. Development. 2013;140:689–704. doi: 10.1242/dev.080614
- Sena LA, Chandel NS. Physiological roles of mitochondrial reactive oxygen species. Mol Cell. 2012;48:158–67. doi: 10.1016/j.molcel.2012.09.025
- Guan JL, Simon AK, Prescott M, Menendez JA, Liu F, Wang F. et al. Autophagy in stem cells. Autophagy. 2013;9:830–49. doi: 10.4161/auto.24132
- Cao Y, Cai J, Zhang S, Yuan N, Fang Y, Wang Z, et al. Autophagy sustains hematopoiesis via targeting Notch. Stem Cells Dev. 2015;24(22):2660–73. doi:10.1089/scd.2015.0176.
- Komatsu M, Waguri S, Ueno T, Iwata J, Murata S, Tanida I, et al. Impairment of starvation-induced and constitutive autophagy in atg7-deficiennt mice. J Cell Biol. 2005;169:425–34. doi: 10.1083/jcb.200412022
- Kelso GF, Porteous CM, Coulter CV, Hughes G, Porteous WK, Ledgerwood EC, et al. Selective targeting of a redox-active ubiquinone to mitochondria within cells. J Biol Chem. 2001;276:4588–96. doi: 10.1074/jbc.M009093200