
Abstract
Objective: Thioredoxin-1 (TXN) is a key element in the elimination of reactive oxygen species as well as activation of tumor suppressor genes and DNA repair enzymes. Several studies showed that TXN was over expressed in solid tumors and this was correlated to poorer prognosis. However, TXN expression has been insufficiently studied, particularly in newly diagnosed adult acute leukemia.
Methods: This study was designed to evaluate the gene expression of TXN in acute myeloid leukemia (AML) and acute lymphoid leukemia (ALL) adult patients and to investigate its association with oxidative DNA damage. The expression of TXN was analyzed using quantitative reverse transcriptase-polymerase chain reaction while oxidative DNA damage was evaluated by measuring serum 8-hydroxy-2-deoxyguanosine (8-OHdG) by enzyme-linked immunosorbent assay and strand breaks by the comet assay.
Results: We found that TXN was under expressed in both AML and ALL groups (P < 0.001 for both) as compared to the control group. Also TXN expression level was negatively correlated with serum 8-OHdG and tail moment in both AML (P = 0.042 and 0.047, respectively) and ALL (P < 0.001 and P = 0.02, respectively) while it showed no correlation with treatment outcome in either groups.
Discussion: This study suggests that TXN expression is hindered in adult acute leukemia which augments oxidative DNA damage and hence mutagenesis.
Conclusion: This study provides a new insight into the pathogenesis of acute leukemia and suggests TXN as a new screening test for the risk for acute leukemia.
Introduction
Leukemia, the serious hematologic malignancy, accounts for around 300 000 new cases each year representing 2.8% of all new cancer cases and 222 000 deaths. The high ratio of deaths/cases (74%) reflects the aggressiveness and poor prognosis of leukemia in many countries due to the lack of complex treatment regimes. There is a significant geographic variation in mortality rates due to better survival (and hence lower mortality) in developed countries where survival rate reaches up to twice the rate in developing countries; however, the geographic variation in the range of incidence rates is little.Citation1,Citation2 The accumulation of oxidative DNA damage is one of the major contributors to malignant transformation in acute leukemia either through disrepair or incomplete repair of DNA specially if combined with a deficient apoptotic pathway.Citation3 Oxidative stress which is the bio-molecular damage caused by attack of reactive oxygen species (ROS) upon the components of the cell as a result of the imbalance between production of ROS and their elimination mechanisms known as antioxidants.Citation4A variety of specific and efficient antioxidants exist to control the balance between production and removal of ROS in order to protect cells from free radicals. Antioxidants may be endogenous or exogenous, enzymatic, or non-enzymatic. Prolonged environmental stress results in prolonged ROS production resulting in significant cellular structural and functional damage that may induce somatic mutations and malignant transformation.Citation5 The role of oxidative stress in carcinogenesis is controversial. ROS can act either anti-carcinogenically by arresting cell-cycle or promoting apoptosis or necrosis, and inhibiting angiogenesis or, conversely, pro-carcinogenically by to promoting proliferation, invasiveness, angiogenesis, and metastasis as well as suppressing apoptosis.Citation6
Human cellular components and DNA are constantly exposed to oxidative attacksCitation7 leading to many lesions. One of these lesions is 8-hydroxyguanosine which is mediated by ·OH attack and its hydrolysis product 8-hydroxy-2-deoxyguanosine (8-OHdG) that is considered as the most common endogenous DNA base modification.Citation8 The 8-OHdG is used as a fingerprint of radical DNA attack and has been implicated in cancer progression. For example, in breast cancer, 8-OHdG has been reported to be increased 8- to 17-fold in breast primary tumors compared with non-malignant breast tissue.Citation9 In addition, ROS can activate specific signaling pathways that contribute to tumor development through the regulation of cellular proliferation, angiogenesis, and metastasis.Citation10 For example, ROS enhance melanoma cells trans-endothelial migration during intravasation through the increasing expression of thioredoxin-interacting protein (TXNIP) and inhibition of TXN expression.Citation11 Also, a genetic influence on 8-OHdG production was seen for polymorphisms in thioredoxin reductase 1 (TXNRD1) and 2 (TXNRD2).Citation12
The thioredoxin (TRX) system is one of the major antioxidant systems. It is integral to maintaining the intracellular redox state. TXN is a major member of the thioredoxin system. It is a low-molecular-weight (10–12 kDa) cellular redox protein located in the nucleus and cytoplasm. It was previously identified as an autocrine growth factor in transformed lymphoid cells.Citation13 It has several functions including the regulation of the activity of various antioxidant enzymes.Citation14 Its structure includes a conserved Cys-Gly-Pro-Cys redox catalytic site.Citation15 Thioredoxin reductase (TXNR) transfers reducing equivalents from NADPH to TXN and reduces the active site disulfide of oxidized TXN (TXN-S2) to a dithiol (SH2). In mammals, both TXN and TXNR are expressed as different isoforms. They are predominantly expressed in the cytosol.Citation16 TXNIP binds TXN and inhibits its disulfide reductase activity.Citation17 The TXN coding gene is a protooncogene that stimulates tumor growth and inhibits apoptosis whether spontaneous or drug induced.Citation18 Overexpression of the TXN gene is also associated with both hypoxia-induced factor-1α (HIF-1α) levels and HIF-1 transactivation gene overexpression in cancer cells,Citation19 resulting in increased vascular endothelial growth factor production and excessive tumor angiogenesis.Citation20 In addition, overexpression of TXN has been correlated with aggressive tumor growth, and decreased survival in patients with solid tumors.Citation21 It is thought that TXN has an important role in maintaining the transformed phenotype of some human cancers as well as their resistance to chemotherapy and is thus a promising target for cancer drug development. Also, TXNR was up-regulated in many cancer cells and may contribute to chemoresistance.Citation22
TXN overexpression has been implicated in increased tumor growth in various solid tumor types and model systems. However, there is a lack of supporting experimental evidence about the pathophysiological and therapeutic significance of the TXN family in different types of acute leukemia. Recent preclinical in vitro data and clinical data in solid tumors strongly support that the development of drugs acting via the TXN system is a promising route for cancer therapy.Citation23
Subjects and methods
Subjects
From May 2013 to June 2014, a total of 55 patients with acute leukemia were recruited from Clinical Hematology and Stem Cell Transplantation Unit, Ain Shams University Hospitals (ASUH), Cairo, Egypt (30 acute myeloid leukemia (AML) patients, 15 males and 15 females with the mean age of 45 years and 25 acute lymphoid leukemia (ALL) patients, 15 males and 10 females with the mean age of 34 years). The diagnosis was made based on the morphologic findings from Wright-Giemsa-stained smears of bone marrow aspirates and immune-phenotyping analyses of leukemic cells. Written informed consent was obtained from every patient with their personal signature. The consent informed the patients that their blood samples will be used for laboratory analysis for medical research purpose with a brief description for the aim of the study. In April 2013, the protocol for this study was approved by the Committee of Medical and Pharmaceutical Ethics of ASUH in accordance with the Helsinki Declaration of 1975, as revised in 2008. The study also included 20 healthy age- and sex-matched volunteers who served as healthy control.
Blood sampling
Peripheral blood (PB) samples were withdrawn from the patients. The PB samples were divided into two aliquots. The first aliquot of blood was collected on vacutainer tube containing ethylenediamine tetra-acetic acid, disodium salt (final concentration of 1.5 mg/ml) (Na2 EDTA), which was further divided into other two aliquots for RNA isolation and comet assay. The second aliquot was collected on a plain vacutainer tube for the assay of serum 8-OHdG.
Methods
RNA isolation and real-time quantitative RT-PCR
Total RNA was extracted from whole blood using the QIAamp RNA blood mini kit (Qiagen, Hilden, Germany) according to the manufacturer's protocol and stored at −80°C until use. After treatment with DNA-free (Ambion, Austin, TX, USA) to remove chromosomal DNA, the mRNA expression levels of TXN and glyceraldehyde-3-phosphate dehydrogenase (GAPDH) were measured by quantitative reverse transcriptase-polymerase chain reaction (RT-PCR) using the Stratagene MX 3000P thermal cycler (Stratagene, CA, USA). The quantitative RT-PCR amplification was performed using the one-step Quantifast Probe Assay for TXN (Cat. no.:QF00478121) and for GAPDH (Cat. no.:QF00531132), (Qiagen, Hilden, Germany). All reactions were performed using 25 μl samples containing 50 ng RNA. The reaction protocol used involved heating for 10 minutes at 50°C, followed by 5 minutes at 95°C followed by 35 cycles of amplification (10 seconds at 95°C and 30 seconds at 60°C). Analysis was performed using the MxPro-Mx3000P software (Stratagene). The expression levels of the TXN gene in unknown samples were normalized and analyzed by the 2−ΔΔCt method, where ΔΔCt = (CtTXN–CtGAPDH)sample – (CtTXN – CtGAPDH)calibrator. the average ΔΔCt (CtTXN – CtGAPDH) from control samples combined was defined as 1.0, as calibrator. We previously determined that the amplification efficiencies for TXN and GAPDH showed the same slopes. A negative control without template was included in each experiment.
Comet assay
The alkaline comet assay (comet assay kit, Trevigen, MD, USA) was applied under yellow light to avoid DNA damage that may arise from fluorescent white light as outlined. Equal volumes of blood diluted with PBS and 1% low melting point agarose (LMPA) were layered on slides pre-coated with normal melting point agarose, covered with a coverslip and placed on a slide tray on ice packs for 5 minutes till agarose hardened. Cover slip was then removed and a third layer of LMPA was added to the slide. Cover slip was then replaced and the slide was returned to the slide tray for another 5 minutes until the agarose layer hardened. Viability test was performed then slides were incubated for 2 hours at 4°C in a freshly prepared lysis solution (comet assay kit) to remove membranes and histones from the DNA. Nucleoids were then treated with alkaline buffer (pH 13, T 4°C, comet assay kit) for 20 minutes to allow denaturation and DNA unwinding. Electrophoresis in an alkaline buffer (pH 13, T 4°C, comet assay kit) for 30 minutes allowed migration of loops of DNA whose supercoiling was relaxed by a strand break to migrate towards the anode. Slides were then soaked in a neutralization buffer (Tris base 400 mM pH 7.5) for 10 minutes, washed twice in distilled H2O for 10 minutes and finally air-dried to bring cells into a single plane to facilitate observation. After staining with 1× ethidium bromide, single nucleoid migration profiles were analyzed with fluorescence microscopy (Leica DMRXA) connected to a camera (Leica DFC340 FX) and a computerized image analysis system (COMET IV software, Perceptive). The software computed all major measurement parameters, including (1) tail length: distance from center of nucleoid mass to distal tail end, (2) tail intensity (TI): relative fluorescence intensity of comet tail, a measure of percentage of DNA in the tail, and (3) tail moment (TM): essentially the product of tail length and TI. For our purposes, TM was selected to measure DNA fragmentation.
Determination of serum 8-OHdG by ELISA
Serum 8-OHdG levels were determined by the enzyme-linked immunosorbent assay (ELISA) using commercially available kit: human 8-OHdG immunoassay (Glory Science, TX, USA). All ELISA procedures were done by the Hyprep automated ELISA system (Hyperion, Inc., Miami, FL, USA) according to the manufacturer's instructions.
Statistical analysis
Differences in expression levels of TXN, sr-8-OHdG, and TM between different groups were analyzed using the Mann–Whitney U test and the Kruskall–Wallis test. Correlation of TXN expression level with sr-8-OHdG and TM in different groups was analyzed using the Spearman test. Statistical significance was accepted when the P values were less than 0.05. All of the analyses were performed by the SPSS 17.0 software.
Results
Clinical characteristics of the studied groups are summarized in Table .
Table 1 Clinical characteristics of the studied groups
TXN was under expressed in AML and ALL groups as compared to the control group
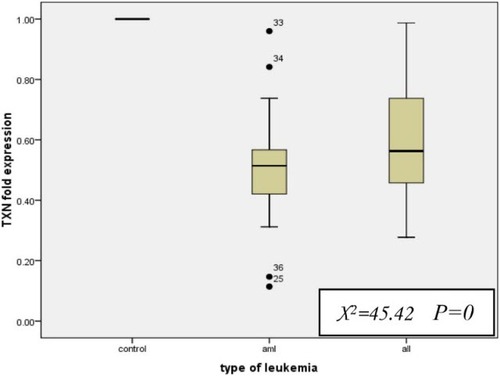
For AML patients, the median fold expression level of TXN was 0.514 (range, 0.11–0.96), whereas for ALL patients, it was 0.563 (range, 0.28–0.99) which is significantly lower than normal expression level indicating under expression (P < 0.001 for both AML and ALL). Of note, there was no significant difference between the fold expression levels of TXN in AML and ALL groups (P = 0.146; Fig. ).
Figure 1 TXN fold expression level in AML and ALL with respect to the control group. All values are presented in box plots showing the median and 90th percentiles of TM. Maximum and minimum values are represented by bars. Statistical analysis was performed using the Kruskall–Wallis test and Mann–Whitney U test
Serum 8-OHdG was significantly higher in AML and ALL groups as compared to the control group
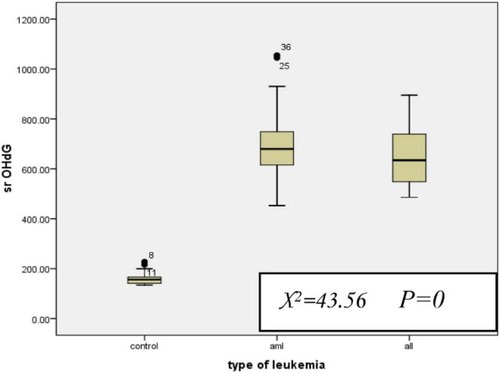
For AML patients, the median serum 8-OHdG level was 679.5 (range, 452.73–1055) and for ALL patients, it was 634.2 (range, 486.15–895) which was significantly higher than the control group (median = 155.9, range = 134.5–227.5) (P < 0.001 for both), while there was no significant difference between AML and ALL groups (Fig. ).
Figure 2 Serum 8-OHdG level in AML and ALL with respect to the control group. All values are presented in box plots showing the median and 90th percentiles of TM. Maximum and minimum values are represented by bars. Statistical analysis was performed using the Kruskall–Wallis test and Mann–Whitney U test
The TM was significantly higher in AML and ALL groups as compared to the control group and in AML group compared to ALL group
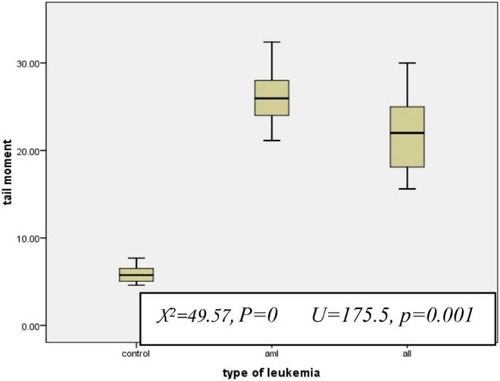
For AML patients, the median TM was 25.9 (range, 21.14–32.4) and for ALL patients, it was 22 (range, 15.6–30) which was significantly higher than the control group (median = 5.75, range = 4.6–7.7) (P < 0.001 for both). Also, TM in the AML group was significantly higher than the ALL group (P < 0.001; Fig. ).
Figure 3 TM in AML and ALL with respect to the control group. All values are presented in box plots showing the median and 90th percentiles of TM. Maximum and minimum values are represented by bars. Statistical analysis was performed using the Kruskall–Wallis test and Mann–Whitney U test.
Serum 8-OHdG and TM were positively correlated in both AML and ALL groups
Our results showed strong positive correlation between serum 8-OHdG and TM in AML and ALL groups (P = 0 and P = 0.002, respectively; Fig. A and B)
Figure 4 Correlation of serum 8-OHdG and TM: (A) in AML, (B) in ALL. Serum 8-OHdG and TM show strong positive correlation in both AML and ALL. The correlation is presented by scatter plot. Statistical analysis was performed using the Spearman test.
Expression levels of TXN were negatively correlated with serum 8-OHdG and TM in AML and ALL groups
The TXN fold expression showed strong negative correlation with serum 8-OHdG in both AML and ALL groups (P = 0.042 and P = 0, respectively; Fig. A and B). Similar results were shown with TM (P = 0.047 and 0.02, respectively; Fig. A and B)
Figure 5 Correlation of TXN fold expression and serum 8-OHdG in AML (A) and ALL (B). TXN fold expression and serum 8-OHdG show strong negative correlation in both AML and ALL. The correlation is presented by scatter plot. Statistical analysis was performed using the Spearman test
Figure 6 Correlation of TXN fold expression and serum TM in AML (A) and ALL (B). TXN fold expression and TM show strong negative correlation in both AML and ALL. The correlation is presented by scatter plot. Statistical analysis was performed using the Spearman test.
Expression levels of TXN were not correlated with EFS or OS in AML and ALL groups
The TXN fold expression showed no correlation with event-free survival (EFS) or overall survival (OS) in both AML (P = 0.74 and 0.28, respectively) and ALL (P = 0.68 and 0.89, respectively).
Discussion
For several decades, now, many researchers worldwide dedicated their research to achieve early diagnosis and treatment of malignancies. The discovery of novel diagnostic and therapeutic strategies for cancer is the only way to shift malignancy from a non-curable to a curable disease. Although the understanding of the mechanisms of carcinogenesis by oxidative stress has advanced greatly in the last two decades, future studies will be necessary to identify conditions that better predict the risk of transformation into an active disease that requires treatment.Citation24
Since its definition by Sies et al.,Citation25 oxidative stress was implicated in the pathogenesis of many diseases including cancer.Citation26 High rates of both lipid peroxidation and DNA base lesions that result in genomic instability, such as strand breaks, base modifications, and DNA–protein cross linkages, have been found in the majority of cancerous tissues. Oxidative DNA damage plays an essential role in the initiation of carcinogenesis and malignant transformation.Citation27 Generally, in response to increased ROS levels, cellular antioxidant molecules such as thioredoxin are upregulated to counteract their detrimental effect. However, cancer cells take advantage of upregulated antioxidant molecules to protect themselves against ROS-induced cell damage.Citation26 Oxidative stress was found to closely precede cancer and is responsible for the molecular alterations underlying the pathogenesis of cancer and as a result the byproducts of oxidative stress have been proposed to be promising clinical markers of cancer.Citation28 Based on the previous work, chronic lymphoid leukemia cells were found to accumulate ROS and reactive nitrogen species (RNS) due to deficiency in cellular antioxidants, including TXN.Citation29 Previously, TXN was found to be over expressed in solid tumors, and this was correlated with tumor aggressiveness and poorer prognosis.Citation21 However, TXN expression was not sufficiently studied in acute leukemia and we claim that this is the first study studying the fold expression of TXN in Egyptian patients newly diagnosed with acute leukemia.
In our study, we found that TXN was surprisingly under expressed in both AML and ALL; however, there was no significant difference between the two groups. This indicates that the pathogenesis of acute leukemia is quite different from other solid tumors where antioxidant molecules including TXN have been shown to be up-regulated, correlating with increased tumor proliferation, survival as well as chemoresistance.Citation30 This finding gives a new insight into the pathogenesis of acute leukemia. Being critical redox regulator, TXN is involved in a number of redox signaling pathways by activating numerous redox sensitive transcription factors that are essential for various cellular processes. TXN is usually present in the cytoplasm, but under certain circumstances it is translocated to the nucleus where it activates redox sensitive transcription factors. Several studies have reported the involvement of TXN in regulating the activity of the tumor suppressor gene p53 by enhancing the sequence-specific DNA-binding activity of p53.Citation31 Also, TXN has also been shown to be positively correlated with p53-induced DNA repair in breast cancer.Citation32 In addition, previous studies have shown that TXN is implicated in the regulation of the activity of phosphatase and tension homolog gene (PTEN) which is a redox sensitive tumor suppressor protein that is inactivated by H2O2-induced ROS generation. TXN binds to an inactive oxidized form of PTEN and reduce it, leading to the activation of PTEN.Citation33 From the previous, we can conclude that under expression of TXN in the leucocytes may result in inactivation of both p53 and PTEN allowing uncontrolled cell growth and proliferation giving rise finally to the development of acute leukemia which can be regarded as a novel mechanism of the pathogenesis of acute leukemia which requires further investigation and research to be confirmed. However, these results are quite different from the results of Zhou et al.Citation34 who found that TXN was overexpressed in relapsed AML. This difference might be attributed to the difference in the study population in both studies concerning the status of AML (de novo or relapsed) as well as the ethnic differences.
Members of the TRX system regulate apoptosis through a wide variety of mechanisms. TRX proteins have antiapoptotic effect by scavenging intracellular ROS through the dithiol at the active site.Citation35 Also, they interact with apoptosis signal-regulating kinase 1. TXNIP is a growth suppressor and its expression is suppressed in human T-cell leukemia virus type-1 transformed cells.Citation36 Up-regulation of TXNIP caused an increase in ROS production and induced apoptosis in AML in vitro and in vivo.Citation37 In light of these findings, the under expression of TXN is supposed to induce apoptosis. However, such a claim requires performing apoptosis assays in order to confirm or deny it and clarify the possible effects of TXN under expression on the apoptotic machinery and the resulting consequences regarding prognosis, response to chemotherapy and treatment outcome.
Another interesting finding in our study is that serum 8-OHdG was significantly higher in both AML and ALL groups than the control group and that TXN fold expression was negatively correlated with serum 8-OHdG in both AML and ALL. 8-OHdG is produced by oxidative action of ROS and RNS, including hydroxyl radical and peroxynitrite on DNA. TXN provides the electrons to thiol-dependent peroxidases (peroxiredoxins) to remove ROS and RNS rapidly in order to protect DNA from ROS and RNS attacks which causes the generation of 8-OHdG. Also, TXN is involved in DNA and protein repair by reducing ribonucleotide reductase, methionine sulfoxide reductases, and regulating the activity of many redox sensitive transcription factors.Citation15 Thus, under expression of the TXN gene and the subsequent TXN deficiency results in the accumulation of ROS and RNS, including hydroxyl radical and peroxynitrite and accumulation of oxidative DNA damage as well as lack of DNA repair enzymes which finally lead to significant increase in oxidative DNA damage represented by increased serum 8-OHdG in the studied groups.
Also, TM was significantly higher in both AML and ALL groups compared to the control group and TXN fold expression was negatively correlated with TM in both AML and ALL. This finding highlights the excessive DNA strand breaks in the studied groups. Both nuclear and mitochondrial DNA are subjected to deleterious ROS-mediated modifications which if not repaired by base excision repair (BER) or nucleotide excision repaircan lead to disease-causing mutations which can finally lead to cancer. As a result, failure of DNA repair due to inactivation of DNA repair enzymes by ROS results in DNA strand breaks.Citation38 ROS predominantly causes DNA base or sugar damage forming single strand breaks (SSBs). However, double strand breaks (DSBs) can also arise after replication past ROS-induced lesions, or when they arise in close proximity. Although DSBs arise at a lower frequency than SSBs, they are biologically significant if unrepaired or misrepaired. There are multiple, overlapping pathways for BER and SSB repair, such that loss of proteins involved in the repair pathways tends to slow but not completely abolish repair. DSBs repair is much slower and loss of the major DSB rejoining pathway is extremely significant.Citation39 Kim et al.Citation40 proved that TXN affects BER activity. In order to understand the role of TXN, they constructed a TXN knockdown system, where DNA damage in terms of relative intensity of the DNA tail was markedly higher in the TXN knocked down cells compared with that in the wild-type cells. In addition, they observed a modulatory role of TXN in the BER pathway through the p53 downstream gene and DNA-damage-inducible protein 45 α (Gadd45a). P53 level and function decreased in the TXN knocked down cells which also showed decreased Gadd45a expression and interaction of Gadd45a with apurinic/apyrimidinic endonuclease 1 (APE1). In conclusion, the redox factor TXN might take part in the control of APE1 function by modulating the p53-mediated BER through the protein–protein interaction between Gadd45a and APE1, providing insight into the novel role of TXN in modulation of BER. And so our results confirm these findings where the under expression of TXN was accompanied by defective DNA repair mechanisms such as BER resulting in a significant increase in DNA strand breaks.
In addition to this, the TM in AML patients was significantly higher than in ALL patients. This can be partly explained by the findings of Sallmyr et al. where they stated that the genetic changes in myeloid malignancies lead to increased production of endogenous sources of DNA damage, such as ROS, that can drive a cycle of genomic instability leading to DSBs and changed repair that can lead to induction of genomic changes. Evidence is coming to light that defects in a main repair pathway for DSBs, non-homologous end-joining, lead to up-regulation of alternative repair mechanism that can create chromosomal deletions and translocations.Citation41
Moreover, we found that serum 8-OHdG and TM were positively correlated in both AML and ALL. In the studied groups, 8-OHdG increased as a result of TXN under expression and the resulting accumulation of ROS and increased oxidized DNA lesions. The consequent deficiency in DNA repair mechanisms results in increased SSB and DSB resulting in increased TM. These findings are in accordance with the findings of Bridge et al.Citation38 previously mentioned.
Finally, we found that TXN expression level showed no correlation with EFS or OS in both AML and ALL groups and therefore, we cannot claim that it could be used to predict treatment outcome in acute leukemia.
Admitting that the number of cases and the follow-up period in this study were limited, we hope this study would prompt other scientists to investigate the implications of TXN expression in acute leukemia to confirm our observations in a larger series of patients.
Conclusion
In summary, this study investigated the relationship between TXN expression and the oxidative DNA damage in adult acute leukemia in Egyptians. We have shown that TXN was under expressed in adult acute leukemia patients which is associated increased oxidative DNA damage in these patients. Therefore, recombinant TXN can be incorporated in leukemia treatment regimens as a new approach to cut off oxidative DNA damage and further mutagenesis. New investigational approaches, as part of well-controlled trials, would be needed to develop a new treatment strategy in adult acute leukemia.
Disclaimer statements
Contributors Immunology laboratory staff, Clinical Pathology Department, Faculty of Medicine, Ain Shams University, helped with the RT-PCR work.
Funding None.
Conflicts of interest All authors have no conflict of interest to report.
Ethics approval In April 2013, the protocol for this study was approved by the Committee of Medical and Pharmaceutical Ethics of Ain Shams University Hospitals in accordance with the Helsinki Declaration of 1975, as revised in 2008.
Acknowledgements
We would like to thank all the patients who participated in this study. We also acknowledge the Immunology Laboratory, Clinical Pathology Department, Faculty of Medicine, Ain Shams University, for their great help with the RT-PCR work.
Related Research Data
References
- Parkin DM, Bray F, Ferlay J, Pisani P. Global cancer statistics, 2002. CA Cancer J Clin 2005;55(2):74–108. doi: 10.3322/canjclin.55.2.74
- El-Mesallamy HO, Hegab HM, Kamal AM. Expression of inhibitor of apoptosis protein (IAP) livin/BIRC7 in acute leukemia in adults: correlation with prognostic factors and outcome. Leukemia Res 2011;35(12):1616–22. doi: 10.1016/j.leukres.2011.05.026
- Kryston TB, Georgiev AB, Pissis P, Georgakilas AG. Role of oxidative stress and DNA damage in human carcinogenesis. Mutat Res 2011;711(1–2):193–201. doi: 10.1016/j.mrfmmm.2010.12.016
- Halliwell B, Gutteridge JMC. Free radicals in biology and medicine. 4th ed. Oxford, UK: Oxford University Press; 2007.
- Fang J, Seki T, Maeda H. Therapeutic strategies by modulating oxygen stress in cancer and inflammation. Adv Drug Deliv Rev 2009;61(4):290–302. doi: 10.1016/j.addr.2009.02.005
- Halliwell B. Oxidative stress and cancer: Have we moved forward? Biochem J 2007;401:1–11. doi: 10.1042/BJ20061131
- Cadet J, Douki T, Ravanat J-L. Oxidatively generated base damage to cellular DNA. Free Radic Biol Med 2010;49(1):9–21. doi: 10.1016/j.freeradbiomed.2010.03.025
- Altieri F, Grillo C, Maceroni M, Chichiarelli S. DNA damage and repair: From molecular mechanisms to health implications. Antioxid Redox Signal 2008;10:891–938. doi: 10.1089/ars.2007.1830
- Matsui A, Ikeda T, Enomoto K, Hosoda K, Nakashima H, Omae K, et al. Increased formation of oxidative DNA damage, 8-hydroxy-2′-deoxyguanosine, in human breast cancer tissue and its relationship to GSTP1 and COMT genotypes. Cancer Lett 2000;151(1):87–95. doi: 10.1016/S0304-3835(99)00424-3
- Schumacker PT. Reactive oxygen species in cancer cells: live by the sword, die by the sword. Cancer Cell 2006;10(3):175–6. doi: 10.1016/j.ccr.2006.08.015
- Cheng GC, Schulze PC, Lee RT, Sylvan J, Zetter BR, Huang H. Oxidative stress and thioredoxin-interacting protein promote intravasation of melanoma cells. Exp Cell Res 2004;300(2):297–307. doi: 10.1016/j.yexcr.2004.07.014
- Engström KS, Vahterb M, Lindha C, Teichertc F, Singhc R, Concha G, et al. Low 8-oxo-7,8-dihydro-2-deoxyguanosine levels and influence of genetic background in an Andean population exposed to high levels of arsenic. Mutat Res 2010;683:98–105. doi: 10.1016/j.mrfmmm.2009.10.014
- Rosen A, Lundman P, Carlsson M, Bhavani K, Srinivasa BR, Kjellström G, et al. A CD4 + T cell line-secreted factor, growth promoting for normal and leukemic B cells, identified as thioredoxin. Int Immunol 1995;7:625–33. doi: 10.1093/intimm/7.4.625
- Gromer S, Urig S, Becker K. The thioredoxin system? From science to clinic. Med Res Rev 2004;24(1):40–89. doi: 10.1002/med.10051
- Lu J, Holmgren A. The thioredoxin antioxidant system. Free Radic Biol Med. 2013;66:75–87.
- Conrad M, Jakupoglu C, Moreno SG, Lippl S, Banjac A, Schneider M, et al. Essential role for mitochondrial thioredoxin reductase in hematopoiesis, heart development, and heart function. Mol Cell Biol 2004;24(21):9414–23. doi: 10.1128/MCB.24.21.9414-9423.2004
- Chutkow WA, Patwari P, Yoshioka J, Lee RT. Thioredoxin-interacting protein (Txnip) is a critical regulator of hepatic glucose production. J Biol Chem 2008;283(4):2397–406. doi: 10.1074/jbc.M708169200
- Powis G, Kirkpatrick DL. Thioredoxin signaling as a target for cancer therapy. Curr Opi Pharmacol 2007;7(4):392–7. doi: 10.1016/j.coph.2007.04.003
- Baker AF, Koh MY, Williams RR, James B, Wang H, Tate WR, et al. Identification of thioredoxin-interacting protein 1 as a hypoxia-inducible factor 1[alpha]-Induced gene in pancreatic cancer. Pancreas 2008;36(2):178–86. doi: 10.1097/MPA.0b013e31815929fe
- Welsh SJ, Bellamy WT, Briehl MM, Powis G. The redox protein thioredoxin-1 (Trx-1) increases hypoxia-inducible factor 1 protein expression: Trx-1 overexpression results in increased vascular endothelial growth factor production and enhanced tumor angiogenesis. Cancer Res 2002;62(17):5089–95.
- Tonissen KF, Di Trapani G. Thioredoxin system inhibitors as mediators of apoptosis for cancer therapy. Mol Nutr Food Res 2009;53(1):87–103. doi: 10.1002/mnfr.200700492
- Brigelius-Flohé R. Selenium compounds and selenoproteins in cancer. Chem Biodivers 2008;5(3):389–95. doi: 10.1002/cbdv.200890039
- Changping L, Thompson MA, Tamayo AT, Zuo Z, Lee J, Vega F, et al. Over-expression of thioredoxin-1 mediates growth, survival, and chemoresistance and is a druggable target in diffuse large B-cell lymphoma. Oncotarget 2012;3:314–26. doi: 10.18632/oncotarget.463
- Collado R, Oliver I, Tormos C, Egea M, Miguel A, Cerdá C, et al. Early ROS-mediated DNA damage and oxidative stress biomarkers in monoclonal B lymphocytosis. Cancer Lett 2012;317(2):144–9. doi: 10.1016/j.canlet.2011.11.018
- Sies H, Cadenas E, Symons MCR, Scott G. Oxidative stress: Damage to intact cells and organs [and discussion]1985 1985–12–17 00:00:00. 617–31 p.
- Raninga PV, Trapani GD, Tonissen KF. Cross talk between two antioxidant systems, thioredoxin and DJ-1: consequences for cancer. Oncoscience 2014;1(1):95–110.
- Ziech D, Franco R, Pappa A, Panayiotidis MI. Reactive oxygen species (ROS)––induced genetic and epigenetic alterations in human carcinogenesis. Mutat Res 2011;711(1–2):167–73. doi: 10.1016/j.mrfmmm.2011.02.015
- Panayiotidis M. Reactive oxygen species (ROS) in multistage carcinogenesis. Cancer Lett 2008;266(1):3–5. doi: 10.1016/j.canlet.2008.02.027
- Bakan N, Taysi S, Yilmaz, Ö, Bakan E, Kuşkay S, Uzun N, et al. Glutathione peroxidase, glutathione reductase, Cu–Zn superoxide dismutase activities, glutathione, nitric oxide, and malondialdehyde concentrations in serum of patients with chronic lymphocytic leukemia. Clin Chim Acta 2003;338(1–2):143–9. doi: 10.1016/j.cccn.2003.08.013
- Fernandes AP, Capitanio A, Selenius M, Brodin O, Rundlöf A-K, Björnstedt M. Expression profiles of thioredoxin family proteins in human lung cancer tissue: correlation with proliferation and differentiation. Histopathology 2009;55(3):313–20. doi: 10.1111/j.1365-2559.2009.03381.x
- Jung HJ. Protective effects of thioredoxin-mediated p53 activation in response to mild hyperthermia. Oncol Rep 2012;27:650–6.
- Ueno M, Matsutani Y, Nakamura H, Masutani H, Yagi M, Yamashiro H, et al. Possible association of thioredoxin and p53 in breast cancer. Immunol Lett 2000;75(1):15–20. doi: 10.1016/S0165-2478(00)00284-4
- Meuillet E, Mahadevan D, Berggren M, Coon A, Powis G. Thioredoxin-1 binds to the C2 domain of PTEN inhibiting PTEN's lipid phosphatase activity and membrane binding: a mechanism for the functional loss of PTEN's tumor suppressor activity. Arch Biochem Biophy 2004;429:123–33. doi: 10.1016/j.abb.2004.04.020
- Zhou F-L, Zhang W-G, Wei Y-C, Meng S, Bai G-G, Wang B-Y, et al. Involvement of oxidative stress in the relapse of acute myeloid leukemia. J Bio Chem 2010;285(20):15010–5. doi: 10.1074/jbc.M110.103713
- Haendeler J, Hoffmann J, Tischler V, Berk BC, Zeiher AM, Dimmeler S. Redox regulatory and anti-apoptotic functions of thioredoxin depend on S-nitrosylation at cysteine 69. Nat Cell Biol 2002;4(10):743–9. doi: 10.1038/ncb851
- Masutani H, Ueda S, Yodoi J. The thioredoxin system in retroviral infection and apoptosis. Cell Death Differ 2005;12(S1):991–8. doi: 10.1038/sj.cdd.4401625
- Zhou J, Bi C, Cheong L-L, Mahara S, Liu S-C, Tay K-G, et al. The histone methyltransferase inhibitor, DZNep, up-regulates TXNIP, increases ROS production, and targets leukemia cells in AML. Blood 2011;118(10):2830–9. doi: 10.1182/blood-2010-07-294827
- Bridge G, Rashid S, Martin S. DNA mismatch repair and oxidative DNA damage: Implications for cancer biology and treatment. Cancers 2014;6(3):1597–614. doi: 10.3390/cancers6031597
- Woodbine L, Brunton H, Goodarzi AA, Shibata A, Jeggo PA. Endogenously induced DNA double strand breaks arise in heterochromatic DNA regions and require ataxia telangiectasia mutated and Artemis for their repair. Nucleic Acids Res 2011;39(16):6986–97. doi: 10.1093/nar/gkr331
- Kim HL, Koedrith P, Lee SM, Kim YJ, Seo YR. Base excision DNA repair defect in thioredoxin-1 (Trx1)-deficient cells. Mutat Res. 2013;751–752(0):1–7. doi: 10.1016/j.mrfmmm.2013.10.002
- Sallmyr A, Fan J, Rassool FV. Genomic instability in myeloid malignancies: Increased reactive oxygen species (ROS), DNA double strand breaks (DSBs) and error-prone repair. Cancer Lett 2008;270(1):1–9. doi: 10.1016/j.canlet.2008.03.036