
ABSTRACT
Objectives: To investigate the pattern of CD55 and CD59 expression on RBCs of SCD patients, and its association with anemia, biochemical parameters of hemolysis, level of erythropoietin, and pro-inflammatory markers.
Methods: Flow cytometric analysis was performed on RBCs from 71 adult SCD patients and 53 healthy controls, using the commercial REDQUANT kit.
Results: CD59 deficiency was significantly higher among SCD patients than among healthy controls. The proportions of CD55-deficient and CD59-deficient RBCs from SCD patients were significantly higher when compared with those from healthy controls (0.17 vs. 0.09 and 2.1 vs. 1.2, respectively). The MFI of CD55 and CD59 expression on RBCs in SCD was significantly reduced when compared to the expression in healthy controls (5.2 vs. 6.4 and 19.4 vs 20.3, respectively). The pattern of CD55 and CD59 expression was not correlated with anemia, biomarkers of hemolysis, erythropoietin level, or other pro-inflammatory markers.
Discussion: There is an altered pattern of CD55 and CD59 expression on RBCs of SCD Patients; however, it does not seem to play a causal role in the pathophysiology of anemia, and is unlikely to be influenced by the level of erythropoietin or other inflammatory mediators.
KEYWORDS:
Introduction
Sickle cell disease (SCD) is an inherited hemoglobin disorder caused by the intra-erythrocytic polymerization of deoxyhemoglobin S, which deforms the shape of red blood cells (RBCs) and alters their ability to circulate, particularly in narrow vascular beds [Citation1,Citation2]. Geographically, it is most common among people from Africa, India, the Caribbean, the Middle East, and the Mediterranean [Citation3]. The frequency of hemoglobin S (HbS) gene in the Middle Eastern Arab countries ranges from <1% to 18% [Citation4]. In a comprehensive electrophoretic screening that was conducted among Kuwaiti population, the frequencies of sickle cell trait and sickle cell disease were found to be 6% and 2.5%, respectively [Citation5].
One of the major manifestations in SCD is chronic anemia that is mainly caused by hemolysis, as manifested by the active hematologic compensation (elevated reticulocyte count) and the generation of by-products of hemolysis (increased unconjugated bilirubin, increased lactate dehydrogenase, decreased haptoglobin) [Citation1,Citation2]. Several complications occur that can also cause patients with SCD to become acutely more anemic include splenic sequestration, acute erythroid aplasia, and episodes of increased hemolysis due to infection-induced and/or drug-induced oxidative stress [Citation1,Citation2].
Previous studies suggest that activation of complement, particularly of the alternative pathway, is an ongoing process in patients with SCD leading to the conclusion that complement activation might result in intravascular hemolysis of sickle cells [Citation6,Citation7]. The presence of significant levels of intravascular hemolysis in patients with SCD suggests that complement-mediated damage indeed could contribute to the hemolytic process in SCD [Citation8]. Because the normal RBCs are well equipped to withstand damage by activated complement, dysfunction of membrane complement regulatory proteins would be requisite for complement-mediated hemolysis to occur.
The complement system includes soluble and cell membrane-bound proteins, which circulate in the plasma in inactive forms, and can be activated through classical pathway, alternative pathway, and lectin pathway [Citation9]. These three pathways lead to C3/C5 convertase enzyme and the terminal pathway pore-like membrane attack complex (MAC) formation, which result in cell lysis [Citation9].
Red blood cells are normally protected from complement-mediated lysis by the action of surface complement regulatory proteins including decay-accelerating factor (DAF, CD55) and membrane inhibitor of reactive lysis (MIRL, CD59) [Citation10–17]. CD55 and CD59 belong to the group of proteins that are linked to the cell membrane via a glycosylphosphatidyl-inositol (GPI) anchor [Citation18]. CD55 inhibits the assembly of C3 and C5 convertases of the classical and alternative pathways and thereby regulates the complement cascade at the C3 step [Citation19], while CD59 limits the polymerization of C9 in membrane C5b-9 complex [Citation20].
During the life span of the sickle cell, several alterations in the cell membrane occur; among these is the loss of membrane in the form of spectrin-free microvesicles during repeated cycles of deoxygenation (sickling) and reoxygenation (unsickling) [Citation21,Citation22]. Previous studies showed that membrane proteins having a GPI anchor are preferentially lost relative to other membrane proteins into the vesicles released from RBCs during in vitro vesiculation [Citation23], and therefore, RBCs are subjected to increased sensitivity to lysis mediated by the terminal MAC of complement (reactive lysis) [Citation24].
Deficiency of membrane-bound GPI-anchored proteins causes increased sensitivity of all three hematopoietic lineages (RBCs, platelets, and lymphocytes) to complement-mediated cell lysis; however, the diminished expression of the surface proteins CD55 and CD59 is not specific to paroxysmal nocturnal hemoglobinuria (PNH), an acquired hemolytic anemia characterized by augmented sensitivity to complement-mediated lysis [Citation24,Citation25]. It has been previously described in several disorders including auto-immune hemolytic anemia [Citation26], HIV infection [Citation27], type 2 diabetes and macro-vascular disease [Citation28], systemic lupus erythematosus [Citation29,Citation30], auto-immune thrombo-cytopenia [Citation25], aplastic anemia [Citation25], and poly transfused patients with β-thalassemia major [Citation31].
Data from a previous study revealed that the expression of CD55 and CD59 on RBCs is influenced by cytokines. Recombinant erythropoietin therapy had been shown to increase the expression of CD55 and CD59 on RBCs of anemic chronic renal failure patients on hemodialysis; thus, mediating its efficacy [Citation32]. Furthermore, although plasma levels of several pro-inflammatory cytokines including tumor necrosis factor-α (TNF-α) and interleukin 1β (IL-1β) had been shown to be raised in patients with SCD, either during painful crisis or at steady state, the influence of such pro-inflammatory cytokines on the expression of CD55 and CD59 on RBCs has not been previously investigated [Citation33].
Although the role of CD55 and CD59 deficiencies has been well understood in PNH, limited information is available on the role of complement in red cell lysis in SCD [Citation7,Citation8,Citation34], and on the influence of erythropoietin level and other pro-inflammatory cytokines on their expression on sickled RBCs.
Therefore, we hypothesize that the expression of CD55 and CD59 is altered on sickled RBCs, and their expression may be related in part to the level of erythropoietin and other pro-inflammatory cytokines including tumor necrosis factor-α (TNF-α) and interleukin 1β (IL-1β) in SCD patients.
Materials and methods
Study population
The study population consists of two groups of adult patients aged ≥18 years: (1) SCD patients admitted to hospital with acute painful vaso-occlusive crisis (VOC), or in steady state followed up in hematology outpatient clinic, and (2) age-, sex- and ethnically matched healthy controls. Patients were recruited from Al-Amiri Hospital, and blood samples were collected over a period of 12 months (April 2014–March 2015). None of the patients had history of blood transfusion in the previous three months prior to sample collection. Blood samples were collected during the study period from 71 SCD patients, 64 of which were collected during acute painful VOC episodes and seven during steady-state periods. Blood samples were also collected from 53 healthy control subjects. The study was approved by the Research Ethics Committee of Ministry of Health and the Faculty of Medicine, and informed written consent was obtained from all patients and healthy controls.
Blood samples were obtained within 24 hours of hospital admission from consenting patients if they were admitted into hospital in acute VOC, which is defined as an episode of acute pain in the limbs and/or abdomen, resulting in hospitalization that cannot be explained by any medical problem other than SCD, and consenting steady-state patients free of VOC, who were visiting the specialist outpatient clinic. Clinical data of all patients were obtained from their medical charts.
Flow cytometric analysis of CD55 and CD59 on RBCs
Peripheral venous blood samples were collected from all enrolled subjects in EDTA-anticoagulated tubes and processed immediately. An indirect immunofluorescence method was performed as described in the package insert of the REDQUANT CD55/CD59 kit (Biocytex, Marseille, France). The kit contains CD55 (clone 29D9) and CD59 (clone 2.24) monoclonal antibodies (Mabs), Fluorescein isothiocyanate conjugated goat anti-mouse Ig (FITC reagent), pre-calibrated α-beads for CD55 analysis and β-beads for CD59 analysis on erythrocytes, and specific buffer. Briefly, 20 μl diluted EDTA whole blood (1:150) were incubated with 20 μl CD55 or CD59 for 10 minutes at room temperature. Two additional test tubes were added to each series, containing 40 μl of pre-calibrated α-beads or pre-calibrated β-beads, respectively. Test tubes containing stained whole blood and beads were incubated with 20 μl FITC reagent for additional 10 minutes. After the staining procedure, samples were diluted with buffer (2 ml) and stored at 4°C for up to 4 hours until measurement. The overall time from blood sample collection to flow cytometric measurement did not exceed 8 hours, according to the REDQUANT kit manufacturer’s instructions.
Red blood cells were analyzed for CD55 and CD59 expression using the REDQUANT kits according to manufacturer’s instructions using the Cytomics FC 500 Beckman Coulter flow Cytometer instrument (Beckman Coulter, Inc., Brea, CA) that is already available in the Research Core Facility (RCF) laboratories in Faculty of Medicine-Kuwait University. RBCs were gated on the basis of their forward and side scatter characteristics with the use of logarithmic amplification and 10 000 events were analyzed for each antibody. To set the interpretation cursors for the CD55 and CD59 pathological regions the α- and β-beads mean fluorescence intensity (MFI) was displayed as geometrical mean (GeoMean) and reported first. Beads were used to set a standardized cursor in the fluorescence histogram whose left limit was set in the first channel and right limit corresponded to a standardized fluorescence channel position (Fl) determined by the following equations for which the ‘α’ and ‘β’ values were mentioned in the manufacturer's data sheet: [αFI = ‘α’ × α-bead MFI] for CD55 cursor; [βFI = ‘β’ × β-bead MFI] for CD59 cursor. Both standardized cursors allowed the percentage of CD55- and CD59-deficient cells to be determined. Thus, two parameters are obtained: the percentage of deficient CD55 and CD59 erythrocytes. The presence of a deficient clone is suspected when the pathological region contains more than 3% of antigen-deficient cells. MFI of CD59 and CD55 expression in SCD patients and healthy controls was also evaluated.
Measurement of tumor necrosis factor-α (TNF-α), interleukin 1β (IL-1β), and erythropoietin levels
Peripheral venous blood samples were collected from all enrolled patients in plain tubes. Blood samples were centrifuged at 5000 g for 15 minutes, and serum samples were transferred into coded tubes and frozen at −80°C until assayed for the different biomarkers. Enzyme-linked immunosorbent assay (ELISA) were used to measure the levels of the pro-inflammatory cytokines tumor necrosis factor-α (TNF-α), interleukin 1β (IL-1β), and erythropoietin (eBioscience, San Diego, CA).
Measurement of parameters of hemolysis
Biochemical and hematologic parameters were measured as part of the patients’ routine care, including complete blood cell count (CBC), reticulocyte count (Beckman Coulter Hematology Analyzer, Beckman Coulter, Brea, CA), C-reactive protein (Beckman Coulter IMMAGE Immunochemistry System), lactate dehydrogenase (LDH), and hemoglobin high-performance liquid chromatography analysis (Waters Corporation, Milford, Massachusetts).
Statistical analyses
Data were analyzed using IBM SPSS Statistics, version 19 (IBM, Armonk, New York). Quantitative variables were analyzed using descriptive statistics; means are reported with standard deviations and medians are reported with their interquartile ranges (25th and 75th percentiles) for parametric and non-parametric variables, respectively. Parametric and non-parametric measures of comparison of the proportions of CD55- and CD59-deficient RBCs among the two groups (SCD patients and healthy controls) were used for symmetric and skewed variables, respectively. Chi-square test was used to test the association between CD55 and CD59 deficiency among the SCD patients and healthy control groups. Mann–Whitney test was used to measure non-parametric correlations between CD59-deficiency and hematologic parameters, inflammatory and hemolytic markers, and clinical parameters, as applicable. A p value <0.05 (2-tailed) was considered statistically significant.
Results
Clinical and laboratory measures
Clinical, hematological, and biochemical characteristics for the study cohort and healthy controls are detailed in .
Table 1. Clinical characteristics and laboratory findings of SCD patients and healthy controls.
Red blood cell analyses
shows a representative dot plot and histogram of the obtained resultant analysis. CD55 deficiency (CD59-deficient RBCs >3%) among SCD patients did not differ significantly when compared with healthy controls. Nevertheless, CD59 deficiency (CD59-deficient RBCs >3%) among SCD patients was significantly higher than among healthy controls ( and ). The proportions of CD55-deficient and CD59-deficient RBCs from SCD patients were significantly higher than those from healthy controls (0.17 vs. 0.09 and 2.1 vs. 1.2, respectively); ( and ). The MFI of CD55 and CD59 expression on SCD RBCs was significantly reduced when compared to the expression on RBCs from healthy controls (5.2 vs. 6.4 and 19.4 vs 20.3, respectively); ( and ).
Figure 1. Representative dot plots showing RBC distribution by forward scatter (FSC) and side scatter (SSC), and histograms showing CD55 and CD59 FITC MFI expressions versus counted cells from RBCs gate. (a) and (b) showing CD55 and CD59 expression on RBCs from healthy control. (c) and (d) showing CD55 and CD59 expression on RBCs from SCD patients, respectively.
Figure 2. Comparison of (a) CD55 deficiency and (b) CD59 deficiency states among healthy controls and SCD patients.
Figure 3. Comparative analysis of the proportion of CD55-deficient (a) and CD59-deficient (b) RBCs from SCD patients and healthy controls.
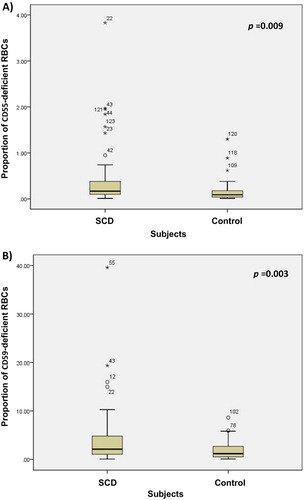
Figure 4. Comparative analysis of the MFI of (a) CD55-positive and (b) CD59-positive RBCs from SCD patients and healthy controls.
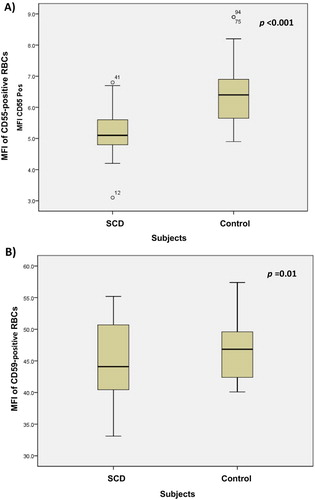
Table 2. Proportion of CD55 and CD59-deficient RBCs cells and the mean of membrane fluorescence intensity (MFI) of CD55 and CD59 expression.
Relationships of CD55 and CD59 expression on RBCs of SCD patients to clinical laboratory findings, hemolytic parameters, and inflammatory markers
Relationship to clinical laboratory findings
There was a significant direct relation between the proportion of CD55-deficient cells (but not the MFI of CD55 expression) in SCD patients and WBC count, MCV, platelet count, and reticulocyte count. There was no relation to hemoglobin level, red cell distribution width (RDW), and hemoglobin F ().
Table 3. Correlation between the proportion of CD55- and CD59-deficient RBCs in SCD patients and, hematologic, hemolytic, and inflammatory parameters in SCD patients.
Neither the proportion of CD59-deficient cells nor the MFI of CD59 expression were associated with the hematological parameters including hemoglobin level, MCV, RDW, hemoglobin F level, reticulocyte count, platelet counts, and WBC count ().
Relationship to inflammatory markers
The proportions of CD55- and CD59-deficient RBCs, and the MFI of CD55 and CD59 expression on RBCs of SCD patients were not associated with the level of inflammatory biomarkers studied including CRP, TNF-α, and IL-1β ().
Relationship to hemolytic markers
The proportion of CD55-deficient cells in SCD patients showed significantly relation to reticulocyte count; however, it was not associated with other hemolytic markers including LDH, and serum bilirubin level ().
The proportion of CD59-deficient cells in SCD patients was not associated with hemolytic markers including LDH, serum bilirubin level, and reticulocyte count ().
Relationship to erythropoietin level
Erythropoietin level was not associated with the proportions of CD55- and CD59-deficient, or with the MFI of their expression on RBCs of SCD patients.
The relationship of CD59 deficiency state in SCD patients to clinical laboratory findings, hemolytic parameters, and inflammatory markers
There was no significant association between CD59 deficiency state (CD59-deficient RBCs >3%) and the various clinical laboratory findings, hemolytic parameters, and inflammatory markers that were tested ().
Table 4. Correlation between CD59 deficiency and inflammatory, hematologic, and hemolytic parameters in SCD patients.
Discussion
Hemolytic anemia is a prominent clinical manifestation of SCD. Red blood cells in SCD are known to have several membrane abnormalities [Citation35]. Although the exact mechanism of hemolysis in sickle cell anemia is unclear, it has been postulated that hemolysis occurs predominantly in the intravascular space due to the shape change induced by precipitation of the paracrystals of hemoglobin S, and by changes in the membrane induced by this process [Citation8]. The ability of activated complement to induce intravascular hemolysis, together with evidence from studies on the susceptibility of sickled RBCs to complement-mediated hemolysis [Citation23], led us to hypothesize that sickled RBCs have defective complement regulation that render them to be unusually sensitive to complement-dependent hemolysis as a result of defective CD55 and CD59 expression that is similar to the pathophysiological model of paroxysmal nocturnal hemoglobinuria (PNH).
This study was set out to examine the pattern of expression of the CD55 and CD59 in SCD and healthy control blood samples, which has not been previously studied. The proportion of CD55- and CD59-deficient RBCs in SCD was significantly reduced when compared to healthy controls. It was also found that the MFI of CD55 and CD59 expression on RBCs of SCD patient was also significantly reduced when compared to the expression in healthy controls. Both observations do not seem to be associated with the hemoglobin level in SCD patients.
Similar to our results, Test and Woolworth investigated complement regulation in sickle RBCs; they found decreased levels in the membrane content of CD55 and CD59, and increased sensitivity of the affected cells to complement-mediated lysis [Citation34]. They hypothesized that the increased susceptibility to lysis occurs as a consequence of increased binding of the C5b-7 complex and of C9.
In this study, it was evident that there are differences in the association between the proportion of CD55- and CD59-deficinet RBCs in SCD patients and the various hematological parameters, hemolytic and inflammatory markers that were studied. We found a significant relation between the proportion of CD55-deficient cells in SCD patients and WBC count, reticulocyte count and platelet count, but not with CD59-deficinet RBCs. We think that it is likely that CD55, as a complement regulatory protein, is a more critical regulator compared to CD59 in SCD.
Our data also showed a preferential deficiency of CD59 in 38% of SCD patients, and hence, we do not think that it is due to a defective biosynthesis of the GPI-anchored membrane proteins on stem cell clone, as it is the case in PNH, since the proportion of SCD patients with CD55 deficiency was very low compared to that with CD59 deficiency. This finding was not previously reported in the literature. The molecular basis of our findings is unclear; however, one possible explanation is that the methodology used in this study relies upon simple light scatter to ‘gate’ RBCs in the sample. Using light scatter alongside the use of specific conjugates of CD235a antibody might increase the sensitivity of measuring CD55 and CD59 expression on RBCs by specifically identifying RBCs free of other non-RBC events before being interrogated with CD55 and CD59 antibodies [Citation36,Citation37]. Furthermore, microvesicle shedding and shape and size changes of the SCD RBCs might explain the altered expression of CD55 and CD59 expression in this study [Citation21–24].
Of interest, the present data did not show an association between the preferential deficiency of CD59 and the various hematological parameters, including the hemoglobin level, hemolytic, and inflammatory markers. In light of these findings, the significance of CD59 deficiency in SCD disease needs to be further evaluated, and the etiology by which these complement regulatory proteins are abnormally expressed need to be further explored.
Previous studies have investigated the role of various pro-inflammatory cytokines in patients with SCD. They showed an emerging consensus that platelets, white blood cells, endothelial cells, and vaso-occlusion-induced tissue damage are implicated in the upregulated production of numerous inflammatory mediators that contribute to the vaso-occlusive complications of SCD [Citation33,Citation38,Citation39]. Interestingly, our study did not show increased levels of the inflammatory mediators, TNF-α, and IL-1β, in SCD patients as compared to the healthy controls. This finding could be related to the sensitivity of those selected pro-inflammatory cytokines to accurately reflect the inflammatory status in SCD.
Ohi et al showed that recombinant erythropoietin increases the expression of CD55 and CD59 on RBCs of anemic chronic renal failure patients on hemodialysis; however, our study did not demonstrate the positive influence of the endogenous erythropoietin on the expression of CD55 and CD59 [Citation32].
In conclusion, to the authors’ knowledge, this is the first study to investigate the expression pattern of CD55 and CD59 on RBCs in SCD patients. Our results suggest that although there is an abnormal pattern of CD55 and CD59 expression on RBCs of SCD patients, it does not seem to play a significant role in the pathophysiology of hemolysis in these patients, and is unlikely to be influenced by the level of inflammatory mediators or erythropoietin level.
Competing interests
The authors have no competing interests.
Acknowledgments
We thank Mrs. Sicy Easow and Mrs. Suhair Al-Fawal for their tremendous effort in performing the flow cytometric analysis and ELISA and for sample collection. The flow cytometric analysis was performed in the Research Core Facility of the Health Sciences Center supported by projects GM 01/01 and GM 01/05.
Disclosure statement
No potential conflict of interest was reported by the authors.
Notes on Contribution
Lama Al-Faris, MD, FRCPath, Assistant Professor, Department of Pathology, Faculty of Medicine, Kuwait University.
Monera Al-Rukhayes, M.Sc, Department of Pathology, Faculty of Medicine, Kuwait University.
Salah Al-Humood, MD, FRCP(C), Associate Professor, Department of Pathology, Faculty of Medicine, Kuwait University.
Additional information
Funding
References
- Embury SH, Hebbel RP, Mohandas N, et al. editors. Sickle cell disease: basic principles and clinical practice. New York, NY: Raven Press; 1994.
- Serjeant GR, Serjeant BE. Sickle cell disease. Oxford, UK: Oxford University Press; 2001.
- El-Hazmi MA, Al-Hazmi AM, Warsy AS. Sickle cell disease in middle East Arab countries. Indian J Med Res. 2011;134:597–610. doi: 10.4103/0971-5916.90984
- El-Hazmi MA, Warsy AS. Hemoglobinopathies in Arab countries. In: Teebi AS, Farag TL, editors. Genetic disorders among Arab populations. New York: Oxford University Press; 1997. p. 83 –110.
- Marouf RA, D’souza TM, Adekile AD. Hemoglobin electrophoresis and hemoglobinopathies in Kuwait. Med Princ Pract. 2002;11:38–41. doi: 10.1159/000048659
- Wilson WA, Thomas EJ, Sissons JGP. Complement activation in asymptomatic patients with sickle cell anaemia. Clin Exp Immunol. 1979;36:130–139.
- Chudwin DS, Korenblit AD, Kingzette M, et al. Increased activation of the alternative complement pathway in sickle cell disease. Clin Immunol Immunopathol. 1985;37:93–97. doi: 10.1016/0090-1229(85)90139-4
- Bensinger TA, Gillette PN. Hemolysis in sickle cell disease. Arch Intern Med. 1974;133:624–631. doi: 10.1001/archinte.1974.00320160118010
- Meri S, Jarva H. Complement regulation. Vox Sang. 1998;74(Suppl. 2):291–302. doi: 10.1111/j.1423-0410.1998.tb05434.x
- Nicholsen-Weller A, March JP, Rosenfeld SI, et al. Affected erythrocytes of patients with paroxysmal nocturnal hemoglobinuria are deficient in the complement regulatory protein, decay accelerating factor. Proc Natl Acad Sci. 1983;80:5066–5070. doi: 10.1073/pnas.80.16.5066
- Holguin MH, Frederick LR, Bernshaw NJ, et al. Isolation and characterization of a membrane protein from normal human erythrocytes that inhibits reactive lysis of the erythrocytes of paroxysmal nocturnal hemoglobinuria. J Clin Invest. 1989;84:7–17. doi: 10.1172/JCI114172
- Alfnito F, Del Vecchio L, Rocco S, et al. Blood cell flow cytometry in paroxysmal nocturnal hemoglobinuria: a tool for measuring the extent of the PNH clone. Leukemia. 1996;10:1326–1330.
- Hall SE, Rosse WF. The use of monoclonal antibodies and flow cytometry in the diagnosis of paroxysmal nocturnal hemoglobinuria. Blood. 1996;87:5332–5340.
- Blanchard D, Navenot JM, Petit Le Roux Y, et al. Flow cytometry and immunoblotting analysis of monoclonal antibodies directed to complement regulatory proteins. Transfus Clin Biol. 1997;4:131–134. doi: 10.1016/S1246-7820(97)80028-6
- Nebe CT. Paroxysmal Nocturnal Hemoglobinuria: clinical aspects and flow cytometric analysis. In: Gutensohn K, Sonneborn H-H, Kühnl P, editors Aspects of the flow-cytometric analysis of red blood cells. Mainz, Germany: Clin Lab Publications; 1997. p. 81–94.
- Yamamoto M, Figueiredo MS, Bahia DM. Evaluation of paroxysmal nocturnal hemoglobinuria clone in peripheral blood cells using flow cytometry technique. Blood. 1999;94(Suppl. 2), A 3177–3178.
- Frank MM. Complement in the pathophysiology of human disease. N Engl J Med. 1987;316:1525–1530. doi: 10.1056/NEJM198706113162407
- Lublin DM, Atkinson JP. Decay accelerating factor: biochemistry, molecular biology and function. Ann Rev Immunol. 1989;7:35–58. doi: 10.1146/annurev.iy.07.040189.000343
- Walport MJ. Complement: first of two parts. N Engl J Med. 2001;344:1058–1066. doi: 10.1056/NEJM200104053441406
- Allan D, Limbrick AR, Thomas P, et al. Release of spectrin-free spicules on reoxygenation of sickled erythrocytes. Nature. 1982;295:612–613. doi: 10.1038/295612a0
- Wagner GM, Chiu DTY, Yee MC, et al. Red cell vesiculation-A common membrane physiologic event. J Lab Clin Med. 1986;108:315–324.
- Biitikofer P, Kuypers FA, Xu CM, et al. Enrichment of two glycosyl-phosphatidylinositol-anchored proteins, acetylcholinesterase and decay-accelerating factor, in vesicles released from human red blood cells. Blood. 1989;74:1481–1485.
- Test ST, Biitikofer P, Yee MC, et al. Characterization of the complement sensitivity of calcium loaded human erythrocytes. Blood. 1991;78:3056–3065.
- Meletis J, Terpos E. Recent insights into the pathophysiology of paroxysmal nocturnal hemoglobinuria. Med Sci Monit. 2003;9:RA161–RA172.
- Ruiz-Delgado GJ, Vázquez-Garza E, Méndez-Ramírez N, et al. Abnormalities in the expression of CD55 and CD59 surface molecules on peripheral blood cells are not specific to paroxysmal nocturnal hemoglobinuria. Hematology. 2009;14:33–37. doi: 10.1179/102453309X385089
- Barros MM, Yamamoto M, Figueiredo MS, et al. Expression levels of CD47, CD35, CD55, and CD59 on red blood cells and signal-regulatory protein on monocytes from patients with warm autoimmune hemolytic anemia. Transfusion. 2009;49:154–160. doi: 10.1111/j.1537-2995.2008.01936.x
- Terpos E, Sarantopoulos A, Kouramba A, et al. Reduction of CD55 and/or CD59 in red blood cells of patients with HIV infection. Med Sci Monit. 2008;14:CR276–CR280.
- Ma XW, Chang ZW, Qin MZ, et al. Decreased expression of complement regulatory proteins, CD55 and CD59, on peripheral blood leucocytes in patients with type 2 diabetes and macrovascular diseases. Chin Med J. 2009;122:2123–2128.
- Alegretti AP, Mucenic T, Merzoni J, et al. Expression of CD55 and CD59 on peripheral blood cells from systemic lupus erythematosus (SLE) patients. Cell Immunol. 2010;265:127–132. doi: 10.1016/j.cellimm.2010.07.013
- Xu WD, Zhang YJ, Zhou M, et al. Reduced expression of CD55 and CD59 on peripheral blood cells from systemic lupus erythematosus: profitable to diagnose some complications? Cell Immunol. 2011;271:15–17. doi: 10.1016/j.cellimm.2011.06.024
- Salama MA, Sadek NA, Hassab HM, et al. Erythrocyte autoantibodies and expression of CD59 on the surface of red blood cells of polytransfused patients with beta-thalassaemia major. Br J Biomed Sci. 2004;61:88–92. doi: 10.1080/09674845.2004.11732650
- Ohi H, Tamano M, Sudo S, et al. Recombinant EPO therapy increases erythrocyte expression of complement regulatory proteins. Am J Kidney Dis. 2003;41:179–185. doi: 10.1053/ajkd.2003.50002
- Qari MH, Dier U, Mousa SA. Biomarkers of inflammation, growth factor, and coagulation activation in patients with sickle cell disease. Clin Appl Thromb Hemost. 2012;18:195–200. doi: 10.1177/1076029611420992
- Test ST, Woolworth VS. Defective regulation of complement by the sickle erythrocyte: evidence for a defect in control of membrane attack complex formation. Blood. 1994;l83:842–852.
- Hebbel RP. Beyond hemoglobin polymerization: the red blood cell membrane and sickle disease pathophysiology. Blood. 1991;177:214–237.
- Borowitz MJ, Craig FE, Digiuseppe JA, et al. Guidelines for the diagnosis and monitoring of paroxysmal nocturnal hemoglobinuria and related disorders by flow cytometry. Cytometry B Clin Cytom. 2010;78:211–230.
- Sutherland DR, Keeney M, Illingworth A. Practical guidelines for the high-sensitivity detection and monitoring of paroxysmal nocturnal hemoglobinuria clones by flow cytometry. Cytometry B Clin Cytom. 2012;82(4):195–208. doi: 10.1002/cyto.b.21023
- Ataga KI, Moore CG, Hillery CA, et al. Coagulation activation and inflammation in sickle cell disease-associated pulmonary hypertension. Haematologica. 2008;93:20–26. doi: 10.3324/haematol.11763
- Etienne-Julan M, Belloy MS, Decastel M, et al. Childhood sickle cell crises: clinical severity, inflammatory markers and the role of interleukin. Haematologica. 2004;89:863–864.