
ABSTRACT
Background: Although dysplasia plays an important role in the diagnosis of myelodysplasia syndrome (MDS), its morphologic variety and irregularity result in difficulties in its clinical application.
Methods: Bone marrow smears from cases with MDS and non-clonal disease were collected and performed microscopy analysis. We respectively recorded the percentage of specific dysplastic cells (PSDC) and incidence of specific dysplasia (ISD) of each dysplastic type in three hematopoietic cell lineages for the comprehensive analysis of diagnostic efficacy to MDS.
Results: Compared with non-clonal anemia, the PSDCs and ISDs of the four specific dysplastic types as petal nucleus and internuclear bridging in erythroid lineage, pseudo-Pelger-Huet in granulocytic lineage and lymphoid small megakaryocyte in megakaryocytic lineage were significantly higher in MDS; and their area under the curves were all greater than 0.600. If the dysplastic rate in each lineage was higher than 10%, their corresponding false positive rates (FPRs) were below 0.033, 1 × 10⁻⁴ and 1 × 10⁻⁴, respectively. If the dysplastic rates in three cell lineages reached 0.065, 0.045 and 0.040, respectively, their corresponding FPRs were all below 0.050.
Conclusion: Four specific dysplastic types possess higher diagnostic efficacy for the diagnosis of MDS. Though the dysplastic rate over 10% in any hematopoietic cell lineage presents a lower FPR, it is possibly considered to lower the diagnostic threshold of MDS if a specific dysplastic type with higher diagnostic efficacy presents.
Introduction
Myelodysplastic syndrome (MDS) is a clonal disorder of hematopoietic stem cell, characterized by peripheral blood cytopenias and bone marrow dysplasia [Citation1,Citation2]. Dysplasia is an important morphological characteristic and diagnosis basis of MDS. It is referred to the abnormal development of bone marrow hematopoietic cells (including abnormalities of either cell number or morphology in erythroid, granulocytic, and megakaryocytic lineages), that mainly related to ineffective hematopoiesis. According to the 2016 revision to the World Health Organization (WHO) classification of myeloid neoplasms and acute leukemia, terms such as ‘refractory anemia’ and ‘refractory cytopenia’ were replaced by ‘myelodysplastic syndrome-single /multi-lineage dysplasia’ in adult MDS [Citation2]. Although dysplasia plays such an important role in the diagnosis of MDS, its morphologic variety and irregularity result in difficulties in its clinical application. Some studies have described the characteristics of dysplasia in MDS; however, the preferable dysplastic types and their effectiveness in diagnosing MDS are still unknown. This study is intended to comprehensively summarize the classifications and frequency characteristics of dysplasia in MDS, and subsequently to screen out the significant dysplastic indicators for the diagnosis of MDS.
Materials and methods
Patients
A total of 214 patients with dysplasia treated from 1 January 2011 to 31 October 2016 in the First Affiliated Hospital of Sun Yat-sen University were retrospectively reviewed. Of these patients, 92 cases were diagnosed as MDS [58 males and 34 females, median age: 49 (aging from 28 to 74)] [including 3 myelodysplastic syndromes with single lineage dysplasia (MDS-SLD), 12 myelodysplastic syndromes with multi-lineage dysplasia (MDS-MLD), 26 myelodysplastic syndromes with ring sideroblsts (MDS-RS), 44 myelodysplastic syndromes with excess of blasts (MDS-EB), 4 MDS with isolated del(5q), and 3 MDS unclassifiable (MDS-U)], and 122 cases were diagnosed as non-clonal anemia [67 males and 55 females, median age: 48 (aging from 25 to 70)] [including 20 immune thrombocytopenia (ITP), 14 megaloblastic anemia (MA), 24 iron deficiency anemia (IDA), 30 hemolytic anemia (HA), and 34 chronic diseases anemia]. Age of the MDS patients and non-clonal anemia patients were not significant different (P > 0.05).
At first visit, all patients (including the MDS patients and non-clonal anemia patients) underwent bone marrow aspiration, peripheral blood smear, bone marrow cell morphology with Wright-Giemsa staining, cytochemical stainings (including peroxidase staining, glycogen staining, naphthol acetate esterase staining, neutrophil alkaline phosphatase staining, and iron staining), cytogenetics analysis [including G-band chromosome analysis and fluorescence in situ hybridization (FISH)], and flow cytometry. All samples were respectively diagnosed by cell morphology and bone marrow pathology specialists for initial diagnosis, and subsequently by clinical hematology specialists for definitive diagnosis. Cases were excluded if they had insufficient material for any analysis or an alternative diagnosis identified, such as acute leukemia, chronic leukemia, myeloproliferative disorders, or solid tumor. All the diagnosis reports were strictly on the basis of the 2016 revision to the World Health Organization classification of myeloid neoplasms and acute leukemia [Citation2]. In the 92 MDS patients, 42 had cytogenetic abnormalities. Among these 42 patients, 12 had +8 abnormality, 8 had −7 or del(7q) abnormality, 8 had −Y abnormality, 4 had del(5q) abnormality, 4 had del(20q) abnormality, 2 had del(7q), +8, del(20q) abnormalities, 1 had del(7q), +8, del(20q) and −Y abnormalities, 1 had del(9q) abnormality, 1 had t(6;9)(p23;q34) abnormality, and 1 had t(11;16)(q23;p13.3) abnormality. The 122 non-clonal anemia cases were all negative for all the cytogenetic analysis.
Observation methodology
Based on the classification of dysplasia by Liu et al. and other literature, the bone marrow smears and blood smears with Wright-Giemsa staining were observed under oil immersion lens by two experienced haematological morphologists. For each case, 500 nucleated cells were differentiated. Thereafter, 200 neutrophils, 200 erythroblasts and more than 50 megakaryocytes were reviewed to access dysplasia. The morphological characteristics of different dysplastic types were evaluated with two parameters: Firstly, the percentage of specific dysplastic cells (PSDC), refers to the percentage of specific dysplasia, is calculated by (the number of specific dysplastic cells)/(the total accounted cells); Secondly, the incidence of specific dysplasia (ISD) refers to the percentage of cases with specific dysplasia, is calculated by (the number of cases with specific dysplasia)/(the number of total cases) [Citation3]. According to the literatures and empirical observations of actual cases, we systematically summarized the classifications of dysplasia as the following 26 types, grouping into three hematopoietic cell lineages () [Citation3,Citation4]. The results were summarized and verified by two additional experienced hematology morphologists, and the final result was reported.
Table 1. Definition of the types and description of the morphological features for dysplasias in erythroid, megakaryocytic and granulocytic lineages.
Statistical analysis
The statistical analysis was performed by SPSS 13.0 software. The PSDCs of various dysplastic types in patients with MDS and non-clonal anemia were compared by using the rank sum test. The ISD of various dysplastic types in patients with MDS and non-clonal anemia were compared by using the Chi-square test. The diagnostic efficacies of various dysplastic types for MDS patients were compared by using the ROC curve analysis. The diagnostic efficacies of the dysplastic rates in the three hematopoietic cell lineages for MDS patients were compared by using the ROC curve analysis. Difference was considered statistically significant if P < 0.05.
Ethical aspects
This study was approved by the Ethics Committee of the First Affiliated Hospital of Sun Yat-sen University in Guangzhou, China.
Results
Comparison of PSDCs in patients with MDS and non-clonal anemia
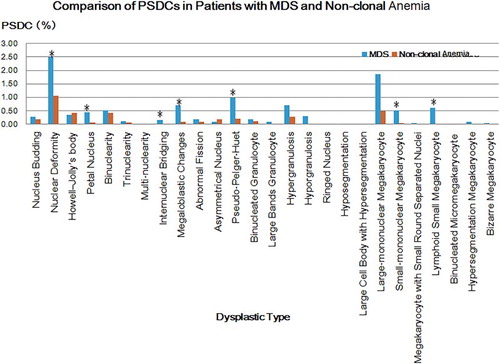
According to the comparative analysis, the PSDCs of various dysplastic types all mentioned above in were higher in MDS than that of non-clonal anemia, except Howell-Jolly’s body and asymmetrical nucleus. The PDSCs of nucleus deformity, petal nucleus, internuclear bridging and megaloblastic changes in erythroid lineage, pseudo-Pelger-Huet in granulocytic lineage, and small-mononuclear megakaryocyte and lymphoid small megakaryocyte in megakaryocytic lineage were significantly higher in MDS (P < 0.05).
Comparison of ISDs in patients with MDS and non-cloned disorders
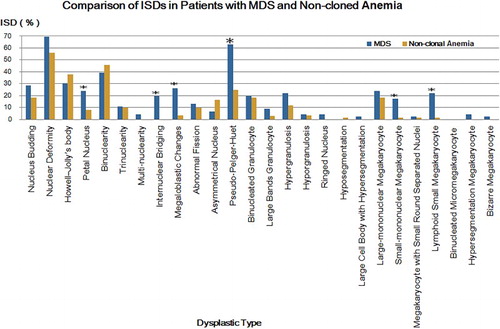
According to the comparative analysis, the ISDs of various dysplastic types all mentioned above in were higher in MDS than that of non-clonal anemia, except the Howell-Jolly’s body, binuclearity and asymmetrical nucleus. The ISDs of petal nucleus, internuclear bridging and megaloblastic changes in erythroid lineage, pseudo-Pelger-Huet in granulocytic lineage, and small-mononuclear megakaryocyte and lymphoid small megakaryocyte in megakaryocytic lineage were significantly higher in MDS (P < 0.05).
Figure 1. Comparison of PSDCs in patients with MDS and non-clonal anemia. Blue strips represent for MDS and red strips represent for non-cloned disorders. *P < 0.05, compared with that of non-clonal anemia.
Diagnostic efficacies of various dysplastic types for MDS
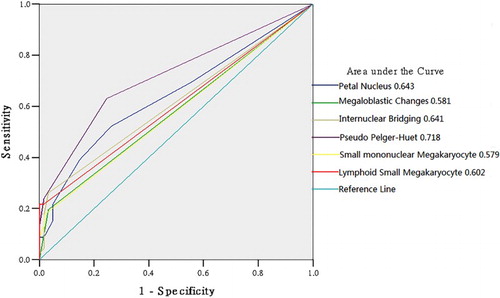
Based on the comparative analyses of both PSDC and ISD, six specific dysplastic types with statistical significances were screened out to perform a ROC curve analysis (all significantly higher in MDS compared with non-clonal anemia in both PSDC and ISD). As shown in , the area under the ROC curves (AUCs) of petal nucleus and internuclear bridging in erythroid lineage, pseudo-Pelger-Huet in granulocytic lineage and lymphoid small megakaryocyte were all greater than 0.600; while the AUCs of megaloblastic changes in erythroid lineage and small-mononuclear megakaryocyte in megakaryocytic lineage were less than 0.600 (P < 0.050), 0.581 and 0.579, respectively; In addition, the AUC of pseudo-Pelger-Huet in granulocytic lineage was the largest, at 0.718.
Figure 2. ROC curve of the PSDC in six specific dysplastic types.
As shown in above, when the PSDCs of petal nucleus and internuclear bridging in erythroid lineage, pseudo-Pelger-Huet in granulocytic lineage, and lymphoid small megakaryocyte in megakaryocytic lineage were greater than 0.015, 0.005, 0.025 and 0.005, respectively, their corresponding false positive rates (FPRs) were all lower than 0.016; moreover, when the PSDCs of petal nucleus and internuclear bridging in erythroid lineage, pseudo-Pelger-Huet in granulocytic lineage, and lymphoid small megakaryocyte in megakaryocytic lineage were greater than 0.025,0.015,0.025 and 0.015, respectively, their corresponding FPRs were all lower than 1 × 10⁻⁴.
Table 2. Diagnostic efficacies of four specific dysplastic types for MDS.
Comparison of diagnostic efficacies of dysplasia in three hematopoietic cell lineages in patient with MDS and non-clonal anemia
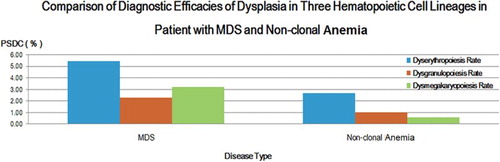
The dysgranulopoiesis rate refers to an accumulation of various granulocytic dysplastic PSDCs, as well as dyserythropoiesis rate and dysmegakaryopoiesis rate. According to the comparative analysis in , the dysplastic rates of three hematopoietic cell lineages in patients with MDS were all significantly higher than that of non-clonal anemia (P < 0.05).
Figure 3. Comparison of diagnostic efficacies of dysplasia in three hematopoietic cell lineages in patient with MDS and non-clonal anemia. Blue strips represent for erythroid lineage, red strips represent for granulocytic lineage, and green strips represent for megakaryocytic lineage.
According to , the three lineage dysplastic rate ≥10% were all higher in MDS than that of in non-clonal anemia (P < 0.05). Be that as it may, the percentage of the lineage dysplastic rate ≥10% was not that high in patients with MDS. The percentage of dyserythropoiesis rate ≥10% was 34.78%, and the other two lineages were less than 20%. As shown in , totally 36 patients (39.13%) had at least one dysplastic lineage, and most of them had cytogenetic abnormalities, a bone marrow blast percentage ≥5% and/or a ring sideroblasts percentage ≥15%.
Table 3. Case number and percentage of lineage dysplastic rate ≧10% in patients with MDS and non-clonal anemia
Table 4. Laboratory features of 92 MDS patients.
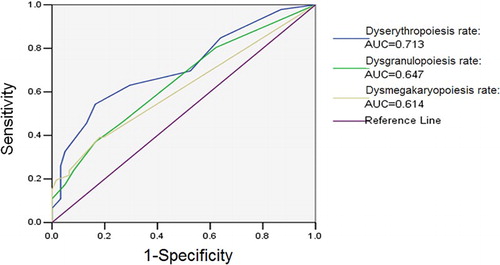
In MDS patients, the AUCs of dysgranulopoiesis rate, dyserythropoiesis rate and dysmegakaryopoiesis rate were all greater than 0.6 (P < 0.05), of which dyserythropoiesis rate was the largest one.
As shown in , when the PSDCs of dyserythropoiesis, dysgranulopoiesis and dysmegakaryopoiesis were greater than 0.100, their corresponding FPR for MDS diagnosis were 0.033, 1 × 10⁻⁴ and 1 × 10⁻⁴, respectively. According to the formula (R1−R2):[R1−(R:x)] = (P1−P2):[P1−P(R = x)] [Citation5], when the FPR was 0.05, the diagnostic points of dyserythropoiesis, dysgranulopoiesis and dysmegakaryopoiesis were 0.0649, 0.0447 and 0.000, respectively.
Table 5. Diagnostic efficacy of three lineage dysplastic rates for MDS
Discussion
As shown in and , dysplasia occurred in both MDS and non-clonal disorder patients, in which either the PSDC or the ISD of Howell-Jolly body, binuclearity, asymmetrical nucleus in patients with non-clonal anemia were higher than those of in MDS. This indicated that the incidence of dysplasia in non-clonal anemia was not low. Therefore, to screen out the significant diagnostic dysplasia for MDS, it is necessary to analyze the characteristics of various dysplastic types in these two kinds of diseases in detail.
Compared to non-clonal anemia, in these 26 kinds of common dysplastic types, the PDSCs of nuclear deformity, petal nucleus, internuclear bridging and megaloblastic changes in erythroid lineage, pseudo-Pelger-Huet in granulocytic lineage, and small-mononuclear megakaryocyte and lymphoid small megakaryocyte in megakaryocytic lineage were significantly higher in MDS (); while the ISDs of petal nucleus, internuclear bridging and megaloblastic changes in erythroid lineage, pseudo-Pelger-Huet in granulocytic lineage, and small-mononuclear megakaryocyte and lymphoid small megakaryocyte in megakaryocytic lineage were evidently higher in MDS (). Accordingly, by comprehensively analyzing these two indicators, PSDC and ISD, we considered that the petal nucleus, internuclear bridging and megaloblastic changes in erythroid lineage, pseudo-Pelger-Huet in granulocytic lineage, and small-mononuclear megakaryocyte and lymphoid small megakaryocyte in megakaryocytic lineage were reasonably significant to the distinction between MDS and non-clonal anemia.
Figure 4. Comparison of ISDs in patients with MDS and non-clonal anemia. Blue strips represent for MDS and orange strips represent for non-cloned disorders. *P < 0.05, compared with that of non-clonal anemia.
Many scholars have studied on dysplasia in MDS, and some studies which were based on the classification of MDS from WHO have proposed that the occurrence condition of various dysplastic types were associated with the subtypes of MDS. By observing the bone marrow cell morphology of 3156 patients with MDS, Germing et al. [Citation6] pointed out that anisocytosis in polychromatic erythroblasts, poikilocytes and basophilic stippling cells were more common in MDS patients. Research on MDS-RA from Liu et al. [Citation3] revealed that, in dyserythropoiesis, nuclear deformity, petal nucleus and megaloblastic changes were more common; in dysgranulopoiesis, pseudo-Pelger-Huet was common, while the large cell-body with bizarre nuclear and nuclear-cytoplasmic asynchrony were infrequent; in dysmegakaryopoiesis, lymphoid small megakaryocyte and small-mononuclear megakaryocyte were the most frequent, subsequently large-mononuclear megakaryocyte, small-mononuclear megakaryocyte and small round separated nuclear megakaryocyte; however, hypersegmentation megakaryocyte was rare.
Evidently, megaloblastic changes in dyserythropoiesis, pseudo-Pelger-Huet in dysgranulopoiesis, and lymphoid small megakaryocyte and small-mononuclear megakaryocyte in dysmegakaryopoiesis are recognized as the significant dysplastic types for the diagnosis of MDS in the literatures [Citation3,Citation4,Citation6,Citation7], which was consistent with our results. In addition, we discovered that petal nucleus and internuclear bridging in dyserythropoiesis were also meaningful to differentiate MDS from non-clonal anemia.
In view of the statistically significant differences in these six specific dysplastic types (including petal nucleus, internuclear bridging, megaloblastic changes, pseudo-Pelger-Huet, small-mononuclear megakaryocyte and lymphoid small megakaryocyte) for the distinction between MDS and non-clonal anemia, we intended to find out the most meaningful dysplastic types for the diagnosis of MDS by utilizing the ROC analysis. As shown in , we found that, petal nucleus and internuclear bridging in erythroid lineage and lymphoid small megakaryocyte in megakaryocytic lineage had a certain diagnostic values if their AUCs were more than 0.6; whereas the AUC of pseudo-Pelger-Huet in granulocytic lineage was over 0.7. In contrast, since the AUCs of megaloblastic changes in erythroid lineage and small-mononuclear megakaryocyte in megakaryocytic lineage were comparatively lower than 0.6 and their corresponding P values were relatively greater than 0.05 as well, their diagnostic values for MDS were thus slightly inferior to the previous four (P < 0.05).
Further analysis () for those four specific dysplastic types, whose AUC > 0.6 (including petal nucleus, internuclear bridging, pseudo-Pelger-Huet and lymphoid small megakaryocyte), indicated that if the PSDCs of petal nucleus, internuclear bridging, pseudo-Pelger-Huet, lymphoid small megakaryocyte were greater than 0.015, 0.005, 0.025, and 0.005, respectively, their corresponding FPRs were all lower than 0.016; moreover, if the PSDCs of petal nucleus, internuclear bridging, pseudo-Pelger-Huet and lymphoid small megakaryocyte were greater than 0.025, 0.015, 0.025 and 0.015, respectively, their corresponding FPRs were all lower than 1 × 10⁻⁴.
Combine with the empirical observation, we considered that (1) dyserythropoiesis were relatively common in both MDS and non-clonal anemia. However, some specific dysplastic types possess a relatively higher incidence rate in MDS but relatively low in non-clonal anemia. Therefore, if the dysplastic rate of such kind of specific dysplastic types exceeds a certain threshold; they have a great significance to make a definite diagnosis for MDS. (2) Although the incidence rates of dysgranulopoiesis and dysmegakaryopoiesis were relatively lower either in clonal disorders or non-clonal anemia, such kind of specific dysplastic types as pseudo-Pelger-Huet in dysgranulopoiesis and lymphoid small megakaryocyte in dysmegakaryopoiesis, due to their higher occurrence frequency in MDS, once they occur, they make a great contribution to the diagnosis of MDS. That is, whenever these specific dysplastic types occurred, MDS should be highly considered. Accordingly, we can infer that, if the bone marrow cell of a patient presents any petal nucleus and internuclear bridging in dyserythropoiesis, pseudo-Pelger-Huet in dysgranulopoiesis, or lymphoid small megakaryocyte in dysmegakaryopoiesis, and their corresponding percentages are greater than 0.015, 0.005, 0.025 and 0.005, respectively; it may be considered that the dysplasia does exist, and the patient is more likely to be diagnosed as MDS with a FPR lower than 1 × 10⁻⁴.
Dysplastic cells more than 10% in any lineages was regarded as the threshold criteria by WHO in 2008, which proposed the minimum diagnostic criteria for MDS. Up to the renewal of the diagnosis of MDS in WHO 2016 revision, this diagnostic criterion is still in use [Citation1]. As there was a significant difference in three lineage dysplastic rates between MDS and non-cloned disorders, we used ROC curve to analyze their diagnostic efficacies for MDS (). As shown in , the AUCs of the three lineage dysplastic rates were all over 0.6. Furthermore, the AUC of dysplastic rate in erythroid lineage was even more than 0.7, which was relatively higher than the other two lineages. Therefore, it was inferred that the three lineage dysplastic rates were significant to the diagnosis of MDS, and that the dysplastic rate in erythroid lineage reached the maximum diagnostic efficacy. The reason, which leads to a higher diagnostic efficacy of erythroid lineage than the other two lineages, may be probably associated with the comparatively higher presentation of dyserythropoiesis in both MDS and non-clonal anemia and the high undetected rate of either dysgranulopoiesis or dysmegakaryopoiesis in non-clonal anemia.
Figure 5. ROC curve of three lineage dysplastic rates in MDS. In MDS patients, the AUCs of dysgranulopoiesis rate, dyserythropoiesis rate and dysmegakaryopoiesis rate were all greater than 0.6 (P < 0.05), of which dyserythropoiesis rate was the largest one.
According to and , the three lineage dysplastic rates were all higher in MDS than that of in non-clonal anemia, the lineage dysplastic rate ≥10% as well. Be that as it may, the percentage of the lineage dysplastic rate ≥10% was not that high in patients with MDS. The percentage of dyserythropoiesis rate ≥10% was 34.78%, the percentages of dysgranulopoiesis ≥10% and dysmegakaryopoiesis ≥10% were less than 20%. There were totally 36 patients had at least one dysplastic lineage in the 92 MDS patients (). In addition to dysplasia, most of the MDS patients were diagnosed by some other laboratory features that matched the MDS diagnostic criteria, including the bone marrow blast cell ≥5%, ring sideroblast cell ≥15%, and cytogenetic abnormalities. The results were consistent with associated literatures [Citation8–13]. As the overall percentage of the three lineage dysplastic rate was slightly low, the application of dysplasia for the diagnosis of MDS was affected. In clinical practice, the diagnosis of MDS would be more certain if dysplasia was accompanied by definitive laboratory evidence like bone marrow blast cell ≥5%, ring sideroblast cell ≥15%, and cytogenetic abnormalities.
Moreover, in the past, if the overall percentage of dysplastic rate was <10%, the diagnosis of MDS could be made on the basis of the results from karyotype analysis and FISH. However, the updated diagnostic criteria for MDS in WHO 2016 had clearly pointed out that, in the absence of the diagnostic morphologic abnormalities, +8, −Y or del(20q) were not deemed to be the independent diagnostic factors for the diagnosis of MDS [Citation2]. In consequence, in the retrospective analysis of previous case data, after the application of the new diagnostic criteria, some case that were previously diagnosed as MDS-RA may be altered to MDS-U or even unable to diagnose. However, these cases were not enrolled in our present study.
Further analysis for the three lineage dysplastic rate (), if the FPRs for these three lineages were all 0.05, the diagnostic points were 0.065, 0.045 and 0.0400, respectively. In other words, the FPRs (1-sepcificity) for the diagnosis of MDS were all under 0.05 when these three lineage dysplastic rates were respectively higher than their diagnostic points. In addition, if their diagnostic points were more than 0.100, their corresponding FPRs were less than 0.033, 10−4 and 10−4, respectively. Thus, the diagnostic criteria ‘one or multi-lineage dysplastic cells ≥10%’ from WHO does possess high specificity for MDS. Combined with clinical practical, although there are certain dysplastic types in non-clonal disorder patients, due to their low incidence rates, it can be diagnosed as MDS (FPR < 0.033) if ‘one or multi-lineage dysplastic cells ≥10%’ presents in the bone marrow of a patient. In fact, when the dyserythropoiesis, dysgranulopoiesis and dysmegakaryopoiesis rates were more than 7.0, 5.0 and 5.0%, respectively, their corresponding FPRs for the diagnosis of MDS were already lower than 5.0% (). According to the aforementioned analysis, we had screened out the specific dysplastic types which were with a higher diagnostic efficacy for MDS (including petal nucleus, internuclear bridging, pseudo-Pelger-Huetand and lymphoid small megakaryocyte). Based on our data in this study, in the application of dysplasia for the diagnosis of MDS, combining with the clinical symptoms and the specific bone marrow dysplastic types of a patient, it is suggested to lower the diagnostic threshold if any of the higher diagnostic efficacy specific dysplastic types presents. To explore the reduction range of diagnostic threshold, a further analysis with a large sample size and various research methods is required in the future.
In short, the diagnostic value of bone marrow dysplastic morphology for diagnosis of MDS cannot be ignored. Morphology is still an important indicator for the clinical definitive diagnosis of MDS and its classification, in particular in the primary hospitals and the other institutions, in which the molecular and genetic examinations have not been fully popularized. The results from this study were considered to be utilized as clinical guidance for rapid and effective diagnosis and treatment to the related diseases. Systematically observation of various dysplastic types in different diseases, to a large extent, is more benefit to solve out the existent problems on morphological diagnosis of MDS.
Acknowledgements
The authors would like to thank all of the individuals who participated in the studies.
Disclosure statement
No potential conflict of interest was reported by the authors.
Notes on contributors
Chujia Liang is a technologist of medical laboratory, pursuing research in hematological malignancy, affiliated to the Department of Medical Laboratory, First Affiliated Hospital of Sun Yat-sen University, China.
Junxun Li is a technologist-in-charge of medical laboratory, pursuing research in hematological malignancy, affiliated to the Department of Medical Laboratory, First Affiliated Hospital of Sun Yat-sen University, China.
Jing Cheng is a technologist of medical laboratory, pursuing research in hematological malignancy, affiliated to the Department of Medical Laboratory, First Affiliated Hospital of Sun Yat-sen University, China.
Zhuangjian Ye is a technologist of medical laboratory, pursuing research in hematological malignancy, affiliated to the Department of Medical Laboratory, First Affiliated Hospital of Sun Yat-sen University, China.
Fan Zhang is a technologist of medical laboratory, pursuing research in hematological malignancy, affiliated to the Department of Medical Laboratory, First Affiliated Hospital of Sun Yat-sen University, China.
Zhe Wang is a technologist of medical laboratory, pursuing research in hematological malignancy, affiliated to the 1 Blood Cancer Cytogenetics and Genomics Laboratory, Department of Anatomical and Cellular Pathology, Price of Wales Hospital, HongKong, China.
Fang Wang is a technologist of medical laboratory, pursuing research in hematological malignancy, affiliated to the Department of Experimental Research, Collaborative Innovation Center for Cancer Medicine, Sun Yat-Sen University Cancer Center, China.
Cheng Peng is a technologist of medical laboratory, pursuing research in hematological malignancy, affiliated to the School of Health Professions, the University of Texas MD Anderson Cancer Center, United States of America.
Juan Ouyang is an associate senior technologist of medical laboratory, pursuing research in hematological malignancy, affiliated to the Department of Medical Laboratory, First Affiliated Hospital of Sun Yat-sen University, China.
ORCID
Junxun Li http://orcid.org/0000-0003-0636-9506
References
- Nomdedeu M, Pereira A, Ramos F, et al. Excess mortality in the myelodysplastic syndromes. Am J Hematol. 2017 Feb;92(2):149–154. doi: 10.1002/ajh.24606
- Arber DA, Orazi A, Hasserjian R, et al. The 2016 revision to the world health organization classification of myeloid neoplasms and acute leukemia. Blood. 2016;127:2391–2405. doi: 10.1182/blood-2016-03-643544
- Liu D, Chen Z, Xue Y, et al. The significance of bone marrow cell morphology and its correlation with cytogenetic features in the diagnosis of MDS-RA patients. Leuk Res. 2009;33:1029–1038. doi: 10.1016/j.leukres.2009.02.011
- Giagounidis A, Haase D. Morphology, cytogenetics and classification of MDS. Best Pract Res Clin Haematol. 2013;26:337–353. doi: 10.1016/j.beha.2013.09.004
- Spss I. SPSS 16.0 Base User’s Guide. Spss Inc. 2007;49:741–743.
- Germing U, Strupp C, Giagounidis A, et al. Evaluation of dysplasia through detailed cytomorphology in 3156 patients from the Düsseldorf registry on myelodysplastic syndromes. Clin Exp Immunol. 2012;175:333–335.
- Della Porta MG, Travaglino E, Boveri E, et al. Minimal morphological criteria for defining bone marrow dysplasia: a basis for clinical implementation of WHO classification of myelodysplastic syndromes. Leu. 2015;29:66–75.
- He R, Wiktor AE, Durnick DK, et al. Bone marrow conventional karyotyping and fluorescence in Situ hybridization: defining an effective utilization strategy for evaluation of myelodysplastic syndromes. Am J Clin Pathol. 2016;39:S76.
- Nazha A, Sekeres MA. Improving prognostic modeling in myelodysplastic syndromes. Curr Hematol Malig Rep. 2016;11(6):395–401. doi: 10.1007/s11899-016-0342-1
- Park JH, Kim M, Kong SY, et al. Monitoring of the clonal fraction by fluorescence in Situ hybridization in myelodysplastic syndrome: comparison with international working group treatment response criteria. Arch Pathol Lab Med. 2016;140:560–569. doi: 10.5858/arpa.2015-0150-OA
- Schemenau J, Baldus S, Anlauf M, et al. Cellularity, characteristics of hematopoietic parameters and prognosis in myelodysplastic syndromes. Eur J Haematol. 2015;95:181–189. doi: 10.1111/ejh.12512
- Ganguly BB, Dolai TK, De R, et al. Spectrum of complex chromosomal aberrations in a myelodysplastic syndrome and a brief review. J Cancer Res Ther. 2016;12(3):1203–1206.
- Cao P, Li Y, Li X, et al. Detecting chromosomal aberrations in myelodysplastic syndrome with fluorescence in situ hybridization and conventional cytogenetic analysis. Zhong Nan Da Xue Xue Bao Yi Xue Ban. 2014;39:605–611.