
Abstract
Exhaustion disorder (ED) is a stress-related disorder that often implies a great burden on the individual patient as well as on society. Previous studies have shown that ED is associated with metabolic deviations, such as lowered fasting glucose. Several mechanisms have been discussed as a plausible explanation of the lack of energy described by these patients. Metabolic processes and reduced ability to mobilize energy have been suggested as important factors. This study investigated metabolomics in 20 patients diagnosed with ED and compared them with 21 healthy controls. Plasma metabolic profiles were examined in both fasting and nonfasting (postprandial) conditions. Blood plasma samples were analyzed for metabolite content using gas chromatography mass spectrometry. A total of 62 different metabolites were simultaneously detected in each of the samples. Multivariate models indicated systematic differences between patients with ED and healthy controls in both their fasting and nonfasting plasma metabolite levels. Lysine and octadecenoic acid were more abundant and glutamine, glycine, serine and gluconic acid were less abundant in the patients across both conditions. In the present study, we comprehensively and simultaneously screen for changes in a large number of metabolites. Our results show a difference in systemic metabolites between patients with exhaustion disorder and healthy controls both in the fasting and in the postprandial states. Here, we present new potential biomarkers mirroring exhaustion disorder metabolism.
Exhaustion disorder (ED) patients suffer from stress-related symptoms including a reduced energy level. This study investigates the body’s metabolism in patients with ED, both fasting and after a meal. New potential markers that may help future investigations on ED were identified.
Lay summary
Introduction
Stress-related conditions such as exhaustion disorder and the closely related condition clinical burnout (Grossi, Perski, Osika, & Savic, Citation2015) are becoming increasingly common in Sweden and other countries. One of the core symptoms reported by these patients is the extreme fatigue and lack of energy that has developed over months and sometimes years and clinically reported to be long lasting (Glise, Ahlborg, & Jonsdottir, Citation2012, Citation2014; Grossi et al., Citation2015). Despite considerable efforts, no one has yet been able to pinpoint the biological mechanisms that plausibly could explain the exhaustion reported by patients with ED/clinical burnout (Danhof-Pont, van Veen, & Zitman, Citation2011).
Previous studies of disease processes in stress-related illnesses have largely focused on the hypothalamic–pituitary–adrenal-axis (HPA axis) and secretion of stress hormones. The results have been contradictory and no single biomarker of stress-related illness has emerged (Danhof-Pont et al., Citation2011; Grossi et al., Citation2015; Kudielka, Bellingrath, & Hellhammer, Citation2006; Pruessner, Hellhammer, & Kirschbaum, Citation1999). Although the main symptoms of stress-related conditions are exhaustion, lack of energy, and fatigue that is no longer responsive to normal periods of rest (Sonnenschein, Sorbi, van Doornen, Schaufeli, & Maas, Citation2007), much less attention has been directed at elucidating metabolic processes and the ability to mobilize energy. We have found indications of metabolic changes in patients with ED, in terms of lowered fasting glucose as well as elevated insulin levels in male patients compared with healthy controls (Sjors, Jansson, Eriksson, & Jonsdottir, Citation2013). Our findings suggest that metabolic changes may have occurred in patients with ED, possibly resulting in an inability to mobilize energy.
To our knowledge, no previous study has examined the metabolic functions in clinical populations of patients with stress-related exhaustion or clinical burnout. Whether changes in metabolic functions are part of the disease mechanisms in these stress-related illnesses is thus entirely unexplored. To obtain a comprehensive picture of the metabolism, we therefore performed metabolomics analysis.
The human metabolome is defined as the complete set of small molecules (e.g. amino acids, fatty acids, mono- and di-carbohydrates, etc.) formed as end products of the metabolism (Dunn and Ellis, Citation2005). Metabolomics with gas chromatography coupled to mass spectrometry (GC-MS) is a technique for screening a large number of metabolites simultaneously. This technology is ideal for the identification of diagnostic biomarkers and provides us with the opportunity to generate hypotheses about specific deviations in various metabolic processes that plausibly could be associated with ED. In the field of stress-related illness, metabolomics studies are sorely lacking. Animal studies of chronic stress, usually referred to as animal models of depression, have found that stressed individuals have a metabolic profile different from nonstressed controls (Shao et al., Citation2013; Wang et al., Citation2009). A few studies where metabolomics has been used to separate patients with major depressive disorder (MDD) from controls have concluded that metabolomics has the potential to be used as a diagnostic tool for depression (Paige, Mitchell, Krishnan, Kaddurah-Daouk, & Steffens, Citation2007; Zheng et al., Citation2012). Although ED and MDD are partly overlapping conditions, there are differences between the conditions that make generalization of findings inappropriate (Glise et al., Citation2012; Grossi et al., Citation2015).
The aim of the study was to investigate metabolic functions in patients diagnosed with ED and to compare them with healthy controls. Plasma metabolic profiles were examined in both fasting and in the nonfasting conditions. We hypothesized that there are systematic differences in the metabolome between patients with ED and healthy controls.
Material and methods
Participants
Twenty individuals with ED (10 men and 10 women) and 21 healthy subjects (9 men and 12 women) were included in the study. The patients were recruited at a specialized outpatient clinic at the Institute of Stress Medicine, Gothenburg, Sweden. They were ambulatory at the time of the study, and none had received in-patient care for their illness. All the patients fulfilled the diagnostic criteria for stress-related exhaustion disorder (ICD-10 code F43.8), as described in Box 1, and they had a maximal duration of sick leave of six months. Exhaustion disorder is the equivalent of “clinical burnout” (Grossi et al., Citation2015), but since burnout is not an established diagnosis, we chose to include patients based on the ED criteria (Box 1). Exhaustion disorder is defined as physical and mental exhaustion experienced for at least two weeks, caused by exposure to one or more stressors for a minimum of six months. Cardinal features are markedly reduced energy, impaired cognitive functioning and reduced capacity to meet demands. Several symptoms overlap with other stress-related conditions, such as fibromyalgia, post-traumatic stress syndrome, and chronic fatigue syndrome, and care was taken to ensure that the patients did not fulfill the diagnostic criteria for these conditions. The controls were recruited from a cohort study, surveying psychosocial work environment and health, and through advertising in a local daily newspaper. Only individuals reporting ‘‘no stress at all’’ or ‘‘only a little stress’’ on a single perceived stress item (Elo, Leppänen, & Jahkola, Citation2003) were included as controls in order to avoid inclusion of individuals suffering from chronic stress problems. To be included in the study, subjects had to be between 30 and 50 years of age. For both patients and controls, exclusion criteria were; a body mass index less than 18.5 kg/m2 or over 30 kg/m2, high blood pressure, infection, menopause, pregnancy, nursing, vitamin B-deficiency (high homocysteine), known systemic disease such as diabetes or thyroid disease or known psychiatric disease. Subjects who were taking estrogen, psychoactive medications or any medications with systemic effects were excluded.
Box 1 Diagnostic criteria for Exhaustion Disorder as proposed by the Swedish National Board of Health and Welfare.
The study was approved by the Regional Ethical Review Board in Gothenburg, Sweden, and was conducted according to the Helsinki Declaration. All participants gave written informed consent before entering the study.
Procedure
All participants underwent two examinations at the Institute of stress medicine, Gothenburg, Sweden. The first visit comprised a physical examination and blood sampling. A research nurse measured height, weight, waist and hip circumference for waist-to-hip ratio (WHR) and body mass index (BMI) calculations. Waist circumference was measured at the narrowest point between the iliac crest and the umbilicus. Hip circumference was measured at the maximum buttocks. BMI was computed based on the ratio of the weight in kilograms to height in meters squared (kg/m2). Blood was drawn by a research nurse between 7:30 and 10:00 after fasting since 22:00 the day before.
The second visit was performed under a nonfasting condition. It included a psychosocial stress challenge and multiple blood samples were obtained during the test. In the present study, only the baseline samples, taken before the participants were informed of the nature of the stress test, were included. All women performed the test in the follicular phase of the menstrual cycle. Two hours before the blood sampling, the participants had a standardized meal provided by the research staff (2000 kJ/500 kcal, fat 10–15 g, carbohydrates 70 g, protein 20 g). Before both visits, the participants were instructed to abstain from tobacco use on the sampling day and to avoid heavy physical exertion and alcohol consumption the day before the visit. Plasma samples were drawn from an antecubital vein in EDTA tubes and centrifuged at 4 °C, 1835 g for 15 min. The blood plasma samples were allocated in prelabeled tubes in aliquots of 1 ml and stored at −80 °C until assayed.
Processing of samples
Prior to extraction, samples were allowed to thaw at room temperature and then put on ice. Next 225 µl of the extraction buffer (methanol/water 9:1, with 1 l IS each of the concentration 7 ng/µl) was added to 50 µl of the serum sample. The mixtures were vortexed for approximately 10 seconds and extracted in a bead mill (MM301 vibration mill, Retsch GmbH & Co. KG, Haan, Germany) at 30 Hz for 2 minutes. After 2 hours at 4 °C on ice, samples were centrifuged at 14000 rpm for 10 minutes at 4 °C. A 100 µl aliquot was transferred to a GC vial and evaporated using a speedvac to dryness. Methoxymation with 30 µl methoxyamine solution in pyridine (15 µg/µl) was carried out in room temperature for 1 hour, after which 30 µl of heptanes (with 0.5 µg of methyl stearate as injection IS) were added (Jonsson et al., Citation2006; Wibom et al., Citation2010).
Chemicals
The chemicals used for sample preparation were all of analytical grade, unless otherwise stated. The stable isotope labeled internal standard compound (IS) 13C5-proline, 2H4-succinic acid, 13C5, 15N-glutamic acid, 1,2,3-13C3 myristic acid, 2H7-cholesterol and 13C4 disodium alpha-ketoglutarate were purchased from Cambridge Isotope Laboratories, (Andover, MA, USA); 13C12-sucrose, 13C4-palmitic acid and 2H4-butanediamine.2HCl were from Campro (Veenendaal, The Netherlands); 13C6-glucose was from Aldrich (Steinheim, Germany) and 2H6-salicylic acid was from Icon (Summit, NJ, USA). Stock solutions of the IS were prepared either in purified and deionized water (Milli-Q, Millipore, Billerica, MA, USA) or in Methanol (J.T. Baker, Deventer, Holland) at the same concentration 0.5 µg/µl. Metyl stearate was purchased from Sigma (St. Louis, MO, USA). N-Metyl-N-trimethylsilyltriflouroacetamide (MSTFA) with 1% trimethylchlorosilane (TMCS) and pyridine (silylation grade) were purchased from Pierce Chemical Co. Heptane was purchased from Fisher Scientific (Loughborough, UK).
Gas chromatography time of flight mass spectrometry (GC-TOF-MS)
GC-MS is the most established method when it comes metabolomics screening with its high sensitivity, high peak resolution and availability of databases and spectral libraries. A 1 µl aliquot of derivatised sample was injected in splitless mode by Agilent 7683 Series autosampler (Aligent, Atlanta, GA) into an Aligent 6980 GC equipped with a 10 m x 0.18 mm i.d. fused-silica capillary column chemically bonded with 0.18 µm DB5-MS stationary phase (J&W Scientific, Folsom, CA). The injector temperature was 270˚C. The carrier gas was helium, set at a constant flow of 1 mL/min through the purge flow rate of 20 ml/min and an equilibrant time of 1 minute. The column temperature was initially kept at 70˚C for 2 minutes and then increased from 70˚C to 320˚C at 30˚C/min, where it was kept for 2 minutes. The effluent from the column was introduced to the ion source of Pegasus III TOF-MS (Leco Corp., St Joseph, MI). The transfer temperature was set at 250˚C and the ion source temperature at 200˚C. Ions were generated by a 70 eV electron beam at a current of 2.0 mA. Masses were acquired from m/z 50 to 800 at a rate of 30 spectra per second, and the acceleration voltage was turned on after a solvent delay of 165 seconds. Retention indexes were calculated from the retention times obtained from the injection of a homologous series of n-alkanes (C12-C32) for each batch. All samples were run in randomized order (Wibom et al., Citation2010).
Hierarchical multivariate curve resolution
Analyzing complex samples gives rise to overlapping peaks in the GC-chromatograms and thus mixed mass spectra from the TOF-MS analysis. To solve this problem a multivariate curve resolution method named hierarchical multivariate curve resolution (H-MCR) together with an internal validation step in the H-MCR algorithm (Thysell, Chorell, Svensson, Jonsson, & Antti, Citation2012) was used, assuring extraction of robust and reliable metabolite profiles. In short, the H- MCR generates a matrix where all MD samples are described by a common set of variables, each representing one metabolite (Jonsson et al., Citation2006). Subsequently, the data was subjected to multivariate data analysis as presented below.
Scoring of burnout symptoms
Burnout symptoms were measured using the Shirom–Melamed Burnout Questionnaire (SMBQ). The questionnaire includes 22 items measuring five different aspects of burnout, including physical fatigue, emotional exhaustion, tension, listlessness and cognitive weariness (Melamed, Kushnir, & Shirom, Citation1992). A mean burnout index is calculated for each participant. The index can range from 1 to 7. The SMBQ correlates strongly with the Maslach Burnout Inventory (Grossi, Perski, Evengård, Blomkvist, & Orth-Gomér, Citation2003), the most widely used instrument for measurement of burnout.
Statistical analysis
Background variables were compared between groups using one-way ANOVA and Chi-square tests. Univariate tests of differences in metabolite abundance between patients and controls were made with Mann–Whitney U-test, since the data were not normally distributed. For these tests, the level of significance was set at p < .05. Because of the relatively small sample sizes and the exploratory nature of the study, these p values were not adjusted for multiple comparisons. The analyses were conducted with IBM SPSS statistics version 22 (IBM Corp., Armonk, NY).
Multivariate data analysis
Systematic differences in plasma metabolite content were modeled and interpreted for complex interactions using both unsupervised principal component analysis (PCA) and supervised orthogonal partial least-squares with discriminant analysis (OPLS-DA) (Trygg & Wold, Citation2002). PCA displays the internal correlations in the data in a way that maximizes the explained variation, thus grouping observations that share a similar variation structure independently of group. OPLS-DA separates the systematic variation among the metabolites that is directly related to group separation from variation not related, or orthogonal, to group separation. In this study, the internal correlation structure within each group (patients and control) was first visualized by PCA to identify possible outliers in the data (data not shown). Then, one PCA model with all groups was constructed in order to visualize the internal correlation structure in x-space of the whole dataset. Thereafter, OPLS-DA models were constructed to separate the systematic variation among the metabolites that is directly related to group separation.
For each condition, that is, fasting and nonfasting, an OPLS-DA model was created with metabolites as the predictor variables (X) and group belonging as the response matrix (Y).
Metabolites with value p cross validated 95% confidence intervals were not including 0 for the predictive component in the models. All multivariate statistical analyses were performed with SIMCA version 14.1 (Umetrics AB, Umeå, Sweden).
Pathway analysis
Pathway analysis was performed on the MetaboAnalyst 3.6 server (http://www.metaboanalyst.ca) (Xia & Wishart, Citation2002). Metabolites with VIP >1 according to the OPLS-DA models were used as input.
Results
The patients were slightly older and had a higher BMI than the controls (). WHR did not differ between groups.
Table 1. Descriptives.
Blood plasma samples were analyzed for metabolite content using gas chromatography mass spectrometry. A total of 62 different metabolites were simultaneously detected in each of the samples, a relevant number according to method of choice. Predictive loading values and variable of importance measures (VIP) for all metabolites are given in Supplement 1.
Fasting condition
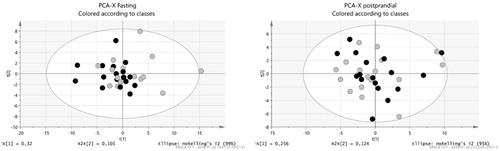
From the initial 41 participants, 33 had analyzable data from the fasting condition (17 controls and 16 patients). The PCA of fasting plasma metabolites resulted in a two component model (R2X(cum) = 0.602) with no dominant clusters or outliers ().
Figure 1. Principal component analysis (PCA) plots for the fasting and the postprandial condition. Grey circles are ED patients and the black circles controls.
The OPLS-DA model resulted in a significant component (R2(cum) = 0.83, Q2(cum) = 0.116 (). Twenty-seven of the metabolites were variables of importance for the systematic separation of groups in the fasting condition (). In the patient group, the metabolites that according to the variable of importance (VIP) measure were more abundant in the patient group were: the amino acid lysine and the fatty acids hexadecanoic acid, octadecenoic acid, octadecadienoic acid, and dodecanoic acid. The other metabolites with a variable of importance greater than 1 () were more abundant in the healthy controls, that is, patients suffering from ED show lower systemic levels of the metabolites cysteine, tryptophan, glycine, glutamine, arabitol, xylitol, gluconic acid, phenylalanine, 1,5-anhydro-D-glucitol, methionine, scyllo-inositol, ribitol, citrulline,pyroglutamic acid, 4-hydroxyphenylacetic acid, gamma-tocopherol, citric acid, asparagine, aconitic acid, serine and gluconic acid (). All detected metabolites and their systematic correlation separated on the x-axis are visualized in . Metabolites to the right are more abundant in ED patients, metabolites to the left are more abundant in healthy controls, and metabolites close to the y-axis are equally abundant in patients and controls.
Figure 2. Loadings scatter plot visualizing the metabolite distribution in fasting. Healthy control subjects to the left (negative values) and ED patients to the right (positive values).
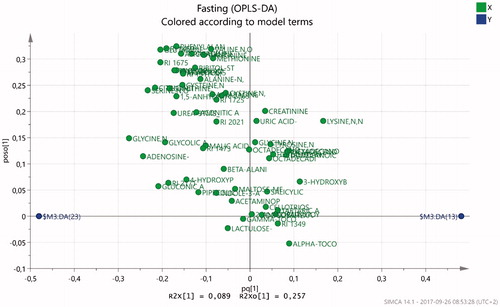
Figure 3. Metabolites identified by gas chromatography mass spectrometry (GC-MS) analysis. Metabolites of importance according to OPLS-DA analysis (Variable of Importance (VIP) > 1) are marked with arrows indicating higher (?) or lower (?) abundance in ED patients. A = fasting, B = nonfasting.
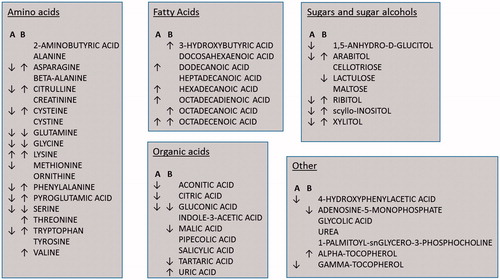
Table 2. OPLS metabolic compounds of importance for the fasting model.
The differences in metabolite abundance were further validated by univariate analysis (Mann whitney) of the metabolites with VIP >1. Results show that glycine (p = .031), citric acid (p = .015) and serine (p = .037) were significantly lower in patients.
Non-fasting condition
In this condition, 36 participants had analyzable data (19 controls and 17 patients). The PCA resulted in a two component model (R2X(cum) = 0.673) with no dominant clusters and one single outlier that was excluded from further analyses ().
The OPLS-DA model resulted in a two component model (R2(cum) = 0.837, Q2(cum) = 0.268). In the non-fasting condition, 29 metabolites emerged as variables of importance for the systematic separation of groups (). shows a visualization of the relation between metabolites in the non-fasting condition. The most important metabolites that were more abundant in the patients, according to VIP, were lysine, uric acid, inositol, citrulline, valine, 3-hydroxybutyric acid, ribitol, octadecenoic acid, alpha-tocopherol, phenylalanine, pyroglutamic acid, arabitol, xylitol, cysteine, tryptophan, threonine, octadecenoic acid and asparagine. More abundant in the control group were adenosine-5-monophosphate, glycine, gluconic acid, malic acid, serine, lactulose, glutamine and tartaric acid ().
Figure 4. Loadings scatter plot visualizing the metabolite distribution in nonfasting. Healthy control subjects to the left (negative values) and ED patients to the right (positive values).
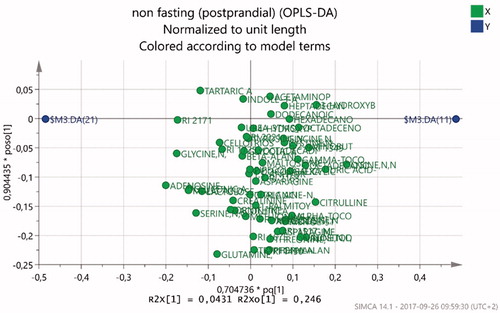
Table 3. OPLS metabolic compounds of importance for the nonfasting model.
Univariate Mann–Whitney tests of the metabolites with VIP >1 confirmed that lysine (p = .035), scyllo-inositol (p = .042), octadecanoic acid (p = .049), and pyroglutamic acid (p = .015) were significantly higher in patients.
Pathway analysis
The results of the MetaboAnalyst pathway analysis are presented in Supplement 2 and 3. The most important metabolic pathways in both the fasting and non-fasting condition were the aminoacyl-tRNA biosynthesis, nitrogen metabolism, cyanoamino acid metabolism, and glycine, serine and threonine metabolism.
Discussion
The OPLS-DA models indicated systematic differences between patients with ED and healthy controls in both their fasting and nonfasting plasma metabolite levels. Comparing data from fasting and non-fasting conditions, a number of metabolites were uniform irrespective of dietary intake: lysine and octadecenoic acid levels were higher and glutamine, glycine, serine and gluconic acid were lower in ED patients ().
Metabolite profiles showing the systematic difference between in the two groups in the fasting condition presents a low Q2 value. This can be explained by an overweight of metabolites in the healthy group in the model (). This could reflect a decrease in cellular activity of the patient group, since metabolites are the end products of all cellular processes and a direct outcome of enzymatic and protein activity. Only a few metabolites were more abundant in ED patients at fasting, namely the amino acid lysine together with a number of fatty acids presented in .
Amino acid metabolites of importance according to the OPLS-DA models were generally more abundant in the healthy subjects in the fasting condition, whereas a more mixed pattern was seen in the non-fasting condition. The exception was lysine, which was more abundant in ED patients in both conditions. All of the metabolic pathways that emerged in the MetaboAnalyst analyses involve amino acids. Consequently, the pathway analysis indicated that aminoacyl-tRNA biosynthesis, nitrogen metabolism, cyanoamino acid metabolism, and glycine, serine and threonine metabolism were decreased in fasting ED patients. In the non-fasting condition, however, we did not see a consistent pattern of higher or lower abundance of metabolites in these pathways. These results call for further investigation of amino acid metabolism in this patient group.
After eating a standardized meal, lysine remained pronounced among ED patients in the systematic multivariate model. Several amino acids that were less abundant in ED patients in the fasting condition shifted to being more abundant in the ED patients in the non-fasting measurement. Lysine is an amino acid that has anxiolytic action, known to reduce anxiety through its actions in the amygdala (Smriga and Torii, Citation2003). Lysine supplement has been shown to reduce trait anxiety and dampen the acute stress response in humans with lysine deficiency (Smriga, Ghosh, Mouneimne, Pellett, & Scrimshaw, Citation2004). In healthy males, state and trait anxiety as well as basal salivary cortisol were reduced after one week L-lysine and L-arginine supplementation (Smriga et al., Citation2007). L-lysine and L-arginine supplementation has also been found to increase neuroendocrine responses to acute psychosocial stress in subjects with high trait anxiety (Jezova, Makatsori, Smriga, Morinaga, & Duncko, Citation2005). Smriga and colleagues hypothesized that lysine acts as a partial serotonin receptor 4 antagonist and simultaneously as a partial benzodiazepine agonist (Smriga et al., Citation2007). High lysine abundance in ED patients could indicate desensitization of receptors. It could also be due to a compensatory increase in lysine metabolism to counteract the long term stress effects, although this needs to be further elucidated. In addition, the small intestine absorbs amino acids, though small amounts escape assimilation into the small intestine to be subsequently used by microbiota in the colon, or transported from the lumen into the portal blood stream (Evenepoel et al., Citation1999). Lysine is also a product of gut microbiotic activity and an indicator of nitrogen rich diet together with other essential amino acids (Metges, Citation2000). An increased abundance of lysine might hence be due to altered gut microbiotic activity.
Other amino acids; serine, glutamine and glycine, were less abundant in ED patients in the present study, both in fasting and after a standardized meal. These are nonessential amino acid produced in the body during normal conditions. All three are involved in the aminoacyl-tRNA biosynthesis pathway, glycine and serine are part of the cyanoamino acid metabolism, and glycine, serine and threonine metabolism pathways, whereas glutamine is part of the nitrogen metabolism pathway. Glycine, together with serine is an excitatory neurotransmitter in the peripheral nervous system acting as required co-agonists together with glutamate in NMDA receptors (Cummings & Popescu, Citation2015). Glutamine participates in anabolic processes and the lower abundance in the patient group could be indicative of a slowing of the healing, anabolic processes due to prolonged stress (Jepson, Bates, Broadbent, Pell, & Millward, Citation1988a, Citation1988b). The reduction of glutamine could be indicative of a lower nitrogen metabolism. The connection to the nitrogen metabolism pathway, which emerged as a significant pathway in both conditions, also poses questions about nitrogen balance. It would be valuable to further investigate protein- and nitrogen metabolism in ED.
Tryptophan is another essential amino acid that in the present study was less abundant in the fasting ED patients although more abundant after a standardized meal. Tryptophan has previously been found to be lower together with GABA and lysine in first-onset treatment-naïve patients with major depressive disorder Xu et al. (Citation2012). This finding coheres with our present result in terms of fasting tryptophan abundance but is opposes to the result on lysine abundance indicating that major depression and ED might have different pathology.
Fatty acids were generally more abundant in the blood stream of the patient group, although the fatty acids with VIP >1 varied between conditions. There were also indications of increased fatty acid biosynthesis according to pathway analysis (Supplement 2 and 3). Octadecenoic acid is the most abundant fatty acid in human adipose tissue (Kokatnur, Oalmann, Johnson, Malcom, & Strong, Citation1979) and was more abundant in ED patients both in fasting and after a standardized meal. Octadecenoic acid is the metabolite of linoic acid after gut micobiota metabolism. This metabolite (Goto et al., Citation2015) can stimulate adipogenesis and affect lipid rafts in the cell membranes that facilitates insulin signaling (Simons and Toomre, Citation2000). A high abundance of hexadecanoic acid (palmitic acid) has been shown to induce anxiety-like behaviors in mice (Moon et al., Citation2014). Results remain inconclusive and more studies needs to be performed to understand the exact mechanisms.
Several metabolites connected to the carbohydrate metabolism, that is, gluconic acid, scyllo-inositol, arabitol, 1,5-anhydro-d-glycitol, xylitol and ribitol, were more abundant in the healthy individuals in the fasting condition. This is in accordance with the known reduction in fasting glucose shown in this specific patient group (Sjors et al., Citation2013), indicating an overall reduction of systemically abundant carbohydrates. A lower catabolism of glucose would also explain the lower abundance of gluconic acid (or gluconate) seen across both conditions. However, in the non-fasting condition, scyllo-inositol, arabitol, xylitol, and ribitol, were instead more abundant in the ED patients.
The present study shows that metabolites essential for humoral functions are overall less abundant in ED patients compared to healthy controls. This indicates an overall systematic metabolic component of ED with potential biological markers to be further elucidated.
Given the overlap in symptoms between ED and MDD, comparisons with plasma metabolomics studies of MDD are warranted. Zheng et al. (Citation2012) found higher lipid/protein complex abundance, lower levels of individual amino acids, and lower levels of certain lipid metabolism and energy metabolism related molecules in fasting MDD patients. In a recent study by Kawamura et al. (Citation2018), all candidate metabolites were significantly reduced in MDD, the most important being phosphoethanolamine, followed by taurine and several amino acids (including lysine). On the other hand, Liu et al. (Citation2016) found that a majority of their selected metabolites (48 of 56 metabolites) were increased in MDD (melancholic subtype). There are a few studies of metabolic profiles in other stress-related medical conditions, that is, conditions that are either caused by or worsened by stress exposure, such as post-traumatic stress disorder (PTSD), chronic fatigue syndrome (CFS) and fibromyalgia or other chronic pain conditions. A targeted liquid chromatography metabolomics study of plasma from patients with CFS showed abnormalities in 20 metabolic pathways (Naviaux et al., Citation2016). Eighty percent of the diagnostic metabolites were decreased, revealing a chemical signature consistent with a hypometabolic syndrome. We did not see such a consistent pattern of lower abundance across various metabolic pathways in ED patients. One preliminary study analyzed metabolites in PTSD subjects (Karabatsiakis et al., Citation2015). They discovered 13 changed metabolites, including four glycerophospholipids, and one metabolite involved in endocannabinoid signaling. However, comparisons between studies are difficult since the metabolites detected differ between studies depending on the metabolomics method; for example, whether liquid chromatography or gas chromatography was used. A thorough comparison with related medical disorders, such as MDD, fibromyalgia, CFS and PTSD, will be needed to validate the universality and specificity of our findings.
Limitations
This study was part of a larger study investigating acute stress reactions in ED patients, which implied several limitations in the design of the study. Ideally, the fasting and non-fasting measurements should be performed in sequence on the same day to fully capture postprandial effects. The participants were not fasting before the standardized meal in the nonfasting condition. We did not have control of the participants’ regular diet and physical activity before the study.
The statistical analyses performed in this study did not control for the observed differences in age and BMI between patients and controls. Both these factors could potentially confound the results and should be controlled for in future studies.
Conclusions
The present study gives a comprehensive view of plasma metabolite profiles in stress-related exhaustion disorder. The models and results obtained at fasting and after eating a standardized meal were different in several respects, although some metabolites showed a consistent pattern and remained unaffected by the diet intake. Lysine and octadecenoic acid were more abundant and glutamine, glycine, serine and gluconic acid were less abundant in the ED patients across both conditions. Our results comprehensively present new potential biomarkers mirroring exhaustion disorder metabolism.
Supplemental data
Download MS Word (26.7 KB)Disclosure statement
No potential conflict of interest was reported by the authors.
Additional information
Funding
Related Research Data
References
- Cummings, K.A., & Popescu, G.K. (2015). Glycine-dependent activation of NMDA receptors. The Journal of General Physiology, 145, 513–527. doi:10.1085/jgp.201411302
- Danhof-Pont, M.B., van Veen, T., & Zitman, F.G. (2011). Biomarkers in burnout: A systematic review. Journal of Psychosomatic Research, 70, 505–524. doi:10.1016/j.jpsychores.2010.10.012
- Dunn, W.B., & Ellis, D.I. (2005). Metabolomics: Current analytical platforms and methodologies. TrAC Trends in Analytical Chemistry, 24, 285–294. doi:http://dx.doi.org/10.1016/j.trac.2004.11.021
- Elo, A.L., Leppänen, A., & Jahkola, A. (2003). Validity of a single-item measure of stress symptoms. Scandinavian Journal of Work, Environment & Health, 29, 444–451. doi:10.5271/sjweh.752
- Evenepoel, P., Claus, D., Geypens, B., Hiele, M., Geboes, K., Rutgeerts, P., & Ghoos, Y. (1999). Amount and fate of egg protein escaping assimilation in the small intestine of humans. American Journal of Physiology - Gastrointestinal and Liver Physiology, 277, G935. doi:10.1152/ajpgi.1999.277.5.G935
- Glise, K., Ahlborg, G., & Jonsdottir, I. (2012). Course of mental symptoms in patients with stress-related exhaustion: Does sex or age make a difference?. BMC Psychiatry, 12, 18. doi:10.1186/1471-244X-12-18
- Glise, K., Ahlborg, G., & Jonsdottir, I.H. (2014). Prevalence and course of somatic symptoms in patients with stress-related exhaustion: does sex or age matter. BMC Psychiatry, 14, 118–118. doi:10.1186/1471-244X-14-118
- Goto, T., Kim, Y.-I., Furuzono, T., Takahashi, N., Yamakuni, K., Yang, H.-E., … Kawada, T. (2015). 10-oxo-12(Z)-octadecenoic acid, a linoleic acid metabolite produced by gut lactic acid bacteria, potently activates PPARgamma and stimulates adipogenesis. Biochemical and Biophysical Research Communication, 459, 597–603. doi:10.1016/j.bbrc.2015.02.154
- Grossi, G., Perski, A., Evengård, B., Blomkvist, V., & Orth-Gomér, K. (2003). Physiological correlates of burnout among women. Journal of Psychosomatic Research, 55, 309–316. doi:10.1016/S0022-3999(02)00633-5
- Grossi, G., Perski, A., Osika, W., & Savic, I. (2015). Stress-related exhaustion disorder – clinical manifestation of burnout? A review of assessment methods, sleep impairments, cognitive disturbances, and neuro-biological and physiological changes in clinical burnout. Scandinavian Journal of Psychology, 56, 626–636. doi:10.1111/sjop.12251
- Jepson, M.M., Bates, P.C., Broadbent, P., Pell, J.M., & Millward, D.J. (1988a). Relationship between glutamine concentration and protein synthesis in rat skeletal muscle. American Journal of Physiology, 255, E166–E172. doi:10.1152/ajpendo.1988.255.2.E166
- Jepson, M.M., Bates, P.C., Broadbent, P., Pell, J.M., & Millward, D.J. (1988b). Relationship between glutamine concentration and protein synthesis in rat skeletal muscle. American Journal of Physiology - Endocrinology and Metabolism, 255, E166–E172. doi:10.1152/ajpendo.1988.255.2.E166
- Jezova, D., Makatsori, A., Smriga, M., Morinaga, Y., & Duncko, R. (2005). Subchronic treatment with amino acid mixture of L-lysine and L-arginine modifies neuroendocrine activation during psychosocial stress in subjects with high trait anxiety. Nutritional Neuroscience, 8, 155–160.
- Jonsson, P., Johansson, E.S., Wuolikainen, A., Lindberg, J., Schuppe-Koistinen, I., Kusano, M., … Antti, H. (2006). Predictive metabolite profiling applying hierarchical multivariate curve resolution to GC − MS data a potential tool for multi-parametric diagnosis. Journal of Proteome Research, 5, 1407–1414. doi:10.1021/pr0600071
- Karabatsiakis, A., Hamuni, G., Wilker, S., Kolassa, S., Renu, D., Kadereit, S., … Kolassa, I.-T. (2015). Metabolite profiling in posttraumatic stress disorder. Journal of Molecular Psychiatry, 3, 2. doi:10.1186/s40303-015-0007-3
- Kawamura, N., Shinoda, K., Sato, H., Sasaki, K., Suzuki, M., Yamaki, K., … Ohashi, Y. (2018). Plasma metabolome analysis of patients with major depressive disorder. Psychiatry and Clinical Neurosciences, 72, 349–361. doi:10.1111/pcn.12638
- Kokatnur, M.G., Oalmann, M.C., Johnson, W.D., Malcom, G.T., & Strong, J.P. (1979). Fatty acid composition of human adipose tissue from two anatomical sites in a biracial community. The American Journal of Clinical Nutrition, 32, 2198–2205. doi:10.1093/ajcn/32.11.2198
- Kudielka, B.M., Bellingrath, S., & Hellhammer, D.H. (2006). Cortisol in burnout and vital exhaustion: An overview. Giornale Italiano Di Medicina Del Lavoro Ed Ergonomia, 28, 34–42.
- Liu, Y., Yieh, L., Yang, T., Drinkenburg, W., Peeters, P., Steckler, T., … Ye, J. (2016). Metabolomic biosignature differentiates melancholic depressive patients from healthy controls. BMC Genomics, 17, 669. doi:10.1186/s12864-016-2953-2
- Melamed, S., Kushnir, T., & Shirom, A. (1992). Burnout and risk factors for cardiovascular diseases. Behavioral Medicine (Washington, D.C.), 18, 53–60. doi:10.1080/08964289.1992.9935172
- Metges, C.C. (2000). Contribution of microbial amino acids to amino acid homeostasis of the host. The Journal of Nutrition, 130, 1857S–1864S. doi:10.1093/jn/130.7.1857S
- Moon, M.L., Joesting, J.J., Lawson, M.A., Chiu, G.S., Blevins, N.A., Kwakwa, K.A., & Freund, G.G. (2014). The saturated fatty acid, palmitic acid, induces anxiety-like behavior in mice. Metabolism, 63, 1131–1140. doi:10.1016/j.metabol.2014.06.002
- Naviaux, R.K., Naviaux, J.C., Li, K., Bright, A.T., Alaynick, W.A., Wang, L., … Gordon, E. (2016). Metabolic features of chronic fatigue syndrome. Proceedings of the National Academy of Sciences, 113, E5472–E5480. doi:10.1073/pnas.1607571113
- Paige, L.A., Mitchell, M.W., Krishnan, K.R.R., Kaddurah-Daouk, R., & Steffens, D.C. (2007). A preliminary metabolomic analysis of older adults with and without depression. [Article]. International Journal of Geriatric Psychiatry, 22, 418–423. doi:10.1002/gps.1690
- Pruessner, J.C., Hellhammer, D.H., & Kirschbaum, C. (1999). Burnout, perceived stress, and cortisol responses to awakening. Psychosomatic Medicine, 61, 197–204. doi:10.1097/00006842-199903000-00012
- Shao, W.H., Fan, S.H., Lei, Y., Yao, G.E., Chen, J.J., Zhou, J., … Xie, P. (2013). Metabolomic identification of molecular changes associated with stress resilience in the chronic mild stress rat model of depression. Metabolomics, 9, 433–443. doi:10.1007/s11306-012-0460-2
- Simons, K., & Toomre, D. (2000). Lipid rafts and signal transduction. Nature Reviews Molecular Cell Biology, 1, 31–39. doi:10.1038/35036052
- Sjors, A., Jansson, P.A., Eriksson, J.W., & Jonsdottir, I.H. (2013). Increased insulin secretion and decreased glucose concentrations, but not allostatic load, are associated with stress-related exhaustion in a clinical patient population. Stress, 16, 24–33. doi:10.3109/10253890.2012.688082
- Smriga, M., Ando, T., Akutsu, M., Furukawa, Y., Miwa, K., & Morinaga, Y. (2007). Oral treatment with L-lysine and L-arginine reduces anxiety and basal cortisol levels in healthy humans. Biomedical Research, 28, 85–90. doi:10.2220/biomedres.28.85
- Smriga, M., Ghosh, S., Mouneimne, Y., Pellett, P.L., & Scrimshaw, N.S. (2004). Lysine fortification reduces anxiety and lessens stress in family members in economically weak communities in Northwest Syria. Proceedings of the National Academy of Sciences of the United States of America, 101, 8285–8288. doi:10.1073/pnas.0402550101
- Smriga, M., & Torii, K. (2003). l-Lysine acts like a partial serotonin receptor 4 antagonist and inhibits serotonin-mediated intestinal pathologies and anxiety in rats. Proceedings of the National Academy of Sciences, 100, 15370–15375. doi:10.1073/pnas.2436556100
- Sonnenschein, M., Sorbi, M.J., van Doornen, L.J.P., Schaufeli, W.B., & Maas, C.J.M. (2007). Electronic diary evidence on energy erosion in clinical burnout. Journal of Occupational Health Psychology, 12, 402–413. doi:10.1037/1076-8998.12.4.402
- Thysell, E., Chorell, E., Svensson, M.B., Jonsson, P., & Antti, H. (2012). Validated and predictive processing of gas chromatography-mass spectrometry based metabolomics data for large scale screening studies, diagnostics and metabolite pattern verification. Metabolites, 2, 796–817. doi:10.3390/metabo2040796
- Trygg, J., & Wold, S. (2002). Orthogonal projections to latent structures (O-PLS). Journal of Chemometrics, 16, 119–128. doi:10.1002/cem.695
- Wang, X., Zhao, T., Qiu, Y., Su, M., Jiang, T., Zhou, M., … Jia, W. (2009). Metabonomics approach to understanding acute and chronic stress in rat models†. Journal of Proteome Research, 8, 2511–2518. doi:10.1021/pr801086k
- Wibom, C., Surowiec, I., Mörén, L., Bergstro¨M, P., Johansson, M., Antti, H., & Bergenheim, A.T. (2010). Metabolomic patterns in glioblastoma and changes during radiotherapy: a clinical microdialysis study. Journal of Proteome Research, 9, 2909–2919. doi:10.1021/pr901088r
- Xia, J., & Wishart, D.S. (2002). Using MetaboAnalyst 3.0 for comprehensive metabolomics data analysis. Current Protocols in Bioinformatics, 55, 14.10.1–14.10.91. doi:10.1002/cpbi.11
- Xu, H.B., Fang, L., Hu, Z.C., Chen, Y.C., Chen, J.J., Li, F.F., … Xie, P. (2012). Potential clinical utility of plasma amino acid profiling in the detection of major depressive disorder. Psychiatry Research, 200, 1054–1057. doi:10.1016/j.psychres.2012.05.027
- Zheng, P., Gao, H.C., Li, Q., Shao, W.H., Zhang, M.L., Cheng, K., … Xie, P. (2012). Plasma metabonomics as a novel diagnostic approach for major depressive disorder. Journal of Proteome Research, 11, 1741–1748. doi:10.1021/pr2010082