
Abstract
Repeated stress is associated with an increased risk of developing psychiatric illnesses such as post-traumatic stress disorder (PTSD), which is more common in women, yet the neurobiology behind this sex difference is unknown. Habituation to repeated stress is impaired in PTSD, and recent preclinical studies have shown that female rats do not habituate as fully as male rats to repeated stress, which leads to impairments in cognition and sleep. Further research should examine sex differences after repeated stress in other relevant measures, such as body temperature and neural activity. In this study, we analyzed core body temperature and EEG power spectra in adult male and female rats during restraint, as well as during sleep transitions following stress. We found that core body temperature of male rats habituated to repeated restraint more fully than female rats. Additionally, we found that females had a higher average beta band power than males on both days of restraint, indicating higher levels of arousal. Lastly, we observed that females had lower delta band power than males during sleep transitions on Day 1 of restraint, however, females demonstrated higher delta band power than males by Day 5 of restraint. This suggests that it may take females longer to initiate sleep recovery compared with males. These findings indicate that there are differences in the physiological and neural processes of males and females after repeated stress. Understanding the way that the stress response is regulated in both sexes can provide insight into individualized treatment for stress-related disorders.
Introduction
Repeated stress is associated with an increased likelihood of developing psychiatric illnesses such as Post-Traumatic Stress Disorder (PTSD), Major Depressive Disorder and Panic Disorder (Marin et al., Citation2011; Abdallah et al., Citation2019). These disorders are more prevalent in women, but the neurobiology behind this sex difference is unknown (Nestler et al., Citation2002; Sheikh et al., Citation2002; Keane et al., Citation2006; Bangasser & Valentino, Citation2014; Suh et al., Citation2018; Swaab & Bao, Citation2020; Wang et al., Citation2024). Habituation to repeated stress is disrupted in many stress-related illnesses, such as PTSD and Panic Disorder (Johnson et al., Citation2012). Importantly, previous literature has indicated that female rats exhibit impaired habituation to repeated restraint compared to male rats (Grafe et al., Citation2017). However, these studies have been limited to measures of the HPA response, orexins, cognition, and sleep (Grafe et al., Citation2017; Gargiulo, Jasodanand, et al., Citation2021; Gargiulo, Jasodanand, et al., Citation2021; Medina-Saldivar et al., Citation2024). More research should be done to examine potential sex differences in the response to repeated stress in other relevant measures, such as body temperature and neural activity. Understanding the way that the stress response is physiologically and neurobiologically regulated in both sexes can provide insight into individualized treatment and management of stress-related health concerns.
A key physiological response to stress in both rodents and humans is an increase in body temperature (Meerlo et al., Citation1999; Keeney et al., Citation2001; Hayashida et al., Citation2010; Oka, Citation2015; Vinkers et al., Citation2013; Marazziti et al., Citation1992; Oka & Oka, Citation2007). However, many of these studies only examine the effect of acute stress and do not include females. Of the few studies that do include females, the overwhelming consensus is that acute stress produces a sharper increase in core body temperature in females compared with males (Vinkers et al., Citation2013; Thompson et al., Citation2004; McGivern et al., Citation2009). But, it is important investigate potential sex differences in body temperature after repeated stress, as this may be a simple physiological measure to gauge habituation to stress and subsequent phenotypes relevant to mental health.
In addition to hyperthermia, another key change in response to stress is altered arousal (Winsky-Sommerer et al., Citation2005; Sanford et al., Citation2015; Bangasser et al., Citation2018, Citation2019). In general, stress and its associated hormones promote wake and reduce sleep (including slow-wave sleep [SWS] and rapid eye movement sleep [REMS]), but many factors play a role in determining how sleep measures are altered after stress (Vazquez-Palacios & Velazquez-Moctezuma, Citation2000; Vázquez-Palacios et al., Citation2001; Wang et al., Citation2014; Tsutsui et al., Citation2015; Lo Martire et al., Citation2020; Xu et al., Citation2023; Wright et al., Citation2023). Studies in both rodents and humans have reported sex differences in sleep after stress, with females showing more prominent arousal and poorer quality sleep (Gargiulo, Jasodanand, et al., Citation2021; Gargiulo, Jasodanand, et al., Citation2021; Page et al. Citation2016; Krishnan & Collop, Citation2006; Gargiulo, Jasodanand, et al., Citation2021; Gargiulo, Jasodanand, et al., Citation2021). However, these studies have not included a more detailed view of neural activity during wake and sleep states after stress.
Importantly, electroencephalography (EEG) power spectrum measures can inform how stress changes brain activity during wake and sleep states (Vyazovskiy & Delogu, Citation2014). Specifically, the power spectral density (PSD), which is also known as the power spectrum, describes the distribution of signal power over frequency (Dressler et al., Citation2004). There are four main frequency band ranges that are used in most rodent and human analysis: delta (0.5–4 Hz), theta (4–8 Hz), alpha (8–14 Hz), and beta (15–30 Hz). By examining power value of different frequency ranges, or the band power, one can see which frequency bands dominate certain affective states and vigilance states before, during, and after stress in both sexes.
In general, high arousal states are defined by fast, desynchronized EEG activity and deep sleep states display more synchronized slow waves (Brown et al., Citation2012). Specifically, wake includes high proportions of alpha (8–14 Hz) and beta (15–30 Hz) frequencies, REM sleep includes predominantly theta rhythms (4–8 Hz), and SWS includes the highest percentage of delta rhythms (0.5–4 Hz) (Vyazovskiy & Delogu, Citation2014; Oken et al., Citation2006; Liu & Dan, Citation2019). Importantly, stress affects the spectral density within EEG measures. This can be observed both during stress and in subsequent sleep.
Current research in both humans and rodents suggests that EEG PSD changes during the experience of stress. In short, studies have found an increase in beta band power and a decrease in alpha band power during psychologically stressful scenarios (Hayashida et al., Citation2010; Awang e al., Citation2011; Hinrichs & Machleidt, Citation1992; Rajendran et al., Citation2021). The beta frequency band is associated with an increase in mental workload and concentration under psychological stress (Palacios-García et al., Citation2021). In contrast, the alpha frequency band is more indicative of a relaxed state with lower mental vigilance (MacLean et al., Citation2012; Kamzanova et al., Citation2014; Fernandez Rojas et al., Citation2020). However, it is unknown whether males and females differ in their neural PSD during repeated stress.
Stress can also impact spectral density in subsequent sleep. We are interested in PSD changes within SWS and REMS, as well as during sleep state transitions. Previous research has indicated that the continuity of REM is disrupted after repeated stress (Grafe et al., Citation2020, Citation2024). Examinations of power spectral changes during SWS and REM sleep transitions may provide important insight as to how stress affects brain activity during sleep cycles. Unfortunately, the vast majority of studies that describe the impact of stress on delta, beta, and alpha PSD during subsequent sleep only include male subjects, and therefore, do not consider sex differences in neural spectra in sleep following repeated stress (Meerlo et al., Citation2001; Wang et al., Citation2020; Xi et al., Citation2021; de Boer et al., Citation2019; Perlis et al., Citation2001; Zhao et al., Citation2021; Jokić-Begić & Begić, Citation2003).
In sum, the current literature has robustly investigated sex differences in the stress response, and separately, the effect of stress on thermoregulation and sleep architecture. However, less is known about sex differences in the effect of repeated stress on physiological and neurobiological measures, such as core body temperature and neural power spectra during different vigilance states. To fill this gap in the literature, we examined core body temperature and neural power spectra in male and female rats before, during, and after five consecutive days of 30-min restraint stress. Ultimately, we hope to shed light on sex differences in the physiological and neurobiological responses to repeated stress, so that we may inform individualized treatments for phenotypes relevant to stress-related disorders.
Methods
Animals
Seven male (∼75 d, 325–350 g) and seven female (∼75 d, 200–225 g) Sprague Dawley rats were included in the study. Based on previous publications analyzing EEG/EMG data in rodents, this n per group is sufficient to gain enough statistical power (Gargiulo, Jasodanand, et al., Citation2021; Gargiulo, Jasodanand, et al., Citation2021; Boyle et al., Citation2019; Herr et al., Citation2013). Rats were singly housed in conventional cages under a 12-h light-dark cycle (lights on at 7 am and off at 7 pm) and were given food and water ad libitum. Rats acclimated to their housing for at least 5 d before the experiment began. All procedures were approved by the Institutional Animal Care and Use Committee of The Children’s Hospital of Philadelphia Research Institute.
Instrumentation surgery, telemetric recordings, and restraint stress paradigm
Animals were implanted with telemetric transmitters (Physiotel HD-S02; Data Science International, St. Paul, MN). In a sterile surgery, isofluorane (2–3%) was used to induce and maintain anesthesia. A midline incision was made in the abdominal cavity and the telemeter was sutured to the peritoneal wall. Telemeter implants had sensors that measured the core body temperature and motor activity of the animal, along with two bipotential amplifiers. To secure the cortical EEG, two screws were implanted into the skull and were connected to an amplifier. The postural muscle EMG activity was recorded through two insulated stainless steel wire electrodes that were attached bilaterally to the dorsal neck muscles. To conclude, the scalp and peritoneal cavity were sutured and the analgesic meloxicam (2 mg/kg, sc) was administered. Animals were given at least one week to recover from surgery before recordings began.
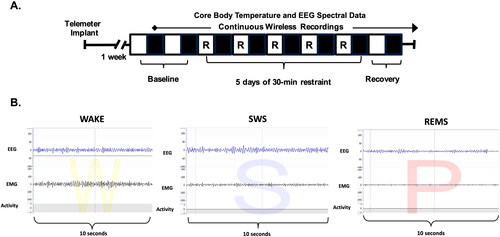
The telemeter recorded continuous core body temperature, EEG, and EMG signals for 9 d total (for experimental paradigm, see ). The first 2 d of the experiment were used to record baseline activity. Animals were then exposed to five consecutive days of 30-min restraint stress, as previously described (Grafe et al., Citation2017). Briefly, animals were restrained in Broome-style plexiglas tubes differently sized for male and female rats. Each restraint session occurred within 2 h after lights-on to control for circadian fluctuation of stress hormones (Gargiulo, Jasodanand, et al., Citation2021; Gargiulo, Jasodanand, et al., Citation2021). The recovery period was designated as the time after the end of the repeated restraint stress paradigm, and recovery data was collected for 2 full days. Core body temperature was averaged into 5-min bins before further analysis. Sleep scoring and analysis are detailed below.
Figure 1. Experimental paradigm and representative sleep traces. (A) A visual depicting the experimental paradigm. Briefly, rodents were implanted with a telemeter one week prior to experimentation. Continuous recordings for core body temperature, EEG, and EMG were collected for 2 baseline days, five consecutive days of 30-min restraint stress, and 2 d of recovery. The light period is represented by open white boxes and the dark period is represented by dark boxes. (B) Representative EEG, EMG, and locomotor activity traces for 10 s epochs of Wake (denoted as W), SWS (denoted as S), and REM sleep (denoted as P, for paradoxical sleep).
Sleep scoring and analysis
Sleep stage
Sleep-wake states were scored in 10-s epochs with the Rodent Sleep Score Module 2 using Neuroscore Software (Data Science International, St. Paul, MN). Neuroscore uses EEG signals along with EMG signals and activity data to assign a vigilance state (for representative EEG, EMG, and locomotor traces for each vigilance state, see ). Briefly, the Rodent Sleep Score Module 2 assesses each individual second of the recording and determines the probability of vigilance state (wake, slow-wave sleep, or paradoxical sleep, also known as REMS) based upon the delta power, theta power, EMG power, stage transition probabilities, contribution factors, and epochs with activity greater than 0. For more information about activity parameters, see https://support.datasci.com/hc/en-us/articles/115005030328-Understanding-the-Ponemah-Activity-Derived-Parameter. If the amplitude of the EEG or EMG exceeds the artifact threshold or has a signal dropout, the 1-s epoch is labeled by the program as an artifact (Data Sciences International, 2012, 302). Two research assistants blind to group conditions visually cross-checked the accuracy of the recognition of sleep-wake stages by Neuroscore.
Power spectral density
PSD was analyzed using the Periodogram Power Bands function in Neuroscore. Specifically, we used predefined frequency ranges of delta (0.5–4 Hz), theta (4–8 Hz), alpha (8–14 Hz), and beta (15–30 Hz) to calculate the signal content in the frequency domain for each epoch in our frequency bands of interest. This displays the integral between the lower and the upper bounds for a specific frequency range of the power spectrum. We calculated the “Relative Power Band” value, which normalizes the output by “representing the power band as a ratio between the desired power band and the total power in the signal.” This computation was executed using a Fast Fourier Transform with a default value of 8 and a Hamming window (Neuroscore User Manual, Citation2021).
Sleep bouts
A sleep bout is an occurrence of a sleep stage before transitioning to the next differentially scored sleep stage. A bout may occur over consecutive scored epochs. Sleep bouts were calculated for the 6 h immediately after restraint on Days 1 and 5. Neuroscore categorized the sleep stage every 2 s and then determined the sleep bout length in seconds for each sleep stage (Neuroscore User Manual, Citation2021). This information was later used to identify SWS to REM sleep transitions involving sleep bouts with a length of 10 s or more.
Neural power spectra during restraint
To examine neural activity during restraint stress, the % PSD for alpha, beta, delta, and theta frequency bands were analyzed in 10 s epochs during the last 15 min of restraint on Days 1 and 5 for both sexes. We chose to analyze neural spectra data during the last 15 min of restraint because we observed the largest sex difference in core body temperature during these time points by Day 5 of restraint.
Power spectra during sleep transitions
To examine neural activity during sleep state transitions after stress, we had to utilize several measures, including sleep stages, sleep bout duration, and relative spectral band powers < alpha, beta, delta, and theta > on Days 1 and 5 of restraint. Spectral data were selected at the first occurrence of a SWS to REM transition after the end of restraint, where each SWS and REM bout was > 10 s. The minimum of 10 s for each sleep stage bout was used to ensure that we were analyzing true SWS and REM states, which is common practice in previously published work (Vanini & Baghdoyan, Citation2013; Rempe et al., Citation2015).
Statistical analysis
All data are presented as mean ± standard error of the mean. GraphPad Prism Software version 9.3.1 (La Jolla, CA) was employed for statistical analysis and graphical representation. Outliers were identified as 2 standard deviations above or below the mean. A Shapiro–Wilk Normality test was run on all data prior to further statistical analysis; all data passed the normality test. 2-Way repeated measure ANOVAs were then used to analyze both core body temperature and spectral data. For core body temperature, the 2-way ANOVA variables were Stress Day × Time. For neural spectra data, each frequency band was analyzed separately, and the 2-way ANOVA variables were Sex × Time. A Mixed-Effects model was used if there were missing data points. Sidak’s multiple comparisons test with a pooled variance was utilized to further examine differences in stress day, sex, or time. Descriptive statistical analyses were used to examine the average % PSD of the sexes on each stress day. The level of significance for all analyses was set at p < 0.05.
Results
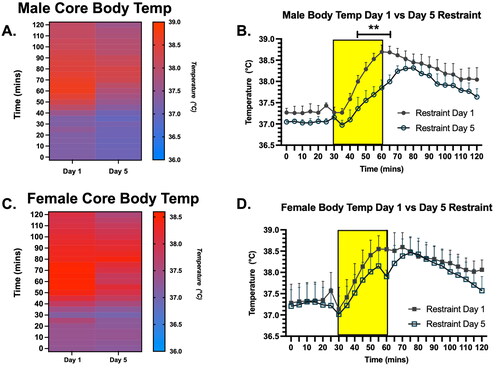
Core body temperature of male rats habituates to repeated restraint more fully than female rats
To determine if there were sex differences in the physiological response to repeated stress, we examined the core body temperature of males and females before, during, and after 30-min restraint stress on Days 1 and 5. A 2-way ANOVA in males revealed a significant main effect of time and an interaction between time and stress day on core body temperature (Time, F (24, 72) = 22.2, p < 0.0001; Time × Stress Day, F (24, 71) = 5.5, p < 0.0001; ). A 2-way ANOVA in females revealed a significant main effect of Time on core body temperature (Time, F (24, 96) = 14.5, p < 0.001; ). Post-hoc tests indicated that males had a significantly lower body temperature at several time points (during the last 15 min of restraint and first 5 min of recovery) on Day 5 compared to Day 1, whereas females showed no statistically significant differences in body temperature during the restraint period. Thus, restraint stress induces an increase in body temperature in both sexes, but the core body temperature of male rats habituates to repeated restraint stress more fully than female rats by Day 5 of restraint.
Figure 2. Core body temperature in male and female rats on Days 1 and 5 of restraint, displayed in both heat map and line graph format. A. Heat map of core body temperature in male rats on Days 1 and 5 of restraint. (B) Line graph illustrating core body temperature in male rats on Days 1 and 5 of restraint (with the 30-min restraint noted as the yellow rectangle). There was a main effect of Stress Day on the core body temperature of males between Days 1 and 5. Post hoc testing revealed that core body temperature during restraint was significantly lower on Day 5 compared to Day 1 of restraint in males. (C) Heat map of core body temperature in female rats on Days 1 and 5 of restraint. (D) Line graph illustrating core body temperature in female rats on Days 1 and 5 of restraint (with the 30-min restraint noted as the yellow rectangle). There was no main effect of Stress on core body temperatures in females. This suggests males habituated more fully to restraint stress by Day 5 than females.** indicates p < 0.01.
Repeated restraint stress alters the power spectral density of alpha and beta frequency bands differentially in male and female rats
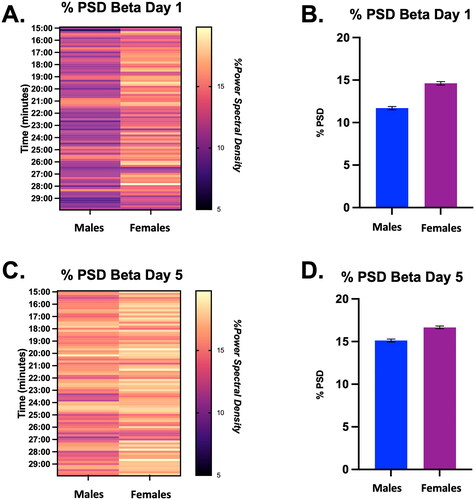
In order to examine whether repeated restraint altered brain activity during stress differentially in males and females, we calculated the percent PSD of each frequency band during the last 15 min of the restraint stress period. We also calculated percent PSD at the equivalent circadian time during baseline recordings, but found no statistically significant differences between the sexes (data not shown). We then examined differences in power spectra between males and females on stress Day 1 and then on stress Day 5 (Time × Sex). Below, we report the findings for the beta and alpha bands only, as the literature has indicated changes in those frequencies in other models of stress (Hinrichs & Machleidt, Citation1992; Jacinto et al., Citation2013).
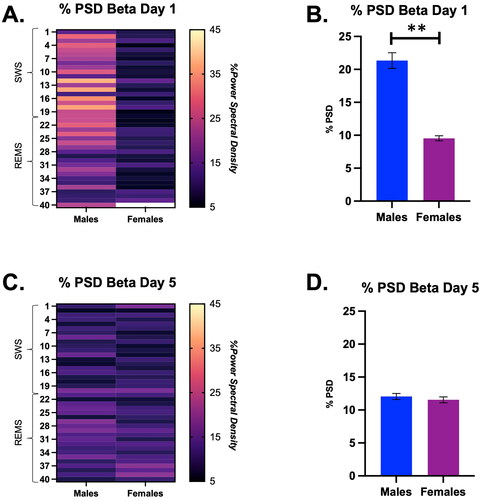
To examine the contribution of the beta frequency to the overall neural signal during stress, we conducted a 2-way ANOVA on restraint stress Days 1 and 5 during the last 15 min of restraint. On Day 1, there was a significant effect of time (but not sex) on the % PSD for the beta frequency (Time, F (7, 88) = 2.09, p < 0.05; ). On Day 5, there was no main effect of sex or time on % PSD of beta (). However, when we examined the average beta band power during that time frame, we found that females had a higher average beta band power than males on both days of restraint, but this was more obvious on Day 1 (: Day 1, Males = 11.7 ± 0.2 vs. Females = 14.6 ± 0.2; Day 5, Males = 15.1 ± 0.2 vs. Females = 16.7 ± 0.2).
Figure 3. Percent power spectral density (PSD) for the Beta frequency during the last 15 min of restraint on Days 1 and 5 in male and female rats, displayed in both heat map and bar graph format. (A) Heat map of % power spectral density for the beta frequency in males and females during the last 15 min of restraint on Day 1. There was a significant effect of time (but not sex) on the % PSD of beta in males and females on Day 1. (B) Bar graph quantifying % power spectral density for the beta frequency from Panel A. (C) Heat map of % power spectral density for the beta frequency in males and females during the last 15 min of restraint on Day 5. There was no main effect of sex or time on % PSD of beta in males and females on Day 5 of restraint. (D) Bar graph quantifying % power spectral density for the beta frequency from Panel C.
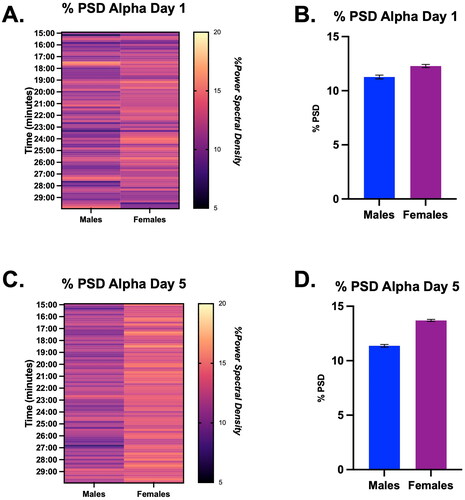
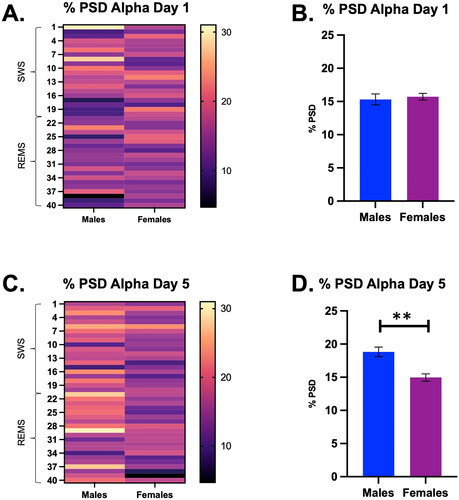
To examine how the alpha frequency changes during stress in males and females, we performed a 2-way ANOVA on Days 1 and 5 of stress. There were no main effects of sex or time on Day 1 of restraint on % PSD for the alpha frequency (). Moreover, there were no main effects of sex or time on Day 5 of restraint on % PSD of alpha (), though descriptive statistics revealed that females reported a higher average % alpha PSD than males (, Males = 11.4 ± 0.1 vs. Females = 13.7 ± 0.1).
Figure 4. Percent power spectral density (PSD) for the alpha frequency during the last 15 min of restraint on Days 1 and 5 in male and female rats, displayed in both heat map and bar graph format. (A) Heatmap of the % power spectral density for the alpha frequency on Day 1 in males and females. There were no significant main effects of time or sex on the % power spectral density of alpha. (B) Bar graph quantifying % power pectral density for the alpha frequency from Panel A. (C) Heatmap of the % power spectral density for the alpha frequency on Day 5 in males and females. There were no significant main effects of time or sex on the % PSD of alpha. (D) Bar graph quantifying % power spectral density for the alpha frequency from Panel C.
Repeated restraint stress induces sex differences in the power spectral density of the delta, beta, and alpha frequency bands during a SWS to REM transition
In order to examine if restraint stress altered brain activity during subsequent sleep, we calculated the % PSD of each frequency band for the first SWS to REM sleep transition following restraint on Days 1 and 5. Examinations of power spectral changes during SWS and REM sleep transitions may provide important insight as to how stress affects brain activity during sleep cycles. We also calculated percent PSD at the equivalent circadian time during baseline recordings, but found no statistically significant differences between the sexes (data not shown). We then used 2-way ANOVAs to examine differences in power spectra between males and females on restraint Day 1 as well as on restraint Day 5 (Time × Sex). We found interesting sex differences for the delta, beta, and alpha frequencies, as we will discuss in order in more detail below.
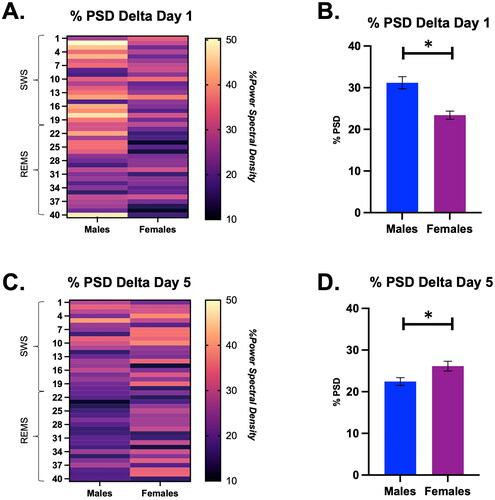
There was a significant main effect of sex and an interaction between time and sex on the % PSD of delta on Day 1 (Sex, F (1, 8) = 5.79, p < 0.05; Time × Sex, F (39, 274) = 1.46, p < 0.05; ). Specifically, males had a higher average % PSD of delta than females (Males = 31.2 ± 1.5 vs. Females = 23.4 ± 1.0). There was also a significant main effect of sex on the % PSD of delta on Day 5 of restraint (Sex, F (1, 7) = 5.88, p < 0.05; ). Surprisingly, we found that females had a higher % PSD of delta on Day 5 than males (Males = 22.5 ± 0.9 vs. Females = 26.1 ± 1.3). In sum, females had a lower % PSD of delta on Day 1 of restraint compared with males, but a higher % PSD of delta on Day 5 of restraint compared with males. This may suggest that females take longer to initiate sleep recovery after repeated stress compared with males.
Figure 5. Percent power spectral density (PSD) for the delta frequency during a SWS to REMS transition on Days 1 and 5 in male and female rats, displayed in both heat map and bar graph format. (A) Heat map of % power spectral density for the delta frequency in males and females during a SWS to REMS transition on restraint Day 1. There was a significant main effect of sex on the % PSD of delta. (B) Bar graph quantifying % power spectral density for the delta frequency from Panel A. Females had a significantly lower % PSD of delta than males on Day 1 of restraint. (C) Heat map of % power spectral density for the delta frequency in males and females during a SWS to REMS transition on restraint Day 5. There was a significant main effect of sex on the % PSD of delta. (D) Bar graph quantifying % power spectral density for the delta frequency from Panel C. Females had a significantly higher % PSD of delta than males. This suggests that repeated restraint stress differentially affects the % PSD of delta in males and females; it may take females longer to initiate sleep recovery compared with males. * indicates p < 0.05.
There was a significant interaction between time and sex on the % PSD of beta (Time × Sex, F (39, 273) = 1.67, p = 0.01; ). Surprisingly, we found that males had a significantly higher average % PSD of beta on Day 1 of restraint compared with females (Males = 21.3 ± 1.2 vs. Females = 9.5 ± 0.4). There were no significant differences in the % PSD of beta between males and females by stress Day 5 (). Thus, males had a higher % PSD for beta than females during the SWS to REMS transition on Day 1 of restraint, but this was transient, as there were no sex differences by Day 5 of restraint.
Figure 6. Percent power spectral density (PSD) for the Beta frequency during a SWS to REMS transition on Days 1 and 5 in male and female rats, displayed in both heat map and bar graph format. (A) Heat map of % power spectral density for the beta frequency in males and females during a SWS to REMS transition on Day 1 of restraint. There was a significant interaction of time and sex on the % PSD of beta. (B) Bar graph quantifying % power spectral density for the beta frequency from Panel A. Males demonstrate a higher % PSD of beta on Day 1 than females. (C) Heat map of % power spectral density for the beta frequency in males and females during a SWS to REMS transition on restraint Day 5. There was no main effect of time or sex on % PSD of beta in male and female rats on Day 5 of restraint. (D) Bar graph quantifying % power spectral density for the beta frequency from Panel C. Thus, males had a higher % PSD for beta than females during the SWS to REMS transition on Day 1 of restraint, but this was transient, as there were no sex differences by Day 5 of restraint. ** indicates p < 0.01.
Lastly, there were no significant main effects of time or sex on the % PSD of alpha on restraint Day 1 (). However, on Day 5, there was a significant main effect of sex on the % PSD of alpha (Sex, F (1, 10) = 16.47, p < 0.01; ). Descriptive statistics indicated a higher average % PSD of alpha in males throughout the transition period (Males = 18.8 ± 0.7 vs. Females = 15.0 ± 0.5). These analyses suggest that by Day 5, repeated restraint stress may differentially affect the % PSD of alpha in males compared with females; this sex difference is not apparent until repeated stress exposure.
Figure 7. Percent power spectral density (PSD) for the alpha frequency during a SWS to REMS transition on Days 1 and 5 in male and female rats, displayed in both heat map and bar graph format. (A) Heat map of the % power spectral density for the alpha frequency in males and females during a SWS to REMS transition on restraint Day 1.There were no significant main effects of time or sex on restraint Day 1. (B) Bar graph quantifying % power spectral density for the alpha frequency from Panel A. (C) Heat map of the % power spectral density for the alpha frequency in males and females during a SWS to REMS transition on restraint Day 5. There was a significant main effect of sex on the % PSD of alpha. (D) Bar graph quantifying % power spectral density for the alpha frequency from Panel. Females appear to have a lower % PSD of alpha on Day 5 than males. These analyses suggest that by Day 5, repeated restraint stress may differentially affect the % PSD of alpha in males compared with females; this sex difference is not apparent until repeated stress exposure. ** indicates p < 0.01.
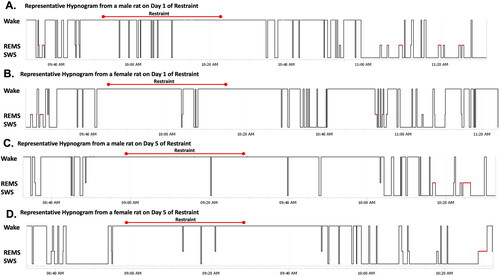
Representative hypnograms of male and female rats on Days 1 and 5 of restraint () reveal the development of sex-specific sleep profiles after repeated stress. In short, after restraint on Day 1, more initial SWS recovery is apparent in the male rat compared with the female rat. In contrast, after restraint on Day 5, there is more prominent SWS recovery in the female rat compared with the male rat. This supports the idea that female rats may take longer to initiate sleep recovery compared with male rats after stress.
Figure 8. Representative hypnograms of male and female rats on Days 1 and 5 of restraint. Each hypnogram shows 120 min of sleep (SWS and REMS) and wake behavior before, during, and after 30 min of restraint. Restraint duration is denoted with a red bar above each hypnogram. (A) Hypnogram of male rat on Day 1 of restraint. (B) Hypnogram of female rat on Day 1 of restraint. (C) Hypnogram of male rat on Day 5 of restraint. (D) Hypnogram of female rat on Day 5 of restraint. After restraint on Day 1, more initial SWS recovery is apparent in the male rat compared with the female rat. In contrast, after restraint on Day 5, there is more prominent SWS recovery in the female rat compared with the male rat.
Discussion
Acute activation of the stress response is evolutionarily adaptive; however, chronic stress is associated with a variety of adverse health consequences (Goel et al., Citation2014). Two key physiological variables affected by stress are thermoregulation and sleep; previous research has indicated that chronic stress may impact these variables differently in men and women (McGivern et al., Citation2009; Gargiulo, Jasodanand, et al., Citation2021; Gargiulo, Jasodanand, et al., Citation2021). The current literature has robustly investigated sex differences in the stress response and, separately, the effect of stress on thermoregulation and sleep architecture. However, less is known about the sex differences in the effect of stress on core body temperature and sleep. Moreover, the few studies focusing on the sex differences in stress-induced sleep changes do not examine changes to neural power spectra during sleep state transitions. To fill the gap in this knowledge, we examined core body temperature as well neural power spectra in male and female rats before, during, and after five consecutive days of 30-min restraint stress.
Stress effects on core body temperature during restraint stress
We found that restraint stress reliably increased core body temperature in both sexes, and males showed a larger decrease in stress-induced core body temperature by Day 5 of repeated restraint compared to females. An increase in thermogenesis has been well documented as an adaptive physiological response to stress and this is, in part, due to activation of the sympathetic nervous system in response to psychological arousal (Oka, Citation2015; McGivern et al., Citation2009). Thus, our findings may suggest a sex difference in the habituation of sympathetic reactivity to restraint stress. In addition, previous studies have revealed sex differences in behavioral and hormonal habituation to restraint stress (Grafe et al., Citation2017; Gargiulo, Jasodanand, et al., Citation2021; Gargiulo, Jasodanand, et al., Citation2021). Specifically, females demonstrate more struggle behavior and HPA activity compared to males by Day 5 of restraint (Grafe et al., Citation2017; Gargiulo, Jasodanand, et al., Citation2021; Gargiulo, Jasodanand, et al., Citation2021). Importantly, HPA hormones such as glucocorticoids are associated with increased thermoregulatory responses (Vinkers et al., Citation2013). In sum, our data aligns with previous findings of sexual dimorphisms in the physiological stress response (Bangasser & Wiersielis, Citation2018).
Stress effects on the % PSD of beta and alpha
We were interested in determining whether the physiological differences observed in males and females in response to restraint stress (e.g. core body temperature changes) extended to sex differences in neural activity. Thus, we examined the % PSD of the different frequency bands during the end of the restraint stress period. We focused our analyses on the beta and alpha frequencies, as the literature indicated changes in those frequencies in other models of stress (Hinrichs & Machleidt, Citation1992; Jacinto et al., Citation2013).
We observed that the average percent PSD for the beta frequency was higher in females on both Days 1 and 5 compared to males. The beta frequency band has previously been associated with an increase in mental workload and concentration under psychological stress (Palacios-García et al., Citation2021). Additionally, restraint stress has been proven to induce psychological stress in rodents (Buynitsky & Mostofsky, Citation2009). Taken together with females exhibiting a prolonged time to habituate to the physiological responses from restraint stress, these findings may support the examination of beta band power as an indicator of prolonged psychological stress.
We also observed that the average alpha band power was higher in females on Day 5 compared to males. This was unexpected, as alpha PSD has previously been established to occur during relaxed states, and multiple measures have shown that females take longer to habituate to repeated restraint stress compared to males (Grafe et al., Citation2017; Fernandez Rojas et al., Citation2020). However, this finding could potentially be explained by more struggle behavior in the restrainer on Day 5 of restraint in females compared with males, as shown in previous research with this paradigm (Grafe et al., Citation2017). Specifically, one study found that physical effort resulted in an increase in the power of alpha and beta (Smit et al., Citation2005). If females still had not habituated to the stress and were struggling more during the restraint period on Day 5 than males, it is possible this could explain both the elevated alpha and beta frequencies. Thus, we examined locomotor activity counts in both sexes during the last 15 min of restraint on Day 5. Though female rats had a higher number of counts/minute than male rats (27.7 ± 6.2 vs. 15.5 ± 5.6 counts per min, respectively), the variability was quite high and there was no statistical difference between the sexes.
Alternatively, the increased alpha band power in females relative to males may be due to increased mental fatigue (Borghini et al., Citation2012). Importantly, females in a restraint stress paradigm exhibit shorter sleep times and more disrupted sleep than males (Gargiulo, Jasodanand, et al., Citation2021; Gargiulo, Jasodanand, et al., Citation2021). Previous studies have observed that individuals with burn-out syndrome (which is correlated with poor sleep quality and mental fatigue), exhibit significantly higher alpha activity (Rothe et al., Citation2020; Tement et al., Citation2016). Thus, it is possible that disrupted sleep in females during repeated restraint is similar to the phenotype observed in burn-out syndrome, subsequently increasing mental fatigue and alpha power relative to males. Indeed, a representative hypnogram of a female rat on Day 5 of restraint shows that SWS recovery after restraint is fragmented by many wake episodes. In sum, our findings may suggest that restraint stress leads to greater psychological stress in females on both Days 1 and 5.
Stress effects on the % PSD of delta, beta, and alpha during a SWS to REM transition
In order to examine if restraint stress resulted in changes in brain activity during subsequent sleep, we analyzed the PSD of each frequency band for the first SWS to REM sleep transition following the restraint stress period on restraint Days 1 and 5. We chose to examine this as previous research has suggested sex differences in the effects of stress on sleep architecture, and there is a lack of literature examining changes in the power spectra of different frequency bands during sleep transitions following stress (Gargiulo, Jasodanand, et al., Citation2021; Gargiulo, Jasodanand, et al., Citation2021; Cano et al., Citation2008).
We found that males have significantly higher delta band power on Day 1 of restraint than females, and this difference is especially prominent during SWS. This may be indicative of males having a faster “sleep rebound” to stress than females, where increased delta power during SWS is able to dissipate the sleep debt built up during stress (Meerlo et al., Citation2001). However, we found that on Day 5, females exhibited a higher relative delta band power than males. One possible explanation for this data is that females took longer to initiate sleep recovery compared with males. Alternatively, elevated delta during REM has been associated with nightmares (de Boer et al., Citation2019), and previous studies have indicated that females demonstrate higher nightmare-like activity after repeated restraint compared with males (Gargiulo, Jasodanand, et al., Citation2021; Gargiulo, Jasodanand, et al., Citation2021). Therefore, it is possible the continued stress contributes to a PTSD like phenotype by Day 5 but not by Day 1 in females. Regardless, the data suggest that the sexes differ in the neural process of the dissipation of sleep debt associated with psychological stress.
We next found that females had lower % PSD of beta than males on Day 1 and by Day 5, there were no significant sex differences. This was surprising, as we had hypothesized that females would show elevated beta frequency, indicating hyperarousal and a shift away from restorative sleep (Perlis et al., Citation2001). Moreover, increases in beta band power have been found in individuals with primary insomnia during SWS, and insomnia is more common in women (Spiegelhalder et al., Citation2012). However, previous research in sleep transitions has found a rise in beta frequency through the last minute of SWS that is maintained through the first 15 min of REM sleep (Ferri et al., Citation2001). Thus, it is possible our data reflects that stress causes an initial inconsistency in this typical sleep state transition trend in females, which is resolved by Day 5.
Lastly, we found that males have higher average alpha band power than females during the first sleep transition after restraint on Day 5. A previous study examining the EEG activity of veterans with and without PTSD observed a decreased alpha power in those with PTSD (Jokić-Begić & Begić, Citation2003). Thus, it is possible alpha power after prolonged stress could be a marker relevant to stress resiliency (Jokić-Begić & Begić, Citation2003). In our paradigm, this may suggest that females are less resilient to the neurobiological changes of repeated restraint stress, reflected by a lower alpha power compared to males which develops only after repeated stress.
Limitations and future directions
Previous studies have indicated that HPA hormones such as corticosterone and ACTH can be reliable markers of habituation during repeated restraint stress (Grafe et al., Citation2017; Bhatnagar et al., Citation2005). Since stress hormone increases are associated with a rise in core body temperature, simultaneously collecting HPA hormones and core body temperature readings may allow us to further elucidate the association between the HPA axis and thermoregulation and determine whether there are sex differences in the timing of these changes (Bhatnagar et al., Citation2005).
Previous research indicates that sex differences in stress-induced changes in REM sleep are influenced by gonadal hormones (Morrison & Nakamura, Citation2019). Moreover, human studies have observed that changes in sleep power spectra and sleep architecture occur in association with hormonal fluctuations during the menstrual cycle (Paul et al., Citation2009). Since gonadal hormones may modulate the effects of stress on sleep, there is room for further research examining the effects of stress on power spectra within females in different phases of the estrous cycle (Corsi-Cabrera et al., Citation2003). Though we collected estrous data with vaginal lavage in this study, we only recorded our findings on restraint days (5 d total), which is not enough data to reliably track female rats (2 weeks is standard) (Dib et al., Citation2021). Based on our dataset, it appears that our sample of female rats was quite variable on where they were in their estrous cycle on Days 1 and 5 of restraint (some females were in diestrus, proestrus, and estrus), which may have contributed to variability in the female data.
Conclusions
Our data reveal that stress-induced increases in core body temperature habituate more fully in males by Day 5 of repeated restraint compared to females. Additionally, our data suggest that females show more high frequency activity (e.g. beta and alpha waves) than males during repeated restraint. Lastly, our data indicate that males and females differ in their neural response during the first SWS to REM sleep transition following stress, with females showing a delay in delta sleep recovery. These findings indicate that there are measurable, lasting differences in the physiological and neural processes of males and females both during and after repeated stress. Understanding the way that the stress response is physiologically and neurobiologically regulated in both sexes can provide insight into individualized treatments for stress-related disorders.
Author’s contributions
All authors contributed significantly to the design, execution, and/or analysis of the present experiments. I.C. Ravaglia and L.A. Grafe contributed significantly to the writing of this manuscript. All authors read and approved the final manuscript.
Ethics approval and consent to participate
All procedures were approved by the Institutional Animal Care and Use Committee of The Children’s Hospital of Philadelphia Research Institute.
Consent for publication
All authors consent to the publication of this manuscript.
Acknowledgments
The authors would like to acknowledge Sandy Luz for her help with data collection and Jay Arner for his insight on the spectral data.
Disclosure statement
The authors have no competing interested related to the work described in this manuscript.
Availability of data and materials
Data can be made available upon request.
Additional information
Funding
Notes on contributors
I. C. Ravaglia
I. C. Ravaglia was an undergraduate at Bryn Mawr College (graduated in May 2022), majoring in neuroscience. She worked in the lab of Laura Grafe to better understand the effects of stress on sleep. She is now a research technician at Northeastern University.
V. Jasodanand
V. Jasodanand was an undergraduate at Bryn Mawr College (graduated in May 2020), double majoring in Psychology and Philosophy. She worked in the lab of Laura Grafe to better understand the effects of stress on sleep. She is now a neuroscience graduate student at Boston University.
S. Bhatnagar
S. Bhatnagar (BS McGill University, 1984; PhD McGill University, 1994) is a Professor of Anesthesiology and Critical Care at the University of Pennsylvania/Children’s Hospital of Philadelphia. She studies individual differences in resilience and vulnerability to chronic stress.
L. A. Grafe
L. A. Grafe (B.S. University of Maryland, 2008; Ph.D. University of Pennsylvania, 2014) is an Assistant Professor of Psychology at Bryn Mawr College and a behavioral neuroscientist. Her research program focuses on how stress affects the brain and behaviors relevant to mental health.
References
- Abdallah, C. G., Averill, L. A., Akiki, T. J., Raza, M., Averill, C. L., Gomaa, H., Adikey, A., & Krystal, J. H. (2019). The neurobiology and pharmacotherapy of posttraumatic stress disorder. Annual Review of Pharmacology and Toxicology, 59(1), 1–14. https://doi.org/10.1146/annurev-pharmtox-010818-021701
- Awang SA, Pandiyan PM, Yaacob S, Ali YM, Ramidi F, Mat F. (2011). Spectral density analysis: Theta wave as mental stress indicator. In T. Kim, H. Adeli, C. Ramos, & B. H. Kang (Eds.), Signal processing, image processing and pattern recognition (pp. 103–112). Springer.
- Bangasser, D. A., & Valentino, R. J. (2014). Sex differences in stress-related psychiatric disorders: Neurobiological perspectives. Frontiers in Neuroendocrinology, 35(3), 303–319. https://doi.org/10.1016/j.yfrne.2014.03.008
- Bangasser, D. A., & Wiersielis, K. R. (2018). Sex differences in stress responses: A critical role for corticotropin-releasing factor. Hormones (Athens, Greece), 17(1), 5–13. https://doi.org/10.1007/s42000-018-0002-z
- Bangasser, D. A., Eck, S. R., & Ordoñes Sanchez, E. (2019). Sex differences in stress reactivity in arousal and attention systems. Neuropsychopharmacology, 44(1), 129–139. https://doi.org/10.1038/s41386-018-0137-2
- Bangasser, D. A., Eck, S. R., Telenson, A. M., & Salvatore, M. (2018). Sex differences in stress regulation of arousal and cognition. Physiology & Behavior, 187, 42–50. https://doi.org/10.1016/j.physbeh.2017.09.025
- Bhatnagar, S., Lee, T. M., & Vining, C. (2005). Prenatal stress differentially affects habituation of corticosterone responses to repeated stress in adult male and female rats. Hormones and Behavior, 47(4), 430–438. https://doi.org/10.1016/j.yhbeh.2004.11.019
- orghini, G., Vecchiato, G., Toppi, J., Astolfi, L., Maglione, A., & Isabella, R. (2012). Assessment of mental fatigue during car driving by using high resolution EEG activity and neurophysiologic indices. Annual International Conference of the IEEE Engineering in Medicine and Biology Society, 2012, 6442–6445. https://doi.org/10.1109/EMBC.2012.6347469
- Boyle, C. E., Parkar, A., Barror, A., & Kubin, L. (2019). Noradrenergic terminal density varies among different groups of hypoglossal premotor neurons. Journal of Chemical Neuroanatomy, 100, 101651. https://doi.org/10.1016/j.jchemneu.2019.101651
- Brown, R. E., Basheer, R., McKenna, J. T., Strecker, R. E., & McCarley, R. W. (2012). Control of sleep and wakefulness. Physiological Reviews, 92(3), 1087–1187. https://doi.org/10.1152/physrev.00032.2011
- Buynitsky, T., & Mostofsky, D. I. (2009). Restraint stress in biobehavioral research: Recent developments. Neuroscience and Biobehavioral Reviews, 33(7), 1089–1098. https://doi.org/10.1016/j.neubiorev.2009.05.004
- Cano, G., Mochizuki, T., & Saper, C. B. (2008). Neural circuitry of stress-induced insomnia in rats. The Journal of Neuroscience, 28(40), 10167–10184. https://doi.org/10.1523/JNEUROSCI.1809-08.2008
- Corsi-Cabrera, M., Sánchez, A. I., del-Río-Portilla, Y., Villanueva, Y., & Pérez-Garci, E. (2003). Effect of 38 h of total sleep deprivation on the waking EEG in women: Sex differences. International Journal of Psychophysiology, 50(3), 213–224. https://doi.org/10.1016/s0167-8760(03)00168-5
- de Boer, M., Nijdam, M. J., Jongedijk, R. A., Bangel, K. A., Olff, M., Hofman, W. F., & Talamini, L. M. (2019). The spectral fingerprint of sleep problems in post-traumatic stress disorder. Sleep, 43(4), zsz269. https://doi.org/10.1093/sleep/zsz269
- Dib, R., Gervais, N. J., & Mongrain, V. (2021). A review of the current state of knowledge on sex differences in sleep and circadian phenotypes in rodents. Neurobiology of Sleep and Circadian Rhythms, 11, 100068. https://doi.org/10.1016/j.nbscr.2021.100068
- Dressler, O., Schneider, G., Stockmanns, G., & Kochs, E. F. (2004). Awareness and the EEG power spectrum: Analysis of frequencies. British Journal of Anaesthesia, 93(6), 806–809. https://doi.org/10.1093/bja/aeh270
- Fernandez Rojas, R., Debie, E., Fidock, J., Barlow, M., Kasmarik, K., Anavatti, S., Garratt, M., & Abbass, H. (2020). Electroencephalographic workload indicators during teleoperation of an unmanned aerial vehicle shepherding a swarm of unmanned ground vehicles in contested environments. Frontiers in Neuroscience, 14, 40. https://doi.org/10.3389/fnins.2020.00040
- Ferri, R., Cosentino, F. I. I., Elia, M., Musumeci, S. A., Marinig, R., & Bergonzi, P. (2001). Relationship between Delta, Sigma, Beta, and Gamma EEG bands at REM sleep onset and REM sleep end. Clinical Neurophysiology, 112(11), 2046–2052. https://doi.org/10.1016/s1388-2457(01)00656-3
- Gargiulo, A. T., Jasodanand, V., Luz, S., O’Mara, L., Kubin, L., Ross, R. J., Bhatnagar, S., & Grafe, L. A. (2021). Sex differences in stress-induced sleep deficits. Stress (Amsterdam, Netherlands), 24(5), 541–550. https://doi.org/10.1080/10253890.2021.1879788
- Gargiulo, A. T., Peterson, L. M., & Grafe, L. A. (2021). Stress, coping, resilience, and sleep during the COVID-19 pandemic: A representative survey study of US adults. Brain and Behavior, 11(11), e2384. https://doi.org/10.1002/brb3.2384
- Goel, N., Workman, J. L., Lee, T. T., Innala, L., & Viau, V. (2014). Sex differences in the HPA axis. Comprehensive Physiology, 4(3), 1121–1155. https://doi.org/10.1002/cphy.c130054
- Grafe, L. A., Cornfeld, A., Luz, S., Valentino, R., & Bhatnagar, S. (2017). Orexins mediate sex differences in the stress response and in cognitive flexibility. Biological Psychiatry, 81(8), 683–692. https://doi.org/10.1016/j.biopsych.2016.10.013
- Grafe, L. A., O’Mara, L., Branch, A., Dobkin, J., Luz, S., Vigderman, A., Shingala, A., Kubin, L., Ross, R., & Bhatnagar, S. (2020). Passive coping strategies during repeated social defeat are associated with long-lasting changes in sleep in rats. Frontiers in Systems Neuroscience, 14, 6. https://www.ncbi.nlm.nih.gov/pmc/articles/PMC7043017/ https://doi.org/10.3389/fnsys.2020.00006
- Grafe, L., Miller, K. E., Ross, R. J., & Bhatnagar, S. (2024). The importance of REM sleep fragmentation in the effects of stress on sleep: Perspectives from preclinical studies. Neurobiology of Stress, 28, 100588. https://doi.org/10.1016/j.ynstr.2023.100588
- Hayashida, S., Oka, T., Mera, T., & Tsuji, S. (2010). Repeated social defeat stress induces chronic hyperthermia in rats. Physiology & Behavior, 101(1), 124–131. https://doi.org/10.1016/j.physbeh.2010.04.027
- Herr, K. B., Stettner, G. M., & Kubin, L. (2013). Reduced c-Fos expression in medullary catecholaminergic neurons in rats 20 h after exposure to chronic intermittent hypoxia. American Journal of Physiology Regulatory, Integrative and Comparative Physiology, 304(7), R514–22. https://doi.org/10.1152/ajpregu.00542.2012
- Hinrichs, H., & Machleidt, W. (1992). Basic emotions reflected in EEG-coherences. International Journal of Psychophysiology, 13(3), 225–232. https://doi.org/10.1016/0167-8760(92)90072-j
- Jacinto, L. R., Reis, J. S., Dias, N. S., Cerqueira, J. J., Correia, J. H., & Sousa, N. (2013). Affects theta activity in limbic networks and impairs novelty-induced exploration and familiarization. Frontiers in Behavioral Neuroscience, 7, 127. https://www.frontiersin.org/article/10<?sch-permit JATS-0034-007?>.3389/fnbeh.2013.00127
- Johnson, P. L., Molosh, A., Fitz, S. D., Truitt, W. A., & Shekhar, A. (2012). Orexin, stress, and anxiety/panic states. Progress in Brain Research, 198, 133–161. https://doi.org/10.1016/B978-0-444-59489-1.00009-4
- Jokić-Begić, N., & Begić, D. (2003). Quantitative electroencephalogram (qEEG) in combat veterans with post-traumatic stress disorder (PTSD). Nordic Journal of Psychiatry, 57(5), 351–355. https://doi.org/10.1080/08039480310002688
- Kamzanova, A. T., Kustubayeva, A. M., & Matthews, G. (2014). Use of EEG workload indices for diagnostic monitoring of vigilance decrement. Human Factors, 56(6), 1136–1149. https://doi.org/10.1177/0018720814526617
- Keane, T. M., Marshall, A. D., & Taft, C. T. (2006). Posttraumatic stress disorder: Etiology, epidemiology, and treatment outcome. Annual Review of Clinical Psychology, 2(1), 161–197. https://doi.org/10.1146/annurev.clinpsy.2.022305.095305
- Keeney, A. J., Hogg, S., & Marsden, C. A. (2001). Alterations in core body temperature, locomotor activity, and corticosterone following acute and repeated social defeat of male NMRI mice. Physiology & Behavior, 74(1–2), 177–184. https://doi.org/10.1016/s0031-9384(01)00541-8
- Krishnan, V., & Collop, N. A. (2006). Gender differences in sleep disorders. Current Opinion in Pulmonary Medicine, 12(6), 383–389. https://doi.org/10.1097/01.mcp.0000245705.69440.6a
- Liu, D., & Dan, Y. (2019). A motor theory of sleep-wake control: Arousal-action circuit. Annual Review of Neuroscience, 42(1), 27–46. https://doi.org/10.1146/annurev-neuro-080317-061813
- Lo Martire, V., Caruso, D., Palagini, L., Zoccoli, G., & Bastianini, S. (2020). Stress & sleep: A relationship lasting a lifetime. Neuroscience and Biobehavioral Reviews, 117, 65–77. https://doi.org/10.1016/j.neubiorev.2019.08.024
- MacLean, M. H., Arnell, K. M., & Cote, K. A. (2012). Resting EEG in alpha and beta bands predicts individual differences in attentional blink magnitude. Brain and Cognition, 78(3), 218–229. https://doi.org/10.1016/j.bandc.2011.12.010
- Marazziti, D., Di Muro, A., & Castrogiovanni, P. (1992). Psychological stress and body temperature changes in humans. Physiology & Behavior, 52(2), 393–395. https://doi.org/10.1016/0031-9384(92)90290-i
- Marin, M. F., Lord, C., Andrews, J., Juster, R.-P., Sindi, S., Arsenault-Lapierre, G., Fiocco, A. J., & Lupien, S. J. (2011). Chronic stress, cognitive functioning and mental health. Neurobiology of Learning and Memory, 96(4), 583–595. https://doi.org/10.1016/j.nlm.2011.02.016
- McGivern, R. F., Zuloaga, D. G., & Handa, R. J. (2009). Sex differences in stress-induced hyperthermia in rats: Restraint versus confinement. Physiology & Behavior, 98(4), 416–420. https://doi.org/10.1016/j.physbeh.2009.07.004
- Medina-Saldivar, C., Cruz-Visalaya, S., Zevallos-Arias, A., Pardo, G. V. E., & Pacheco-Otálora, L. F. (2024). Differential effect of chronic mild stress on anxiety and depressive-like behaviors in three strains of male and female laboratory mice. Behavioural Brain Research, 460, 114829. https://doi.org/10.1016/j.bbr.2023.114829
- Meerlo, P., de Bruin, E. A., Strijkstra, A. M., & Daan, S. (2001). A social conflict increases EEG slow-wave activity during subsequent sleep. Physiology & Behavior, 73(3), 331–335. https://doi.org/10.1016/s0031-9384(01)00451-6
- Meerlo, P., Sgoifo, A., De Boer, S. F., & Koolhaas, J. M. (1999). Long-lasting consequences of a social conflict in rats: Behavior during the interaction predicts subsequent changes in daily rhythms of heart rate, temperature, and activity. Behavioral Neuroscience, 113(6), 1283–1290. https://doi.org/10.1037//0735-7044.113.6.1283
- Morrison, S. F., & Nakamura, K. (2019). Central mechanisms for thermoregulation. Annual Review of Physiology, 81(1), 285–308. https://doi.org/10.1146/annurev-physiol-020518-114546
- Nestler, E. J., Barrot, M., DiLeone, R. J., Eisch, A. J., Gold, S. J., & Monteggia, L. M. (2002). Neurobiology of depression. Neuron, 34(1), 13–25. https://doi.org/10.1016/s0896-6273(02)00653-0
- Neuroscore User Manual. (2021). NeuroScore v3.4.0 user manual [Internet]. Data Sciences International. [cited 2022 Jul 30]. https://support.datasci.com/hc/en-us/articles/4402145447059-NeuroScore-v3-4-0-User-Manual
- Oka, T. (2015). Psychogenic fever: How psychological stress affects body temperature in the clinical population. Temperature, 2(3), 368–378. https://doi.org/10.1080/23328940.2015.1056907
- Oka, T., & Oka, K. (2007). Age and gender differences of psychogenic fever: A review of the Japanese literature. BioPsychoSocial Medicine, 1(1), 11. https://doi.org/10.1186/1751-0759-1-11
- Oken, B. S., Salinsky, M. C., & Elsas, S. M. (2006). Vigilance, alertness, or sustained attention: Physiological basis and measurement. Clinical Neurophysiology, 117(9), 1885–1901. https://doi.org/10.1016/j.clinph.2006.01.017
- Page, G. G., Opp, M. R., & Kozachik, S. L. (2016). Sex differences in sleep, anhedonia, and HPA axis activity in a rat model of chronic social defeat. Neurobiology of Stress, 3, 105–113. https://doi.org/10.1016/j.ynstr.2016.03.002
- Palacios-García, I., Silva, J., Villena-González, M., Campos-Arteaga, G., Artigas-Vergara, C., Luarte, N., Rodríguez, E., & Bosman, C. A. (2021). Increase in beta power reflects attentional top-down modulation after psychosocial stress induction. Frontiers in Human Neuroscience, 15, 630813. https://doi.org/10.3389/fnhum.2021.630813
- Paul, K. N., Losee-Olson, S., Pinckney, L., & Turek, F. W. (2009). The ability of stress to alter sleep in mice is sensitive to reproductive hormones. Brain Research, 1305, 74–85. https://doi.org/10.1016/j.brainres.2009.09.055
- Perlis, M. L., Merica, H., Smith, M. T., & Giles, D. E. (2001). Beta EEG activity and insomnia. Sleep Medicine Reviews, 5(5), 363–374. https://doi.org/10.1053/smrv.2001.0151
- Rajendran, V. G., Jayalalitha, S., & Adalarasu, K. (2021). EEG based evaluation of examination stress and test anxiety among college students. IRBM [Internet]. [cited 2022 Mar 14]. https://www.sciencedirect.com/science/article/pii/S1959031821000798
- Rempe, M. J., Clegern, W. C., & Wisor, J. P. (2015). An automated sleep-state classification algorithm for quantifying sleep timing and sleep-dependent dynamics of electroencephalographic and cerebral metabolic parameters. Nature and Science of Sleep, 7, 85–99. https://doi.org/10.2147/NSS.S84548
- Rothe, N., Steffen, J., Penz, M., Kirschbaum, C., & Walther, A. (2020). Examination of peripheral basal and reactive cortisol levels in major depressive disorder and the burnout syndrome: A systematic review. Neuroscience and Biobehavioral Reviews, 114, 232–270. https://doi.org/10.1016/j.neubiorev.2020.02.024
- Sanford, L. D., Suchecki, D., & Meerlo, P. (2015). Stress, arousal, and sleep. Current Topics in Behavioral Neurosciences, 25, 379–410. http://www.ncbi.nlm.nih.gov/pubmed/24852799 https://doi.org/10.1007/7854_2014_314
- Sheikh, J. I., Leskin, G. A., & Klein, D. F. (2002). Gender differences in panic disorder: Findings from the National Comorbidity Survey. The American Journal of Psychiatry, 159(1), 55–58. https://doi.org/10.1176/appi.ajp.159.1.55
- Smit, A. S., Eling, P. A. T. M., Hopman, M. T., & Coenen, A. M. L. (2005). Mental and physical effort affect vigilance differently. International Journal of Psychophysiology, 57(3), 211–217. https://doi.org/10.1016/j.ijpsycho.2005.02.001
- Spiegelhalder, K., Regen, W., Feige, B., Holz, J., Piosczyk, H., Baglioni, C., Riemann, D., & Nissen, C. (2012). Increased EEG sigma and beta power during NREM sleep in primary insomnia. Biological Psychology, 91(3), 329–333. https://doi.org/10.1016/j.biopsycho.2012.08.009
- Suh, S., Cho, N., & Zhang, J. (2018). Sex differences in insomnia: From epidemiology and etiology to intervention. Current Psychiatry Reports, 20(9), 69. https://doi.org/10.1007/s11920-018-0940-9
- Swaab, D. F., & Bao, A. M. (2020). Sex differences in stress-related disorders: Major depressive disorder, bipolar disorder, and posttraumatic stress disorder. Handbook of Clinical Neurology, 175, 335–358. https://doi.org/10.1016/B978-0-444-64123-6.00023-0
- Tement, S., Pahor, A., & Jaušovec, N. (2016). EEG alpha frequency correlates of burnout and depression: The role of gender. Biological Psychology, 114, 1–12. https://doi.org/10.1016/j.biopsycho.2015.11.005
- Thompson, R. L., Lewis, S. L., Murphy, M. R., Hale, J. M., Blackwell, P. H., Acton, G. J., Clough, D. H., Patrick, G. J., & Bonner, P. N. (2004). Are there sex differences in emotional and biological responses in spousal caregivers of patients with alzheimer’s disease? Biological Research for Nursing, 5(4), 319–330. https://doi.org/10.1177/1099800404263288
- Tsutsui, R., Shinomiya, K., Sendo, T., Kitamura, Y., & Kamei, C. (2015). Effects of the 5-HT(1A) receptor agonist tandospirone on ACTH-induced sleep disturbance in rats. Biological & Pharmaceutical Bulletin, 38(6), 884–888. https://doi.org/10.1248/bpb.b14-00887
- Vanini, G., & Baghdoyan, H. A. (2013). Extrasynaptic GABAA receptors in rat pontine reticular formation increase wakefulness. Sleep, 36(3), 337–343. https://doi.org/10.5665/sleep.2444
- Vazquez-Palacios, G., & Velazquez-Moctezuma, J. (2000). Effect of electric foot shocks, immobilization, and corticosterone administration on the sleep-wake pattern in the rat. Physiology & Behavior, 71(1–2), 23–28. https://doi.org/10.1016/s0031-9384(00)00285-7
- Vázquez-Palacios, G., Retana-Márquez, S., Bonilla-Jaime, H., & Velázquez-Moctezuma, J. (2001). Further definition of the effect of corticosterone on the sleep–wake pattern in the male rat. Pharmacology, Biochemistry, and Behavior, 70(2–3), 305–310. https://doi.org/10.1016/s0091-3057(01)00620-7
- Vinkers, C. H., Penning, R., Hellhammer, J., Verster, J. C., Klaessens, J. H. G. M., Olivier, B., & Kalkman, C. J. (2013). The effect of stress on core and peripheral body temperature in humans. Stress (Amsterdam, Netherlands), 16(5), 520–530. https://doi.org/10.3109/10253890.2013.807243
- Vyazovskiy, V. V., & Delogu, A. (2014). NREM and REM sleep: Complementary roles in recovery after wakefulness. The Neuroscientist: A Review Journal Bringing Neurobiology, Neurology and Psychiatry, 20(3), 203–219. https://doi.org/10.1177/1073858413518152
- Wang, C., Ramakrishnan, S., Laxminarayan, S., Dovzhenok, A., Cashmere, J. D., Germain, A., & Reifman, J. (2020). An attempt to identify reproducible high-density EEG markers of PTSD during sleep. Sleep, 43(1), zsz207. https://doi.org/10.1093/sleep/zsz207
- Wang, R., Kogler, L., & Derntl, B. (2024). Sex differences in cortisol levels in depression: A systematic review and meta-analysis. Frontiers in Neuroendocrinology, 72, 101118. https://doi.org/10.1016/j.yfrne.2023.101118
- Wang, Z. J., Yu, B., Zhang, X. Q., Sheng, Z. F., Li, S. J., Huang, Y. L., Cao, Q., Cui, X. Y., Cui, S. Y., & Zhang, Y. H. (2014). Correlations between depression behaviors and sleep parameters after repeated corticosterone injections in rats. Acta Pharmacologica Sinica, 35(7), 879–888. https://doi.org/10.1038/aps.2014.44
- Winsky-Sommerer, R., Boutrel, B., & de Lecea, L. (2005). Stress and arousal: The corticotrophin-releasing factor/hypocretin circuitry. Molecular Neurobiology, 32(3), 285–294. https://doi.org/10.1385/MN:32:3:285
- Wright, C. J., Milosavljevic, S., & Pocivavsek, A. (2023). The stress of losing sleep: Sex-specific neurobiological outcomes. Neurobiology of Stress, 24, 100543. https://doi.org/10.1016/j.ynstr.2023.100543
- Xi, K., Huang, X., Liu, T., Liu, Y., Mao, H., Wang, M., Feng, D., Wang, W., Guo, B., & Wu, S. (2021). Translational relevance of behavioral, neural, and electroencephalographic profiles in a mouse model of post-traumatic stress disorder. Neurobiology of Stress, 15, 100391. https://doi.org/10.1016/j.ynstr.2021.100391
- Xu, Y. X., Liu, G. Y., Ji, Z. Z., Li, Y. Y., Wang, Y. L., Wu, X. Y., Liu, J. L., Ma, D. X., Zhong, M. K., Gao, C. B., & Xu, Q. (2023). Restraint stress induced anxiety and sleep in mice. Frontiers in Psychiatry, 14, 1090420. https://doi.org/10.3389/fpsyt.2023.1090420
- Zhao, W., Van Someren, E. J. W., Li, C., Chen, X., Gui, W., Tian, Y., Liu, Y., & Lei, X. (2021). EEG spectral analysis in insomnia disorder: A systematic review and meta-analysis. Sleep Medicine Reviews, 59, 101457. https://doi.org/10.1016/j.smrv.2021.101457