1 Introduction
Inside human body, various rhythmic impulses with range of time less than a second to years correspond to different physiological changes (Goldbeter Citation2005). Among these rhythmic impulses, blood pressure, heart rate and breathing have been usually studied. Blood pressure, heart rate and breathing are now used in order to define frequencies associated with control of autonomic nervous system (Task Force 1996). Studying these frequencies is needed to better understand and evaluate human homeostatic control.
Some of these frequencies could be assessed by cranial and sacral osteopathic manipulative perception (OMP) (Nelson 2006). This osteopathic manipulative perception has been initially developed by (Sutherland Citation1939). To our knowledge, few studies have observed good reliability between OMP and scientific assessment in order to measure cranial rhythmic impulse (CRI) (Nelson 2006). These studies used laser doppler blood flow to show relationships between: i) 0.02 Hz frequency that could be associated with thermoregulation, ii) 0.1 Hz and 0.25 Hz that could be associated with sympathetic baroreflex sensitivity, iii) 0.39 Hz frequency that could be associated with vagal reflex response (Nelson 2006).
Osteopathic and scientific communities focused on the specific frequencies analysis of human rhythms and tried to develop accurate devices that can assess to CRI. Nowadays, non-invasive and easily devices and sensors are developed in order to monitor heart rate (Shafiq 2014, Chan 2013). Other non-invasive devices like eddy currents sensors have been used in order to estimate cranial micro-motion on skin (Stubbe 2015). However, if Stubbe et al have shown cranial three dimensional motion using a eddy current, more sensors or markers are needed to define more accurately conformational change of the head. On another point of view, Shafiq & Veluvolu have shown that kinematics analysis like Vicon system can be used in order to assess to human micro-motion like heart rate monitoring (Chan 2013).
The aim of the present study is to define if kinematic analysis can estimate micro-motion frequency on head’s skin of the subject during imposed breathing.
2 Methods
This study was performed with twelve healthy subjects (mean ± standard deviation) size = 170.3 ± 12.5 cm, weight = 59.4 ± 16.3 kg, age = 19.7 ± 0.9 years. All the subjects approved the study protocol and provided an informed consent for their participation. The study complied with the Helsinki declaration. In total, twenty seven recording were studied.
Each subject was laid on back and had to remain quiet and immobile. The subject performed breathing at respiratory frequency equal to 0.25 Hz imposed by auditory signal during seven minutes. For each measurement, subject’s breathing was monitored with spirometry (ADInstrument, sampling frequency 1000 Hz). Fast Fourier transform analysis (FFT) of ventilatory data of spirometry were calculated in order to confirm the breathing frequency at 0.25 Hz.
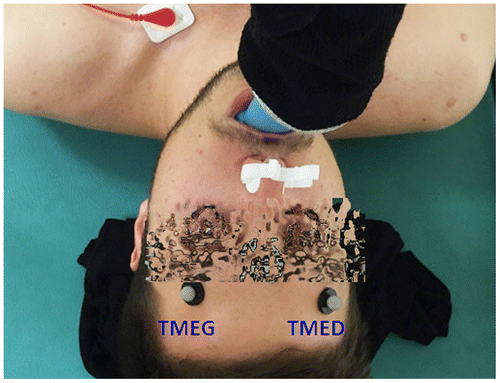
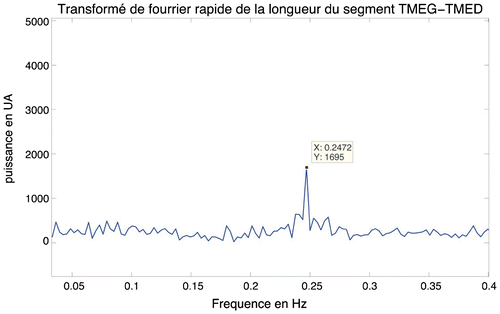
In the same time, two retro reflexive markers were attached on the subject’s hemi frontal head (Figure ). Three dimensional position of each landmark were recorded using eight MX cameras and a system Vicon Nexus 1.8.5 (sampling frequency of 100 Hz). Length variation between markers position were computed (TMED and TMEG). Fast Fourier transform analysis of length variation was calculated. All data were computed on Matlab 2015a. The highest amplitude of frequency around 0.25 Hz was defined (Figure ) and compared with the spirometry results. Test of means against reference constant value was done in order to compare frequency data between kinematic analysis and spirometry.
3 Results and discussion
Frequency of spirometry data presented a constant value equal to Fspi = 0.248 ± 0.00 Hz. Frequency of kinematic data presented mean value equal to Fvic = 0.247 ± 0.007 Hz. No significant difference was observed between frequencies estimated by both devices (p = 0.37).
FFT analysis of spirometry data during seven minutes showed that the twenty seven trials were performed at constant frequency of 0.248 Hz. These results confirm other study about the interest to use auditory signal in order to control human breathing (Wang 2013). FFT analysis of length variation of markers using kinematic system showed that breathing frequency may be estimated by markers attached to the head. According to previous studies on the relationships between breathing and heart rate variability (Wang 2013), complementary experiments will be done with other breathing frequencies imposed to the subject in order to confirm this result. Length markers variations observed on the head could be associated with components of CRI usually presented in osteopathic manipulative perception, according to Sutherland’s concept (Sutherland Citation1939).
4 Conclusions
This study has shown that accurate kinematic analysis can be used as new device in order to define micro-motion of skin on frontal head. This result may be used for non-invasive cranial rhythmic impulse analysis. On the basis of these first results, complementary studies could be realized in order to compare accuracy and reliability between breathing estimated by head micro-motion and spirometry. Using this new non-invasive method, cranial rhythmic impulse and their neighboring frequencies could be studied and compared with osteopathic manipulative perception. This new field of studies is necessary to validate Sutherland’s concept.
Acknowledgements
The authors wish to thanks R. Caporossi, C. Caporossi, O. Caporossi, S. Pin, A. Lodini and J. Sanchez for their confidence and support.
References
- Chan A.M, Selvaraj N, Ferdosi N, Narasimhan R. 2013. Wireless patch sensor for remote monitoring of heart rate, respiration, activity, and falls. 2013;35th Annual International Conference of the IEEE Engineering in Medicine and Biology Society (EMBC). 6115–8.
- Goldbeter A. 2005. Temps et rythmes biologiques. SRSL. 74(4):299–310.
- Nelson KE, Sergueef N, Glonek T. 2006. The Effect of an Alternative Medical Procedure Upon Low-Frequency Oscillations in Cutaneous Blood Flow Velocity. Journal of Manipulative and Physiological Therapeutics. 8:626–36.
- Shafiq G, Veluvolu KC. 2014. Surface Chest Motion Decomposition for Cardiovascular Monitoring. Sci. Rep. 4:5093.
- Stubbe L, Le Bihan Y, Ozout AE, Herivan G, Berthelot E. 2015. An Eddy Current System for the Study of the Cranial Rhythmic Impulse. IEEE Transactions on Magnetics. 51(1).
- Sutherland WG. 1939. The cranial bowl. Mankato Minn: Free Press Co..
- Task Force of the European Society of Cardiology the North American Society of Pacing. 1996. Heart Rate Variability. Standards of Measurement, Physiological Interpretation, and Clinical Use. Circulation. 93(5):1043–65.
- Wang YP, Kuo TBJ, Lai CT, Chu JW, Yang CCH. 2013. Effects of respiratory time ratio on heart rate variability and spontaneous baroreflex sensitivity. J Appl Physiol. 115:1648–55.


