
 ?Mathematical formulae have been encoded as MathML and are displayed in this HTML version using MathJax in order to improve their display. Uncheck the box to turn MathJax off. This feature requires Javascript. Click on a formula to zoom.
Abstract
Pressure ulcers occur due to sustained mechanical loading. Deep tissue injury is a severe type of pressure ulcer, which is believed to originate in subcutaneous tissues adjacent to bony prominences. In previous experimental-numerical studies the relationship between internal tissue state and damage development was investigated using a 2D analysis. However, recent studies suggest that a local analysis is not sufficient. In the present study we developed a method to create animal-specific 3D finite element models of an indentation test on the tibialis anterior muscle of rats based on MRI data. A detailed description on how the animal specific models are created is given. Furthermore, two indenter geometries are compared and the influence of errors in determining the indenter orientation on the resulting internal strain distribution in a defined volume of tissue was investigated. We conclude that with a spherically-shaped indenter errors in estimating the indenter orientation do not unduly influence the results of the simulation.
Introduction
A pressure ulcer is defined as: “a localized injury to the skin and/or underlying tissue, usually over a bony prominence, resulting from sustained pressure or pressure associated with shear” (NPUAP et al. Citation2014). Pressure ulcers may originate in the superficial skin layers and progress towards the deeper tissues, or in the deeper tissue near a bony prominence and progress to the skin surface. The latter case is termed a deep tissue injury where, in its early stage, the skin remains intact. Deep tissue injury is particularly a problem for insensate individuals, such as the spinal cord injured or unconscious individuals, since their lack of sensation does not alert them of a developing ulcer. These wounds progress rapidly and are usually categorised as stage 3 or 4 following skin breakdown (NPUAP et al. Citation2014) with an unpredictable prognosis.
In the last decades much knowledge has been acquired related to the onset of pressure ulcers. Mechanisms that cause tissue damage include: ischaemia, direct cellular deformation, ischaemia-reperfusion damage and impairment of lymphatic drainage (Loerakker et al. Citation2011; Oomens et al. Citation2015). However detailed knowledge is still lacking on the spatial-temporal evolution of damage, how different damage mechanisms interact, to what extent tissue damage is reversible and how rapid tissue remodels.
Insight into the aetiology of pressure ulcers, in particular the effects of cellular deformation, was obtained by a series of studies in the host laboratory involving indentation of the tibialis anterior muscle of Brown-Norway rats with the resulting damage monitored using magnetic resonance imaging (MRI). Muscle damage was reported in a localized zone directed from the indenter to the bone and was found to correlate histologically with increased MRI derived T2-values (Bosboom et al. Citation2003, Citation2001). These MRI methods enabled tracking of the temporal profile of tissue damage in an in vivo model. To compare internal tissue strains and tissue damage an MR-compatible indentation device was subsequently developed (Stekelenburg et al. Citation2006). Based on the MR data, dedicated 2D plane stress finite element (FE) models were created and validated, leading to the establishment of a threshold value of maximum shear strain above which tissue damage will be induced (Ceelen et al. Citation2008a, Citation2008b). In addition, after optimization of the model, the threshold was found to be similar for different loading regimens and a marked correlation was found between damaged area and applied strain energy (Loerakker et al. Citation2013, Citation2010). In order to facilitate the use of 2D FE modelling techniques an oblong rounded bar-shaped indenter, with its long axis parallel to the target muscle, was used in all these studies since this provided approximate plane stress conditions.
Recent MR data obtained from a similar experiment, showed that muscle damage extends along the muscle fibres, beyond the local indentation site (Nelissen et al. Citation2018). Since damage evolution was demonstrated to be a more complex 3D phenomenon, analysis of such experimental findings requires an extension of the existing 2D methods to 3D FE investigations. Formulation of 3D computational models is not trivial as it requires detailed 3D geometries, 3D meshing techniques, and knowledge of the 3D, and potentially spatially varying, boundary conditions. The latter must consider the appropriate representation of the indenter, the plaster cast that is used to fixate the leg and small movements of the tibial bone. The current paper describes the development approach of such a 3D FE model and the tools required for appropriate definition of boundary conditions. In addition, it addresses how the internal strain distribution is affected by: (i) the choice of indenter geometry, i.e. an oblong rounded bar or spherical shape, and (ii) perturbations in indenter orientation.
Materials and methods
Animal model
Analysis was performed on Sprague-Dawley rats that were part of a larger study on damage development in rats (Nelissen et al. Citation2018, Citation2017). For the study described in this paper, data of 10 female rats (11–14 weeks, Charles River, Paris, France) were used. Animals were housed under controlled laboratory conditions (12 hour light/dark cycles) with standard food and water provided ad libitum.
Experimental protocol
The experimental protocol has been recently detailed (Nelissen et al. Citation2017). Briefly, the animals were anesthetized with isoflurane (3–4 vol% for induction, 0.8–2 vol% for maintenance), in 0.6 l/min medicinal air. Buprenorphine (0.05 mg/kg) was injected subcutaneously for analgesia and ointment was applied to prevent dehydration of the eyes. Each animal was placed supine on a heating blanket to maintain body temperature between 35 and 37 °C, as monitored by a rectal probe. Breathing rate was monitored with a balloon pressure sensor and maintained within the physiological range (50–80 breaths per minute) by fine-tuning the anaesthesia. The hairs of the right hind limb were shaven before the limb was fixated with alginate in a holder. A hollow cylindrical indenter with a spherical head of 3 mm diameter was filled with 1g/l CuSO4 solution enabling MRI visualization. Indentation was applied manually and maintained for a period of 2 hours. MR images were recorded before, during and following the indentation period. The animal experiment was approved by the Animal Care and Use Committee of Maastricht University, Maastricht, The Netherlands (protocol 2013-047) and performed in accordance with the Directive 2010/63/EU for animal experiments of the European Union.
MR measurement
MRI was performed with a 7.0 T small animal MRI scanner, using an 86-mm diameter quadrature transmit coil and a 20-mm diameter surface receive coil (Bruker Biospin MRI GmbH, Ettlingen, Germany).
The geometry of the limb was assessed with T1-weighted MRI using multi-slice-multi-echo sequence in axial orientation with 20 × 1-mm-thick slices, field of view: 25 × 25 mm2, 256 × 256 reconstruction matrix, fat suppression, echo time: 11.5 ms and repetition time: 800 ms.
FE model
All pre- and post-processing of the model was performed with MATLAB (R2013b, the Mathworks, Matick, MA, USA) scripts developed based on the open source MATLAB toolbox GIBBON (v1.01 (Moerman Citation2018). Meshing and FE analysis was performed with Abaqus (2017, Dassault Systèmes Simulia corp., Providence, RI, USA).
Segmentation and contour creation
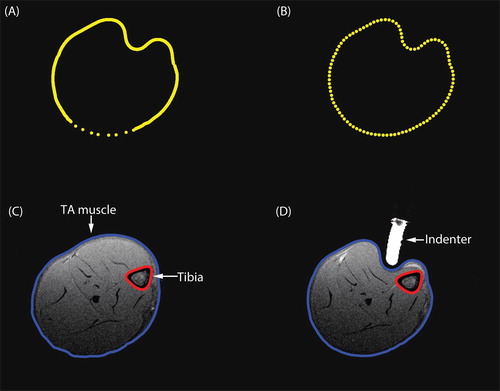
The skin and tibial contours were segmented from the T1-weighted images with a semi-automatic algorithm based on iso-contours of signal intensity. A surface coil was used in combination with a volume coil to obtain high quality MR images in a reasonable time frame. The use of a surface coil introduced a gradient in the images, which resulted in some regions with poor signal-to-noise ratio. This necessitated manual segmentation, which is illustrated by the less dense contour points in the lower part of the leg in . The segmented contours were redefined to have circumferentially equidistant points by performing a shape-preserving piecewise cubic interpolation, as illustrated in . By translating the coordinates from Cartesian to cylindrical coordinates, the indices were redefined to start at a fixed angle, after which the indices were translated back to Cartesian coordinates (). The resulting contours are shown together with the T1-weighted image in one slice in the unloaded and loaded state in , respectively.
Figure 1. (A) The original segmented skin contour during loading. The lower part of the skin contour was manually segmented leading to fewer contour points. (B) The redefined skin contour with equidistant points. (C–D) T1-weighted image with the skin contour in blue and the tibial contour in red. (C) before indentation, (D) during indentation.
Cast contours were created by copying the skin contours before indentation and applying a radial offset of 0.2 mm. To ensure that the cast was longer than the leg, the first and last contour were duplicated and positioned with an offset of 1 mm.
Geometry, meshing and materials
The model consists of 3 components: limb, indenter and cast. To create the geometry of the leg, the skin and bone contours were imported into Abaqus. The skin contours were connected slice by slice to create the skin surface. The same was done for the bone contours. The soft tissue volume was closed by connecting the skin and bone contours of both the first and the last slice. To reduce computational time a contact area was defined on the skin surface specifically for contact with the indenter. To define this area, a circle (6 mm in diameter) was created that hovered above the skin and that was concentric with the indenter long axis. The projection of this circle along the indenter long axis onto the skin defined the region where skin-indenter contact was prescribed by partitioning the surface. If necessary, the size and position of the contact area were adjusted manually. The limb was meshed with quadratic tetrahedral elements with modified hourglass control and hybrid linear pressure formulation (C3D10MH), with a mesh seed between 1 and 0.9. The mesh seed was kept constant between models of the same animal. The bone surface was defined as a rigid surface. The constitutive behaviour of the soft tissue of the leg was modelled using the following uncoupled and first-order Ogden hyperelastic formulation:
(1)
(1)
with the strain energy,
the principal stretches and
the deformation gradient tensor. The material parameters used were based on previous work:
= 3.65 kPa,
= 5,
= 57 mm2/N (Loerakker et al. Citation2010).
The indenter was modelled as an analytical rigid. A surface representing the cast was created by lofting the contours that were created earlier. To allow indentation, a circular hole (±6 mm in diameter) was made in the cast. In the model the hole was created by introducing a circular wire (6 mm in diameter) above the cast concentric with the indenter long axis. The projection of this wire onto the surface was used to partition the surface of the cast and to remove the inner surface. The wire was connected to the cast to create the final geometry. However, due to the complex geometry connecting the wire to the cast was not always possible. In those cases the location, size and orientation were adjusted manually. The cast was modelled as a rigid body and meshed with three dimensional, 3-node surface elements (SFM3D3).
Boundary conditions
The indenter movement was derived from the T1-weighted images. To achieve this a signal intensity threshold, combined with a connected component threshold was used to identify the group of voxels with contrast fluid inside the indenter. The orientation of the indenter was determined by calculating the eigenvectors of the moment of inertia tensor based on the contrast fluid voxel group (, green arrow).
Figure 2. (A) Axial and sagittal cross sections of the T1-weighted scan. The group of voxels labelled with contrast fluid (red) with corresponding eigenvectors. The green arrow represents the orientation of the indenter used for FE analysis. (B–C) The skin contour (grey) and the cylinder (red) which defined the skin coordinates in the ROI for indentation. The indenter orientation is shown in blue. (B) top view. (C) side view. (D–E) The skin contour (grey) with the indenter orientation (black arrow), the indenter original position (orange) and end position (green). (D) the skin region associated with indentation (pink). (E) an enlargement of the intersection of the skin contours before indentation with the indenter orientation (red dot, indicated by the blue arrow).
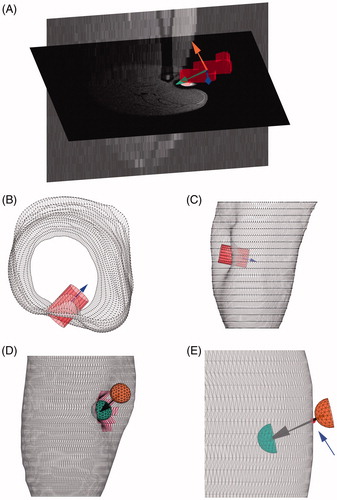
To accurately determine the indentation depth the intersection of the skin with the main axis of the indenter was obtained. Since 2 intersections could be identified, one at the site of indentation and one on the opposite side of the leg, a search area needed to be defined to restrict the skin surface to a region of interest (ROI). A concentric cylinder (5 mm in diameter) around the indenter long axis was used as a search area to isolate the vertices in the ROI of the deformed skin contours (). To dismiss the skin vertices on the opposite side of the leg, the length of the cylinder was chosen such that it penetrated the skin surface to a maximum of 1.5 mm. The resulting ROI is illustrated by the pink region in . An initial estimate of the penetration depth was made by finding the skin vertex in the ROI with the maximal distance to the centre of mass (COM) of the indenter. This vertex did not lie exactly on the long axis of the indenter. The projection of the vertex onto the indenter long axis was used as the final position of the tip of the indenter.
The initial position of the indenter was obtained by using the skin contours before indentation. The intersection of the main axis of the indenter with the skin contours, nearest to the COM, was computed, as indicted by the red dot in . An extra 1 mm was added to ensure that the leg and the indenter were separated at the start of the simulation. In the simulations the indenter was translated from the initial to the final position. Frictionless surface to surface contact between the indenter (master) and skin (slave) was modelled with finite sliding and ‘hard’ contact.
Although the leg was immobilized, it was inevitable that the indentation caused a small translation and rotation of the bone underneath the tibialis anterior muscle. The movement of the COM of the bone was used to determine the translation. To determine the rotation, the bone vertices before and during indentation were first translated such that the COM’s coincided. Next the rotation needed to align these bone states was found by minimizing the vector of squared distances to nearest vertices, based on the Levenberg-Marquardt algorithm as implemented in the MATLAB lsqnonlin function (). The determined translation and rotation were applied as essential boundary conditions in the simulation.
Figure 3. The bone contours before (black) and during (grey) indentation. (A) at original positions. (B) with coinciding COM’s. (C) after minimization of the distances to the nearest vertices.
The position of the cast was fixed in space. Frictionless surface to surface contact was modelled between the cast (master) and skin (slave) in a similar manner to the indenter skin contact.
No boundary conditions were applied to the proximal and distal end of the soft tissue.
To prevent FE convergence issues the boundary conditions were applied in four steps. Step 1–3 involved the rotation of the bone about the different axis. Step 4 contained the translation of the bone and the translation of the indenter. Boundary conditions of the bone were applied on its COM.
Model adaptations
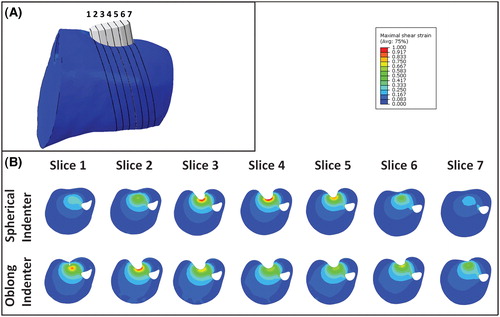
To analyse the effect of indenter choice, for each animal both types of indenters were simulated in the present study: (i) the indenter used during the current experiments with a spherical head of 3 mm in diameter (); (ii) the oblong rounded bar-shaped indenter used in previous studies, incorporating a cylinder of 3 mm with hemispherical ends of 3 mm diameter. ().
Figure 4. (A) The spherically-shaped indenter used in the current experiment. (B) The oblong rounded bar-shaped indenter modelled used in previous experiments. (C) Top view of all tested indenter orientations: purple +15° X-axis, green -15° X-axis, red +15° Z-axis, blue +15° Z-axis, grey (in the middle) the indenter orientation estimated from the MR images (D) Side view of all tested indenter orientation. The intersection of the indenter axis is the end position of the indenter. (E-F) The FE models, with the leg in blue, the cast in white and the indenter in red. (E) with spherically-shaped indenter used in current experiments. (F) with oblong bar-shaped indenter used in previous experiments.
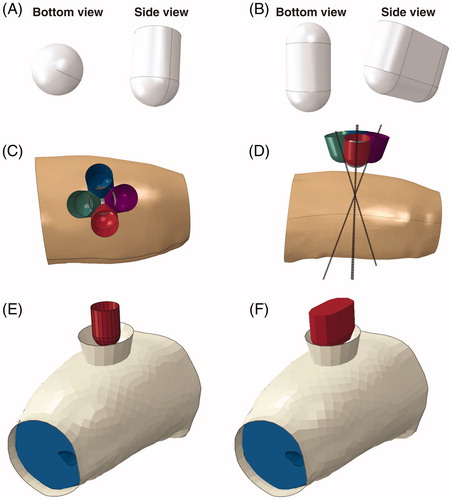
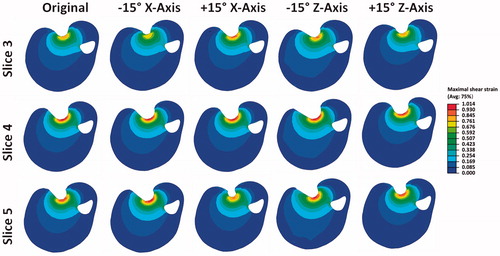
To investigate the sensitivity of the model to small errors in determining the indenter orientation the models were run with 5 different indenter orientations: the orientation as it was originally derived from the MRI images (, grey indenter in the middle), two variations with a ±15° offset with respect to the X-axis (green and purple indenter), two variations with a ±15° offset with respect to the Z-axis (red and blue indenter). An offset of 15° was chosen as this was deemed in excess of the predicted error in the method of deriving the indenter orientation described earlier. As such, these offset orientations can be viewed as extreme or ‘worst case’ scenarios. For each animal a total of 6 models were created.
Post-processing
Comparing peak strains between simulations has been previously employed in pressure-ulcer-related studies (Sopher et al. Citation2011). However, the peak strain in a model can be influenced by very local phenomena such as tiny curvatures in the bone, causing very high gradients in the displacement field. Therefore, the overall peak strain is not considered a reliable metric to compare FE models. As a consequence, recent studies have employed an alternative approach involving the volume of the tissue with strains in a certain strain interval to compare loading regimens (Moerman et al. Citation2016; Oomens et al. Citation2016, Citation2013).
The maximum shear strain was defined according to EquationEquation 4(4)
(4) :
(4)
(4)
with E1 the maximum principal strain and E3 the minimum principal strain. The maximum shear strain on the centroid of the elements and the volume per element were exported from Abaqus. Most of the leg modelled was not affected by the indentation (Ceelen et al. Citation2008a); ≥97% of the leg of the models with the spherically shaped indenter had a < 0.3. A volume of interest (VOI) was defined as the volume with shear strain levels >0.3. Shear strain ranges were defined as: 0.3–0.4, 0.4–0.5, 0.5–0.6, 0.6–0.7, 0.7–0.8, 0.8–0.9, 0.9–1.0, >1.0. For each shear strain range, the volume percentage of the VOI was determined using these criteria.
Results
Comparison indenter geometries
A comparison between the results using both spherical and oblong-shaped indenters are shown for animal 2 in . The 7 cross sections through the tissue are orientated in line with the indenter orientation and spaced 1 mm apart as illustrated by , with the corresponding maximum shear strains in . For all models with the oblong-shaped indenter the highest strains were found in the regions around the hemispherical side and not centrally underneath the indenter. Depending on the angle of indentation this occurred at either one or both hemispheres. For the models with the spherically-shaped indenter the highest strains were found in the slice passing through the middle of the indenter (slice 4).
Figure 5. (A) Schematic to identify the cross sections. (B) Cross section of the maximum shear strain for the indenter with spherical head (top row) and the oblong-shaped head (bottom row)
The effects of indentation angles
A comparison between the results of all indenter orientations for the spherical indenter is shown for slices 3–5 of animal 2 in . It was evident that changing the indenter orientation resulted in a minor change in both the location of the VOI and the associated distributed strain. This is exemplified by the +15° offset around the X-axis. In this particular case, higher strains were estimated in slice 3 compared to slice 3 in the original model (top row, ).
Figure 6. Cross sections of the maximum shear strain in three slices for the 5 orientations of the spherically-shaped indenter.
The VOI with strains higher than 0.3 is shown in . In all models, except animal 3, a +15° offset around the X and Z-axis resulted in an increase in the VOI, whereas a −15° offset resulted in a decreased VOI. The increase in volume was larger than the decrease with a maximum of 12.8 (20%) and 7.0 (13%) mm3, respectively. The average change in volume of the models was 1.40 mm3.
Figure 7. Results for the spherically-shaped indenter for each animal and model the (A) VOI is shown. (B) volume percentage of the VOI is shown per specific maximum shear strain range.
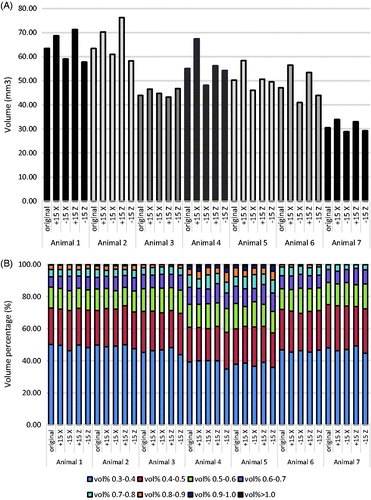
The strain range per volume percentage of the VOI for each model is shown in . Note that despite the intra-variations in VOI between models, the strain distribution remained approximately the same. For example, the distribution of the shear strains up to 0.6 was very similar within animals (approx. 85%). Even between animals it was similar, although the percentage was slightly smaller for animals 4 and 5.
Discussion
In the present study a method is described to semi-automatically derive animal-specific FE models from MRI. The current method is an extension of previously described 2D models (Ceelen et al. Citation2008b, Citation2008a, Loerakker et al. Citation2013, Citation2010) to 3D to enable a more complete analysis across the whole limb. Experimentally a new geometry was used which had a marked influence on the strain distribution as evaluated by FE modelling. Perturbations in the estimated indenter orientation did not unduly influence the results of the simulations.
For the previously used oblong bar-shaped indenter the highest strains were estimated to occur near the hemispherical regions (slices 1–2, ) as opposed to the central region of the indenter (slices 3–5, ). Because of the curved geometry of the leg it was challenging to position the indenter perpendicular to the skin surface and/or parallel to the bone. Discrepancies in the orientation for this indenter were found to have an effect on the location and magnitude of the highest strains. Therefore the 2D studies conducted previously (Ceelen et al. Citation2008b, Citation2008a, Loerakker et al. Citation2013, Citation2010) may have slightly underestimated the maximum shear strains. This will influence the strains that represent the threshold above which deformation damage starts to occur in rats. However, it would be unwise to directly translate these threshold values to a human model, given the inherent variability between individual patients.
To evaluate the effects of the error in estimating the indenter orientation 4 offsets were simulated for each model. These offsets were chosen such that they represent a ‘worst case scenario’, i.e. the offset angle of 15° was deemed higher than the predicted error in the actually determined indenter orientation. This was validated by visually comparing the contours of the skin obtained from MRI to the skin surfaces that resulted from the FE analysis using the different offsets (data not shown). All indenter offsets resulted in a poorer agreement between the FE model and the MRI contours. The effects of the offsets on the size of the VOI were small, typically <15% for 83% of the models, and were minimal on the strain distribution within the VOI.
The creation and analysis of these 3D animal specific computational models is not trivial, as described by other authors as well (Luboz et al. Citation2015; Moerman et al. Citation2016; Ganpule et al. Citation2017). Due to the complexity of the geometry and boundary conditions of these models, manual intervention remains necessary in our case. Furthermore, convergence was not always obtained, due to severe distortion of elements, which could be aided by re-meshing and contact issues, which might be resolved by using an explicit analysis. When one or more models for an individual rat experiment did not reach convergence, all models of that specific animal were excluded from the analysis. Seven animals were deemed sufficient to perform the analysis
In the current study a visual comparison between the FE predicted skin contours and the MRI measured contours (data not shown) was made to evaluate which indenter orientation matched best to the experimental data. Other methods might be used to compare the FE results to the experiments. Actual strains may be compared by using MRI based deformation measurements techniques e.g. SPAMM (spatial modulation of magnetization) (Ceelen et al. Citation2008b; Moerman et al. Citation2013).
All soft tissues were modelled together as one isotropic nonlinear elastic material. Sprague-Dawley rats have a negligible amount of subcutaneous fat rendering it unnecessary to model this separately. Although the skin would absorb some of the loading, modelling the skin separately would have negligible effects on the outcomes described here due to the very thin thickness of the skin and the loose skin properties of Sprague-Dawley rats. Material parameters were based on a previous study (Loerakker et al. Citation2013) and were kept constant for all animals. These parameters would in reality be subject-specific. The objective of this study was to compare model variation within animals, so adjustment of the material properties would not influence the outcomes.
Muscle tissue is well-known for its anisotropic properties. (Van Loocke et al. Citation2006; Böl et al. Citation2014). Addition of anisotropy and its mechanical properties would be a logical next step in the 3D modelling of muscle tissue. Diffusion tensor imaging could be performed to obtain the muscle fibre directions for each specific animal. In the current experiments animals where under anaesthesia for 6 hours. Addition of diffusion tensor imaging to the protocol would mean extending the anaesthesia time, which was considered to be undesirable by the authors. Because animal specific data on fibre direction was not obtained experimentally, anisotropy was not included in the model. One option would be to obtain the muscle fibre directions for a few animals separately and to morph the structure into the animal specific geometries. This would only benefit the model if appropriate mechanical properties are implemented as well. To do so the mechanical properties should be determined experimentally for the rats, preferably in different directions for compression as well as stretch. Van Loock et al. reported only small differences (±2-fold) in material parameters describing the transverse and longitudinal Youngs modulus of fresh porcine muscle tissue. With such small differences it is unlikely that the outcome of our simulations would be highly affected.
It has been well established that it is impossible to perform these animal studies in such a way to produce an a priori strain distribution (Bosboom et al. Citation2003; Stekelenburg et al. Citation2006). The position of the indenter is difficult to reproduce and due to biological variability each animal will present with a different geometry of soft tissues and bone. This limitation could be overcome through the use of dedicated FE models, enabling a detailed reconstruction of the mechanical loading conditions applied to each animal. The benefit of studying multiple animal experiments with varying indentation locations and orientations, when combined with dedicated and 3D FE, is that a large variety in deformation states and deformation magnitudes can be examined. In this paper we have expanded the single slice 2D analysis considerably by combining a 3D MRI and 3D FE analysis of the entire leg region. With this experimental approach a multitude of other parameters could simultaneously be obtained, which from a conceptual standpoint has clearly ethical benefits. A comparison of the mechanical loading state with the physiological damage response, as measured with other MRI parameters, histology and biochemical analysis of blood and urine, was outside the scope of the current study, and will be the focus of future work.
Acknowledgment
The authors gratefully acknowledge David Veraart, Carlijn Tijsen-van Helvert and Marije Janssen for their biotechnical assistance.
Funding
This work is supported by the Dutch Technology Foundation STW, with project number [12398], which is (partly) financed by the Netherlands Organisation for Scientific Research (NWO).
Disclosure statement
No potential conflict of interest was reported by the authors.
References
- Böl M, Ehret AE, Leichsenring K, Weichert C, Kruse R. 2014. On the anisotropy of skeletal muscle tissue under compression. Acta Biomater. 10:3225–3234.
- Bosboom EMH, Bouten CVC, Oomens CWJ, Baaijens FPT, Nicolay K. 2003. Quantifying pressure sore-related muscle damage using high-resolution MRI. J Appl Physiol. 95:2235–2240.
- Bosboom EMH, Bouten CVC, Oomens CWJ, Van Straaten HWM, Baaijens FPT, Kuipers H. 2001. Quantification and localisation of damage in rat muscles after controlled loading; a new approach to study the aetiology of pressure sores. Med Eng Phys. 23:195–200.
- Ceelen KK, Stekelenburg A, Loerakker S, Strijkers GJ, Bader DL, Nicolay K, Baaijens FPT, Oomens CWJ. 2008a. Compression-induced damage and internal tissue strains are related. J Biomech. 41:3399–3404.
- Ceelen KK, Stekelenburg A, Mulders JLJ, Strijkers GJ, Baaijens FPT, Nicolay K, Oomens CWJ. 2008b. Validation of a numerical model of skeletal muscle compression with MR tagging: a contribution to pressure ulcer research. J Biomech Eng. 130:061015–1/8.
- Ganpule S, Daphalapurkar NP, Ramesh KT, Knutsen AK, Pham DL, Bayly PV, Prince JL. 2017. A Three-Dimensional Computational Human Head Model That Captures Live Human Brain Dynamics. J Neurotrauma. 34:2154–2166.
- Loerakker S, Bader DL, Baaijens FPT, Oomens CWJ. 2013. Which factors influence the ability of a computational model to predict the in vivo deformation behaviour of skeletal muscle? Comput Methods Biomech Biomed Engin. 16:338–345.
- Loerakker S, Manders E, Strijkers GJ, Nicolay K, Baaijens FPT, Bader DL, Oomens CWJ. 2011. The effects of deformation, ischemia, and reperfusion on the development of muscle damage during prolonged loading. J Appl Physiol. 111:1168–1177.
- Loerakker S, Stekelenburg A, Strijkers GJ, Rijpkema JJM, Baaijens FPT, Bader DL, Nicolay K, Oomens CWJ. 2010. Temporal effects of mechanical loading on deformation-induced damage in skeletal muscle tissue. Ann Biomed Eng. 38:2577–2587.
- Luboz V, Perrier A, Bucki M, Diot B, Cannard F, Vuillerme N, Payan Y. 2015. Influence of the calcaneus shape on the risk of posterior heel ulcer using 3D patient-specific biomechanical modeling. Ann Biomed Eng. 43:325–335.
- Moerman KM. 2018. GIBBON: The Geometry and Image-Based Bioengineering add-On. J Open Source Softw. 3:506.
- Moerman KM, Sprengers AMJ, Nederveen AJ, Simms CK. 2013. A novel MRI compatible soft tissue indentor and fibre Bragg grating force sensor. Med Eng Phys. 35:486–499.
- Moerman KM, van Vijven M, Solis LR, van Haaften EE, Loenen ACY, Mushahwar VK, Oomens CWJ. 2016. On the importance of 3D, geometrically accurate, and subject-specific finite element analysis for evaluation of in-vivo soft tissue loads. Comput Methods Biomech Biomed Engin. 20:483–491.
- Nelissen JL, Graaf L d, Traa WA, Schreurs TJL, Moerman KM, Nederveen AJ, Sinkus R, Oomens CWJ, Nicolay K, Strijkers GJ. 2017. A MRI-compatible combined mechanical loading and MR Elastography setup to study deformation-induced skeletal muscle damage in rats. PLoS One. 12:1–22.
- Nelissen JL, Traa WA, de Boer HH, de Graaf L, Mazzoli V, Savci-Heijink CD, Nicolay K, Froeling M, Bader DL, Nederveen AJ, et al. 2018. An advanced magnetic resonance imaging perspective on the etiology of deep tissue injury. J Appl Physiol. 124:1580–1596.
- NPUAP, EPUAP, PPPIA. 2014. Prevention and treatment of pressure ulcers: clinical practice guideline. Osborn Park, Western Australia: Cambridge media.
- Oomens CWJ, Bader DL, Loerakker S, Baaijens FPT. 2015. Pressure induced deep tissue injury explained. Ann Biomed Eng. 43:297–305.
- Oomens CWJ, Broek M, Hemmes B, Bader DL. 2016. How does lateral tilting affect the internal strains in the sacral region of bed ridden patients? - A contribution to pressure ulcer prevention. Clin Biomech. 35:7–13.
- Oomens CWJ, Zenhorst W, Broek M, Hemmes B, Poeze M, Brink PRG, Bader DL. 2013. A numerical study to analyse the risk for pressure ulcer development on a spine board. Clin Biomech (Bristol, Avon) 28:736–742.
- Sopher R, Nixon J, Gorecki C, Gefen A. 2011. Effects of intramuscular fat infiltration, scarring, and spasticity on the risk for sitting-acquired deep tissue injury in spinal cord injury patients. J Biomech Eng. 133:021011.
- Stekelenburg A, Oomens CWJ, Strijkers GJ, de Graaf L, Bader DL, Nicolay K. 2006. A new MR-compatible loading device to study in vivo muscle damage development in rats due to compressive loading. Med Eng Phys. 28:331–338.
- Van Loocke M, Lyons CG, Simms CK. 2006. A validated model of passive muscle in compression. J Biomech. 39:2999–3009.