
 ?Mathematical formulae have been encoded as MathML and are displayed in this HTML version using MathJax in order to improve their display. Uncheck the box to turn MathJax off. This feature requires Javascript. Click on a formula to zoom.
Abstract
The aerodynamic features associated with the rotation of a cyclist’s legs have long been a research topic for sport scientists and engineers, with studies in recent years shedding new light on the flow structures and drag trends. While the arm-crank rotation cycle of a hand-cyclist bears some resemblance to the leg rotation of a traditional cyclist, the aerodynamics around the athlete are fundamentally different due to the proximity and position of the athlete’s torso with respect to their arms, especially since both arm-cranks move in phase with each other. This research investigates the impact of arm-crank position on the drag acting on a hand-cyclist and is applied to a hill descent position where the athlete is not pedalling. Four primary arm-crank positions, namely 3, 6, 9, and 12 o’clock of a Paralympic hand-cyclist were investigated with CFD for five yaw angles, namely 0°, 5°, 10°, 15°, and 20°. The results demonstrated that the 3 and 12 o’clock positions (when observed from the left side of the hand-cyclist) yielded the highest drag area at 0° yaw, while the 9 o’clock position yielded the lowest drag area for all yaw angles. This is in contrast to the 6 o’clock position traditionally held by hand-cyclists during a descent to reduce aerodynamic drag.
1. Introduction
Recumbent hand-cycling () is a Paralympic sport with four categories, H1–H4 (UCI Citation2017). The athletes power the hand-cycle with their arms, as opposed to legs as in traditional able-bodied cycling. The athlete’s head, torso and legs remain largely static throughout the motion of cycling. The arms rotate a crank, which powers the front wheel via a chain. Little is known regarding the aerodynamics of the arm-crank rotation cycle. Traditionally, hand-cyclists adopt an arm-crank position at its lowest vertical position when descending in a race. If clock time positions are applied to the arm-crank positions, referenced from the left side of the hand-cyclist, this aerodynamic arm-crank position would be at 6 o’clock (). This arm-crank position can be perceived to minimise the projected frontal area of the hand-cyclist, which in turn is associated with reducing aerodynamic drag (Debraux et al. Citation2011). In addition, this 6 o’clock position would be a resting position for the athlete’s arms.
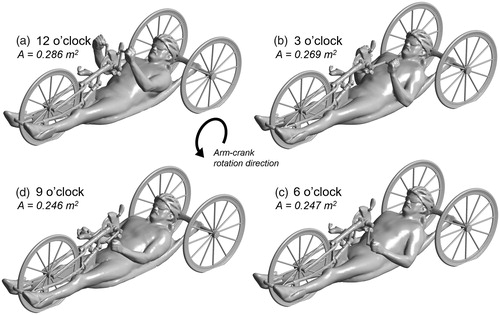
Figure 1. Four arm-crank positions of interest, denoted as (a) 12, (b) 9, (c) 6, and (d) 3 o’clock. The projected frontal areas corresponding to each arm-position are included for comparison.
Positioning is a popular topic in traditional able-bodied cycling where the leg positioning can play an important role in the aerodynamic drag. Wind-tunnel experiments on the leg positions of an able-bodied traditional cyclist have been conducted by Crouch et al. (Citation2014), using a mannequin to ensure precise 15° increments in the leg positioning. It was found that both the wake flow regime and the drag experienced by the cyclist changed significantly throughout the rotation of the legs. A near symmetric wake flow was found for the lowest drag scenario when the pedals were aligned on a near horizontal plane, with a firmly asymmetric flow regime for the highest drag scenario (pedals aligned on a near vertical plane). The drag coefficient was found to vary by up to 15% throughout the leg rotation cycle. Fintelman et al. (Citation2015) used a mannequin to conduct repeatable wind-tunnel experiments and CFD simulations of a traditional able-bodied cyclist in crosswind conditions. Yaw angles from 0° to 90° were investigated in 15° increments. Variations of 9% were found between the experimental and numerical predictions for the drag force, with larger variations of 21% in the lateral force predictions. Crouch et al. (Citation2016) further investigated the relationship between the motion of an athlete’s legs and aerodynamic drag. The wake flow behind both static and pedalling cyclists was analysed and quantified. It was suggested that limited aerodynamic gains would be available by adjusting a cyclist’s cadence through non-uniform, non-circular, or pedal strokes.
Focusing specifically on hand-cyclists, Belloli et al. (Citation2014) conducted wind-tunnel experiments on the 6 o’clock arm-crank position, called the “aerodynamic stage” (Belloli et al. Citation2014), yielding a CDA of 0.20 m2. A dynamic wind-tunnel experiment was also conducted by Belloli et al. (Citation2014), with the athlete rotating the hand-cycle’s crank. Data was sampled at 500 Hz over 20 seconds with an RPM (revolutions per minute) of 70. A slightly higher average CDA of 0.21 m2 was found. Track tests on the London 2012 Brand Hatch circuit by Belloli et al. (Citation2014) provided further evidence for an increased CDA experienced by hand-cyclists during propulsive stages of racing (the athlete provides power by rotating the crank), where a CDA of 0.204 m2 was found for the aerodynamic stage (at a 6 o’clock arm-crank position), and CDA of 0.245 m2 was found for the propulsive-dynamic stage1.1 This 20.1% increase in the CDA from aerodynamic stage to propulsive stage for the outdoor track tests is in contrast to the 5.0% increase found for the same experiment replicated in the wind-tunnel. The outdoor environment could be a large factor contributing to this difference, with the potential for cross-winds and turbulence contributing to an increased drag at different arm-crank positions through the dynamic cycle. In addition, the ratio between cycling speed (wheel rotational velocity) and cadence could be a contributing factor to this difference, where the cycling speed and cadence was held steady in the wind-tunnel experiment, but would vary naturally due to the slopes present on the track tests. Further differences could have been present with the posture or apparel of the athlete between both testing methods.
Further knowledge into the arm-crank position of hand-cyclists could yield novel information to aid with both aerodynamic optimisation (skin-suit development, arm-crank positions for descents, etc.) and further understanding of the aerodynamic characteristics of hand-cyclists. For this purpose, in the present study, CFD simulations validated by wind-tunnel experiments were conducted to provide further insight into the aerodynamics of hand-cyclists’ changing arm-crank positions. A single arm-crank position was analysed using wind-tunnel experiments, and, following the validation study, four arm-crank positions, namely 3, 6, 9, and 12 o’clock () were chosen for analysis using CFD.
2. Validation of CFD simulations with wind-tunnel data
2.1. CFD simulations: settings and parameters
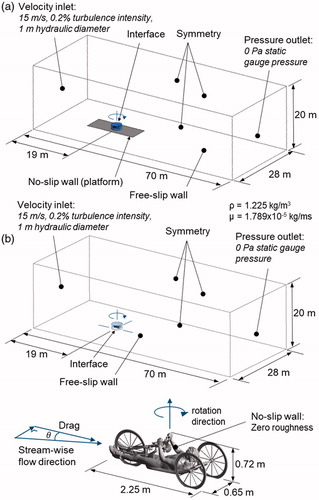
A hand-cyclist was 3D scanned (Artec Europe Citation2017) in the four arm-crank positions to build the corresponding geometries for the CFD simulations. Informed consent was received from the athlete prior to 3D scanning. The size and shape of the computational domain and the boundary conditions are depicted in , and followed recommendations by Franke et al. (Citation2007); Tominaga et al. (Citation2008); and Blocken (2015) to ensure a low blockage ratio. A uniform inlet velocity of 15 m/s was used with 0.2% turbulence intensity and a 1 m hydraulic diameter. A free-slip wall boundary condition was applied to the lower horizontal surface of the computational domain to prevent boundary layer development upstream of the test geometry, and symmetry condition was applied to both sides and the top surfaces. Zero static gauge pressure was imposed at the outlet. The hand-cyclist surface was modelled as a smooth no-slip wall with zero roughness. Two domain variations were used. The first contained the platform geometry and hand-cyclist support structures from the wind tunnel experiments (). The validation simulations that utilised this domain were compared directly to the wind tunnel experiments in Section 2.2. The second domain () did not contain the platform surface and support structures, and was used for the full-scale simulations discussed in Section 3.
Figure 2. The computational domain dimensions, boundary conditions and general dimensions of the hand-cyclist geometry (full-scale) with (a) the platform and hand-cycle support structures for comparison to the wind tunnel experiments, and (b) without the platform and support structures. ρ is density and μ is viscosity.
The 3 D RANS equations were solved, in line with previous CFD studies in cycling aerodynamics (Blocken Citation2014; Crouch et al. Citation2017), using ANSYS Fluent 16 (ANSYS Fluent Citation2015) and the SST k–ω (Menter Citation1994) turbulence model for closure, which has also been found to be suitable for solo cycling (Defraeye et al. Citation2010) and tandem cycling (Mannion et al. Citation2018a, Citation2018b) aerodynamics. Gradients were computed using the Least Squares Cell Based method (ANSYS Fluent Citation2015), and the Coupled algorithm was used for pressure–velocity coupling, with the use of the pseudo-transient implicit under-relaxation method; a pseudo time-step size of 0.01 s used, and drag values were averaged over 4000 pseudo-time steps. Second order pressure interpolation and second order discretisation schemes for momentum, turbulent kinetic energy, and dissipation rate were used.
A grid convergence study was conducted based on three systematically refined tetrahedral grids (coarse, medium, fine). The cell counts for the coarse, medium and fine grids were 10.4, 27.2, and 77.4 million cells, respectively. The Grid Convergence Index (GCI) suggested by Roache (Citation1994, Citation1997) was calculated for the grids. GCI values of 0.3% and 1.3% were obtained for the fine grid and medium grids respectively.
A second grid independence study was conducted to determine the aerodynamic drag sensitivity to y* resolution. y* is defined in EquationEquation 1(1)
(1) . Three prismatic-tetrahedral grids were created with average y* values of 0.8, 11, and 43. Deviations of 1.4%, 3.5%, and 7.7% in drag were obtained between the CFD results on these grids and the wind-tunnel experiment, indicating that a y* resolution of 1 or less was required for these hand-cycling simulations. This is in agreement with the findings by Mannion et al. (Citation2018a), who determined that similar grid requirements were required for tandem para-cycling aerodynamics simulation. The formulation for y* is used opposed to y+, due to the advantages of y* for cycling aerodynamics applications as discussed by Blocken and Toparlar (Citation2015).
(1)
(1)
where
is the friction velocity [m/s],
is the kinematic viscosity [m2/s], and
is the normal distance from the wall to the centre point P of the first wall-adjacent cell [m].
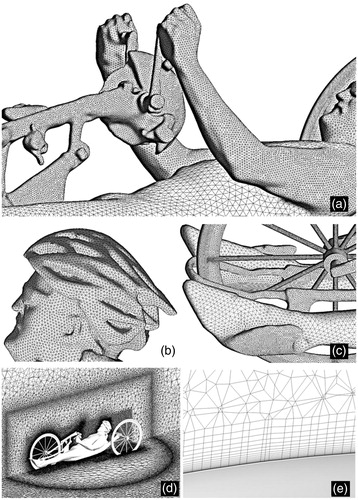
A final grid was created with 25.7 million cells that balanced the computational effort and accuracy of the medium and coarse grids and attained an average y* of 0.8. Twenty boundary layers were imposed on the hand-cycle geometry in the tetrahedral-prismatic grid with a first layer cell height of 25 μm and a growth ratio of 1.2, yielding a max y* value of 2.9, to resolve the thin laminar sublayer at the surface. The surface grid is illustrated in for a 12 o’clock arm-crank position, with a focus on the arms (), the helmet () and the front wheel surface grids (). To provide an accurate comparison to the wind-tunnel experiments, the support structures attached to the wheels (required for the wind-tunnel experiments) and the plate attached to the scaled model were included in the CFD simulations performed for validation purposes only (Section 2.2). These support structures were not included in the simulations discussed in the results in Section 3. A no-slip wall boundary condition was applied to the support structures and plate attached to the hand-cyclist geometry, which were considered smooth with zero roughness. All drag measurements were defined in the axis of the hand-cycle () as per the wind-tunnel experiments and not with the stream-wise flow direction, where the force transducer was rotated with the hand-cycle geometry for each yaw angle.
Figure 3. Illustration of the surface grid on (a) the athlete’s arms (12 o’clock position), (b) head and helmet, (c) the front wheel (without support structures), and (d) The volume grid in vertical and horizontal planes, and (e) the prismatic boundary layer grid. Total number of cells was 28,940,036.
2.2. Wind-tunnel experiments and comparison with CFD results
Wind-tunnel experiments were conducted in the closed-loop aeronautical test section of the wind-tunnel laboratory in the University of Liège for yaw angles ranging between 0° and 20° in 5° increments so that the influence of crosswinds could be investigated. The quarter-scale model manufactured based on the 3D scan (with arm-crank position at 6 o’clock) was subjected to a wind-tunnel velocity of 60 m/s to provide Reynolds number similarity to the full-scale geometry at 15 m/s in the CFD simulations. The reduced scale model was manufactured from ABS (acrylonitrile butadiene styrene) via CNC (computer numerical control) milling. The physical model was an exact 1:4 scale replica of the digital model and the resulting surface was considered smooth.
A single force transducer was positioned in vertical alignment with the hand-cycle model’s centre of gravity for force measurements (). A rectangular baseplate (0.56 × 0.16 m) below the hand-cycle geometry acted as the connecting geometry to which the force transducer was attached. The location of the vertical axis of the transducer with respect to the baseplate was 0.285 m from its leading edge and centred laterally. The force transducer used was a six-axis Delta model (ATI Industrial Automation Citation2018). The force transducer was calibrated prior to testing and had a linear response. In addition, the transducer was certified as compliant with the ISO 9001 standard to ensure performance within stated specifications. The transducer was zeroed in the wind-tunnel setup prior to imparting any wind load, and a settling time of 30 s was also provided at full wind load before force measurements were recorded (at 10 Hz for 180 s). The manufacturers of the force transducers reported a conservative maximum error estimate of 1.24 N at a 95% confidence interval, including both random and systematic errors. Additional corrections (via temperature measurements and accounting for atmospheric pressure) were made to the drag measurements to account for the difference in air density between the wind-tunnel experiments and the air density (1.225 kg/m3) used in the CFD simulations. The turbulence intensity of the flow in the wind-tunnel was below 0.2% (Blocken, Toparlar, and Andrianne Citation2016).
Figure 4. (a) Schematic of wind-tunnel experiment. (b) Photo of the test geometry in the wind-tunnel. (c) Comparison of wind-tunnel and CFD drag predictions, at crosswinds ranging from 0° to 20° in 5° increments, for a hand-cyclist with arm-crank position at 6 o’clock. The error margin of the wind-tunnel measurements (±1.24 N) is indicated with the red error bars.
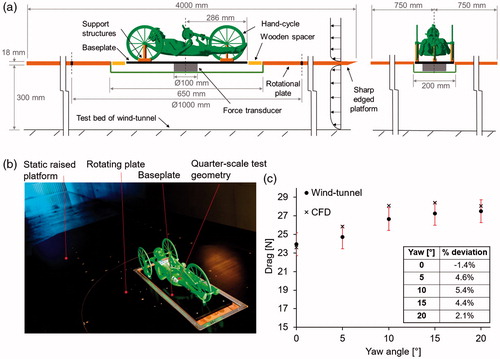
The quarter-scale hand-cycle model was mounted on a sharp edged horizontal platform, which was elevated 0.3 m from the bottom surface of the wind-tunnel test chamber for the purpose of removing the model from the boundary layer at the bed of the wind-tunnel and reducing the approach-flow boundary layer height. The platform below the hand-cyclist model was static and its surface was smooth. The approach-flow mean velocity profile above the elevated platform was measured, which revealed a boundary layer of 60 mm above which the profile was constant. The turbulence intensity in the free-stream air was 0.2%. A circular plate was built into the platform flush with the top and bottom surfaces to allow the model to be rotated for crosswind experiments (). A blockage ratio of 1.8% was calculated for the 2 × 1.5 m2 test chamber at 0°, and 2.3% at 20°. Although the blockage remained relatively low (< 3%), 3D solid blockage corrections from Barlow et al. (Citation1999) were applied to the measured velocity which are applicable for blockage ratios between 1% and 10%.
For the yaw angles between 0° and 20°, an average deviation in drag force of 3.6% and a maximum deviation of 5.4% (at 10° yaw) was found between the CFD simulation results and wind-tunnel experiments. compares the CFD and wind-tunnel results along with the absolute percentage deviation. The CFD drag forces were within the ±1.24 N error range of the force transducers in the wind-tunnel experiment except for 10° yaw, and were considered validated to continue the study with CFD. The Root-Mean-Error (RMS) was used as a statistical indicator to evaluate the differences between the wind-tunnel and CFD drag predictions. The following equation was used to calculate the RMS error:
(2)
(2)
where
is the force prediction from the simulations,
is the force measured from the experiments, and x is the number of yaw angles. An RMS error of 1.0 N was calculated for the CFD drag predictions for the five yaw angles. This indicates the spread of the CFD drag predictions from the experimental data, at an acceptable 4.2% deviation if referenced from the experimental drag at 0° yaw, or 3.6% if referenced from 20° yaw. A trend was found for yaw angles of 5°–20° where the CFD consistently over-predicted the drag force. At 0° the drag was under-predicted by 1.4%.
3. Results
The target parameters were the drag area [m2] and the pressure coefficient [−] defined as:
(3)
(3)
where is the drag force [N],
the air density [kg/m3], V the freestream velocity [m/s], A the frontal area [m2], and
the difference in local surface pressure with respect to the ambient static pressure [Pa]. The values of A are given in . All drag predictions were relative to the drag axis of the hand-cycle, and thus, the frontal area remains constant throughout yaw calculations for CDA predictions. The frontal area was acquired from the numerical surface grid of the 3 D geometry within the CFD software ANSYS Fluent, to a minimum feature size resolution of 0.00001 m.
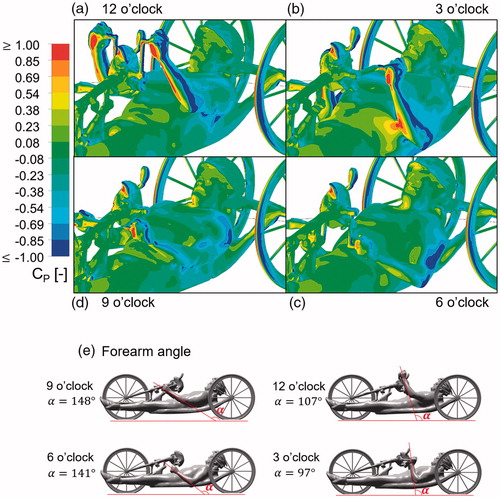
Four arm-crank positions, namely 3, 6, 9, and 12 o’clock, were analysed using CFD. The support structures required for the wind-tunnel experiments were removed from the computational geometries to provide results more representative of actual hand-cycling aerodynamics. All arm-crank positions followed similar drag area trends throughout the range of yaw angles, with increasing drag between 0° and 15° yaw, and decreasing drag between 15° and 20° yaw (). The 9 o’clock position provided the lowest frontal area () and also the lowest drag for all yaw angles with a CDA range of 0.155 m2–0.177 m2, () and is thus recommended over the other three positions tested during hill descents, to yield the largest aerodynamic advantage. In this position, the forearms were inclined with respect to the oncoming flow at an angle 148° relative to the horizontal axis () while the upper-arms (biceps–triceps) were almost parallel to the ground surface. illustrates the differences in pressure on the athlete’s arms as a result of their orientation. The aerodynamically worst arm-crank positions at 0° yaw were the 3 and 12 o’clock positions, with matching CDA’s of 0.173 m2. This was despite the fact that the 3 o’clock position featured a reduced frontal area (0.017 m2 lower) when compared to the 12 o’clock position (). The cause of the drag for the 3 o’clock position was the drag interference between the arms and torso (), where high pressure regions were found on the torso in close proximity to the arms. Similarly to the 12 o’clock position (
107°), a large pressure gradient was found over the forearms in the 3 o’clock position (
97°) in comparison to 6 (
141°) and 9 o’clock (
148°) due to their angle
to the horizontal axis (). The forearms of the 12 and 3 o’clock arm-crank positions were increasingly normal to the horizontal axis in comparison to the 6 and 9 o’clock arm-crank positions.
Figure 5. Drag area versus yaw angle for each arm-crank position tested.
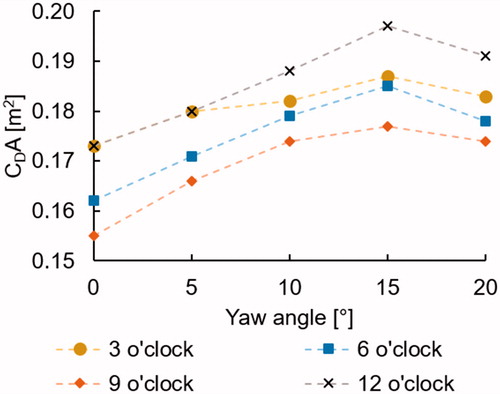
Figure 6. Pressure coefficient contours for 0° yaw for: (a) 12, (b) 3, (c) 6, (d) 9 o’clock arm crank positions, and (e) the angle denote the clockwise angle between the forearm and the ground surface.
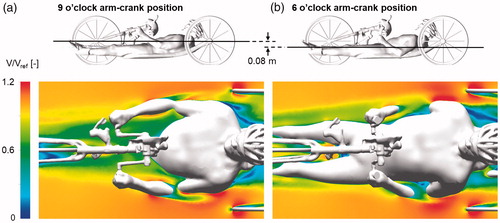
Normalised mean velocity contours in a horizontal plane that intersects with the upper arm (bicep–tricep) of the athlete illustrate the interaction of the flow from the forearms to the upper arms, and how it impacted flow separation from the arms of the athlete (). suggests that flow separation occurred close to the shoulder when the athlete adopts a 9 o’clock position. A steeper angle of the upper arm relative to the horizontal ground plane is present when a 6 o’clock arm-crank position is adopted, resulting in flow separating along the length of the upper arm geometry. illustrates the resulting mean velocity fields around the upper arms for the 6 o’clock arm-crank position, showing the direction of the wake flow from the forearms that interacted with the upper arms. While the aerodynamic interaction between the forearms and the upper arms plays a role in the locations of flow separation, the orientation of the arms themselves plays a larger role. When the forearms or upper arms were close to a horizontal position, the flow remained attached along a larger part of the length of the arm. However, if the forearms or upper arms deviate more from a horizontal position, they present a shape similar to a tilted cylinder against the oncoming air, promoting flow separation around the surface of the arms.
Figure 7. Normalised velocity contours in a horizontal plane for (a) the 9 o’clock and (b) the 6 o’clock arm-crank positions, at 0° yaw.
4. Discussion
The 6 o’clock arm-crank position is the commonly adopted arm-crank position for hand-cyclists during hill descents to maximise their aerodynamic efficiency. Results from this study however demonstrated that the 9 o’clock arm-crank position has a lower drag area than the 6 o’clock position for all yaw angles tested. However, an advantage of the 6 o’clock position is that it may provide respite to the athlete, while the 9 o’clock position might require additional effort to hold. Further research is recommended to quantify the trade-off between energy consumption and aerodynamics for hand-cyclists between holding the 6 o’ and 9 o’clock arm-crank positions.
It is possible to convert the drag area differences to potential seconds saved in the descent phases (without any athlete power output) of race events (), where adopting the 9 o’clock arm-crank position instead of the 6 o’clock position could prove beneficial. By making a comparison over a descent of 500 m assuming a constant 0° yaw and a 15 m/s reference velocity, adopting the 9 o’clock position instead of the 6 o’clock position could save 0.8 s. On the other hand, compared to the 6 o’clock position, adopting the 12 o’clock and 3 o’clock positions would result in an additional 1.1 s for both positions respectively. The 9 o’clock arm-crank position offers a minimum saving of 0.3 s at 20° and a max of 0.8 s at 0° yaw over the 6 o’clock arm-crank position for a 500 m distance, assuming a reference velocity of 15 m/s for the 6 o’clock position at each yaw angle. The seconds saved or lost that are presented in for each arm-crank position assume that the yaw angle is held constant for the 500 m descent. In reality, the land topography and twisting track routes result in a range of yaw angles being experienced over a single descent, particularly longer descents such as 2 km distance. However, if the assumption were made that there were no wind conditions over a 2 km descent where a hand-cyclist would constantly be at 0° yaw, the 9 o’clock arm-crank position would save up to 3.1 s over the 6 o’clock position. These comparisons assume that the athletes are not providing propulsive power during these stages, but remain static in their aerodynamic positions.
Table 1. A comparison of time saved (+) or lost (−) against the 6 o’clock arm-crank position at a reference velocity of 15 m/s, for each yaw angle tested over a 500 m distance.
There are several simplifications associated with the present study. Firstly, only static geometries were considered in the wind-tunnel experiments and CFD simulations. In reality, the wheels are rotating along with the athlete’s arms as they rotate the crank about its 360° cycle. Secondly, all surfaces on the hand-cycle model were modelled as smooth walls with zero roughness. The surface of the athlete varies in reality, due to skin, hair and the skinsuit. Furthermore, the anthropometry of individual athletes may play a role in the aerodynamics of different arm-crank positions, and this research is limited to a singular athlete.
The numerical simulations were observed to overestimate the drag of the hand-cyclist between 5° and 20° yaw. This was primarily attributed to the turbulence modelling within RANS simulations. The SST k–ω (Menter Citation1994) turbulence model was used for this research, as it has been found to provide reasonable aerodynamic force predictions in other cycling applications (Defraeye Citation2010; Mannion et al. Citation2018a, Citation2018b). Mannion et al. (Citation2018c) showed that the Spalart–Allmaras (Spalart and Allmaras Citation1992) turbulence model underestimated the drag of a hand-cyclist in yaw conditions by comparison to the SST k–ω. Nevertheless, RANS simulations are inherently limited as they only solve the turbulence statistics.
In reality, the air velocity experienced by a hand-cyclist is a combination of the wind speed (head wind, tail wind, or cross wind) and the travelling speed of the hand-cycle. The boundary layer on the raised platform was not representative of a boundary layer experienced by a hand-cyclist in real-word cycling conditions. In reality, the boundary layer on the ground in the approach flow only pertains to the wind speed, not the travelling speed. In the wind tunnel however, the boundary layer on the platform pertains to the combination of wind speed and travelling speed. Although the boundary layer height is only 60 mm, this will cause some differences with reality. Note that the validation process for the numerical simulations accounted for the boundary layer on the platform by including the geometry of the upper-surface of the platform in the simulations as a no-slip wall ().
Belloli et al. (Citation2014) performed wind-tunnel experiments on “arm powered” (H1–H4 category (UCI Citation2017)) and “arm-trunk powered” (H5 category (UCI Citation2017)) hand-cyclists in “aerodynamic” positions and “propulsive” phases (Belloli et al. Citation2014); the aerodynamic position featured a 6 o’clock arm-crank position for the arm powered H1–H4 category hand-cyclist, and the propulsive phase featured the hand-cyclists rotating the cranks. An increase in recorded CDA values (5%) was reported for the H1–H4 category hand-cyclist for the propulsive phase against the aerodynamic position tested at 0° yaw. A coarse comparison can be made between the wind-tunnel experiments by Belloli et al. (Citation2014) and the results from this study by averaging the drag found for the four arm-crank positions tested at 0° yaw and comparing to the percentage increase found for the propulsive stage by Belloli et al. (Citation2014). A 2.3% increase was found from the 6 o’clock arm-crank position at 0° yaw to the averaged drag of the four arm-crank positions. In reality, dynamic simulations are required to make a full comparison, with the same ratio of cycling cadence to riding velocity. This is recommended for future research, along with variations to this ratio to determine if it contains a relationship to the aerodynamic drag of the hand-cyclist.
Further research should include additional arm-crank positions for analysis with 15° differences between the positions tested in the 360° arm-crank cycle suggested. Fully dynamic studies of the arm-crank rotation with a temporal resolution small enough to acquire meaningful drag data over the crank-arm rotation cycle would provide further information. Wind-tunnel experiments are ideally suited for this research as they allow for actual athletes to be tested dynamically with no geometric simplifications that are associated with computational research. However, fully dynamic CFD simulations would provide a wealth of flow-field data for the aerodynamics of an arm-crank rotation cycle. Further research could also be conducted on the H5 category (upright) hand-cycle to determine if the aerodynamics of the arm-crank rotation cycle follows a similar, or its own unique trend.
Improving the aerodynamics of the 3 and 12 o’clock arm-crank position could yield net drag savings when the athlete is hand-cycling. A custom designed skinsuit with sleeves that delay flow separation on the athlete’s forearms for these arm-crank positions could reduce the net drag of the hand-cyclist. Juhl (Citation2013) showed that the rotational velocity of a hand-cyclist arm-crank reaches its peak between the 3 and 12 o’clock positions, providing further indication that aerodynamic optimisation research for these positions might yield drag savings for the hand-cyclist. In addition, the application of a non-circular chain-ring could have potential aerodynamic benefits for the arm-crank cycle of a hand-cyclist. Juhl (Citation2013) discussed the application of an oval shaped chain ring opposed to a traditional circular ring to improve hand-cyclists race performance by measuring athlete oxygen uptake, however, the aerodynamic implications of a non-concentric shaped chain-ring have not been explored.
5. Conclusion
This study utilised CFD simulations validated with wind-tunnel experiments to investigate the aerodynamics of four arm-crank positions at yaw angles in 5° increments between 0° and 20°. A good agreement was found between the CFD simulations and the wind-tunnel experiments for the validation of the 6 o’clock arm-crank position, with a maximum deviation of 5.4% at 10° yaw. Contrary to the common practice among hand-cyclists who maintain a 6 o’clock arm-crank position during descent stages of races, the 9 o’clock arm-crank position was found to have the lowest CDA (m2) value throughout all the yaw angles tested. Therefore the 9 o’clock arm-crank position can be recommended for hand-cycling races due to its superior aerodynamic performance. Time savings of up to 0.8 s might be possible over a 500 m descent by adopting the 9 o’clock arm-crank position over the 6 o’clock arm-crank position, with a minimum CDA of 0.155 m2 found at 0° yaw, and a max of 0.177 m2 at a yaw angle of 15° found for the 9 o’clock position. The 12 o’clock arm-crank position was found to experience the largest drag force recorded, with a max CDA of 0.197 m2 at 15° yaw. An additional impact to hand-cycling aerodynamics could be made through the optimisation of the arm-crank rotation cycle via a non-concentric chain-ring, and specialised skin-suit designs focused on the 3 o’ and 12 o’clock arm-crank positions.
Acknowledgements
The authors acknowledge the support of the College of Engineering and Informatics at the National University of Ireland, Galway. The authors acknowledge the collaboration with Paralympics Ireland, Cycling Ireland and the Sport Ireland Institute, along with the technical support team of the Department of the Built Environment at Eindhoven University of Technology. The authors acknowledge the SFI/HEA Irish Centre for High-End Computing (ICHEC) for the provision of computational facilities and support, and also acknowledge the partnership with ANSYS CFD.
Disclosure statement
No potential conflict of interest was reported by the author(s).
Notes
1 CDA reported by Belloli et al. (Citation2014) were to two significant figures for the wind tunnel experiments and to three significant figures for the track tests.
Related Research Data
References
- ANSYS Fluent. 2015. ANSYS fluent theory guide. Release 16.1 documentation. Canonsburg, Pennsylvania: ANSYS Inc.
- Artec Europe. 2017. Artec Eva, 3D scanners. Luxembourg: Artec Europe. [accessed 2017 May 22]. https://www.artec3d.com/3d-scanner/artec-eva
- ATI Industrial Automation. 2018. F/T sensor delta. NC, USA: ATI Industrial Automation. [accessed 2018 April 04]. https://www.ati-ia.com/app_content/Documents/9230-05-1330.auto.pdf
- Barlow JB, Rae WH, & Pope A. 1999. Low-speed Wind Tunnel Testing (3rd ed.). John Wiley & Sons.
- Belloli M, Cheli F, Bayati I, Giappino S, Robustelli F. 2014. Handbike aerodynamics: wind tunnel versus track tests. In: The 2014 Conference of the International Sports Engineering Association, Procedia Eng (vol. 72, pp.750–755). Sheffield Hallam University, United Kingdom: Elsevier B.V. doi:10.1016/j.proeng.2014.06.127
- Blocken B. 2014. 50 years of computational wind engineering: past, present and future. J Wind Eng Industr Aerodyn. 129:69–102. doi:10.1016/j.jweia.2014.03.008
- Blocken B. 2015. Computational fluid dynamics for urban physics: importance, scales, possibilities, limitations and ten tips and tricks towards accurate and reliable simulations. Built Environment. 91:219–245. doi:10.1016/j.buildenv.2015.02.015
- Blocken B, Toparlar Y. 2015. A following car influences cyclist drag: CFD simulations and wind tunnel measurements. J Wind Eng Industr Aerodyn. 145:178–186. doi:10.1016/j.jweia.2015.06.015
- Blocken B, Toparlar Y, Andrianne T. 2016. Aerodynamic benefit for a cyclist by a following motorcycle. J Wind Eng Industr Aerodyn. 155:1–10. doi:10.1016/j.jweia.2016.04.008
- Crouch TN, Burton D, Brown NAT, Thompson MC, Sheridan J. 2014. Flow topology in the wake of a cyclist and its effect on aerodynamic drag. J Fluid Mech. 748:5–35. doi:10.1017/jfm.2013.678
- Crouch TN, Burton D, LaBry ZA, Blair KB. 2017. Riding against the wind: a review of competition cycling aerodynamics. Sports Eng. 20(2):81–110. doi:10.1007/s12283-017-0234-1
- Crouch TN, Burton D, Thompson MC, Brown NAT, Sheridan J. 2016. Dynamic leg-motion and its effect on the aerodynamic performance of cyclists. J Fluids Struct. 65:121–137. doi:10.1016/j.jfluidstructs.2016.05.007
- Debraux P, Grappe F, Manolova AV, Bertucci W. 2011. Aerodynamic drag in cycling: methods of assessment. Sports Biomech. 10(3):197–218. doi:10.1080/14763141.2011.592209
- Defraeye T, Blocken B, Koninckx E, Hespel P, Carmeliet J. 2010. Computational fluid dynamics analysis of cyclist aerodynamics: performance of different turbulence-modelling and boundary-layer modelling approaches. J Biomech. 43(12):2281–2287. doi:10.1016/j.jbiomech.2010.04.038
- Fintelman DM, Hemida H, Sterling M, Li F-X. 2015. CFD simulations of the flow around a cyclist subjected to crosswinds. J Wind Eng Industr Aerodyn. 144:31–41. doi:10.1016/j.jweia.2015.05.009
- Franke J, Hellsten A, Schlünzen H, Carissimo B. 2007. Best practice guideline for the CFD simulation of flows in the urban environment. COST action 732: quality assurance and improvement of microscale meteorological models. Hamburg, Germany: COST Office Brussels.
- Juhl J. 2013. Non-circular chainring optimization for handcycling. J Loremipsum. 1:1–8. doi:00.0000/j.jbiomech.2013.08.012
- Mannion P, Toparlar Y, Blocken B, Hajdukiewicz M, Andrianne T, Clifford E. 2018a. Improving CFD prediction of drag on paralympic tandem athletes: influence of grid resolution and turbulence model. Sports Eng. 21(2):123–135. doi:10.1007/s12283-017-0258-6
- Mannion P, Toparlar Y, Blocken B, Clifford E, Andrianne T, Hajdukiewicz M. 2018b. Aerodynamic drag in competitive tandem para-cycling: road race versus time-trial positions. J Wind Eng Industr Aerodyn. 179:92–101. doi:10.1016/j.jweia.2018.05.011
- Mannion P, Toparlar Y, Blocken B, Clifford E, Andrianne T, Hajdukiewicz M. 2018c. Analysis of crosswind aerodynamics for competitive hand-cycling. J Wind Eng Industr Aerodyn. 180:182–190. (August), doi:10.1016/j.jweia.2018.08.002
- Menter FR. 1994. Two-equation eddy-viscosity turbulence models for engineering applications. AIAA J. 32(8):1598–1605. doi:10.2514/3.12149
- Roache PJ. 1994. Perspective: a method for uniform reporting of grid refinement studies. J Fluids Eng. 116(3):405–413.
- Roache PJ. 1997. Quantification of uncertainty in computational fluid dynamics. Annu Rev Fluid Mech. 29(1):123–160. doi:10.1146/annurev.fluid.29.1.123
- Tominaga Y, Mochida A, Yoshie R, Kataoka H, Nozu T, Yoshikawa M, Shirasawa T. 2008. AIJ guidelines for practical applications of CFD to pedestrian wind environment around buildings. J Wind Eng Industr Aerodyn. 96(10–11):1749–1761. doi:10.1016/j.jweia.2008.02.058
- Spalart P, Allmaras S. 1992. A one-equation turbulence model for aerodynamic flows. In 30th aerospace sciences meeting and exhibit. Reno, Nevada: American Institute of Aeronautics and Astronautics. doi: 10.2514/6.1992-439
- UCI. 2017. Cycling regulations, part 16 para-cycling, version on 01/02/2017. Aigle, Switzerland: Union Cycliste Internationale. http://www.uci.ch/mm/Document/News/Rulesandregulation/16/26/73/16-PAR-20170201-E_English.PDF