
 ?Mathematical formulae have been encoded as MathML and are displayed in this HTML version using MathJax in order to improve their display. Uncheck the box to turn MathJax off. This feature requires Javascript. Click on a formula to zoom.
1. Introduction
The mechanical phenomena which occur in the subarachnoid space have been studied either from a structural point of view particularly focusing on the spinal cord (SC) or from a fluid point of view focusing on the cerebrospinal fluid (CSF) flow.
Fluid-structure interaction (FSI) approaches provide new perspectives to numerically describe the physiological phenomenon. It has been showed that the CSF acts in a passively way on the central nervous system as shock absorber in compressive spinal cord injuries (Fradet et al. Citation2016). However, we are not aware of any study that provide stress values induced by the active physiological role of the pulsatile CSF flow profile on the spinal cord in 3D.
The purpose of this study is to quantify the maximum Von Mises stress generated in the spinal cord induced by an healthy pulsatile flow profile of the CSF.
2. Methods
2.1. FSI model: Geometry and material properties
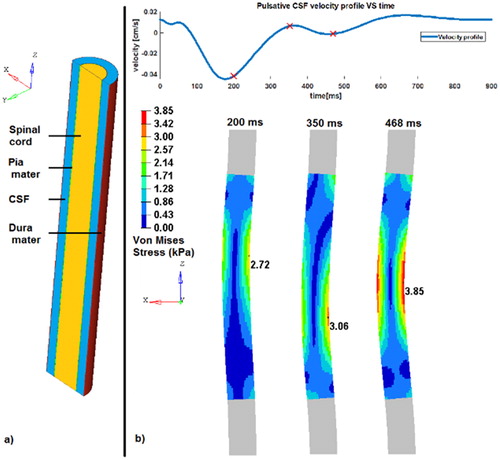
The geometries and the meshes of the 3D model were done on the pre-processing software HyperMesh® (Altair Engineering, 1985). The spinal cord was considered as a cylinder surrounded by a layer representing the pia mater (diameter: 12 mm). The dura mater was designed as a cylinder and considered as the external layer of the subarachnoid space (diameter: 20 mm). The CSF fills the space between the dura and the pia mater with 1 mm offset between each of them. All components have a length of 140 mm (corresponding to the cervical spinal cord length) ().
Figure 1. a) the different model parts (left). b) Von Mises stress (MPa) generated by the CSF flow (top) on the spinal cord at 3 different times (red markers on the velocity profile) corresponding to local maximum. The magnitude of the displacement is exaggerated by a factor 4 for visualization (right).
The material properties of these structures were chosen as linear elastic (). The CSF was described with the same properties than water by an hydrodynamical viscous fluid law () following the Euler equations: conservation laws of mass Equation(1)(1)
(1) , momentum Equation(2)
(2)
(2) and energy Equation(3)
(3)
(3) :
(1)
(1)
(2)
(2)
(3)
(3)
with
the density, V the velocity, p the pressure, g the gravity force, E the total energy.
Table 1. Structure and fluid material properties.
The fluid stress tensor is described as:
(4)
(4)
with p the pressure,
the isotropic second order tensor,
the kinematic viscosity.
The fluid pressure is defined as the following state law:
(5)
(5)
with
the initial density,
the current density,
are the strain rate coefficients.
Pia and dura mater were meshed with 4-nodes quad shell elements (QPS), with one-point quadrature integration. The SC was meshed with brick (HA8) standard 8-nodes elements, 2x2x2 integration points representing each corner of the hexahedral element, no hourglass. The CSF fluid grid was meshed with brick (HA8) elements with ALE formulation (Donea et al. Citation2004). Two interfaces Type 1 (structure elements interact with ALE fluid elements) allows to simulate the transfers of forces and displacements between the structure and fluid elements. The total number of elements is 211,120.
2.2. Boundaries conditions
For the structural nodes and the fluid nodes (ALE grid), in longitudinal direction the upper and lower layers of nodes were constrained in the 3 translational degree of freedom and in the 3 rotations.
Full slip conditions are applied at the boundary between the two domains. The mean velocity profiles of healthy young male group in the cervical spinal canal (max velocity: −4.4 cm/s – cranio-caudal direction) (Daners et al. Citation2012) was imposed as inlet condition. Pressure was let free for the outlet condition.
The numerical simulation was performed on the explicit solver Radioss® (Altair Engineering, 1985) for one cardiac cycle duration (900 ms).
The computational time was 6 days and was performed on a Dell computer (20x Intel Xeon E5-2640v4 CPUs at 2.4 GHz). The elements corresponding to the first and last 30 mm of the spinal cord were not considered to not take into account the edge effects for the post-processing.
3. Results and discussion
The velocity profile has three maximum peak of −4.4 cm/s, 0.7 cm/s and 1.65 cm/s corresponding respectively to the times 173 ms, 366 ms and 670 ms. The negative sign represents the cranio-caudal orientation.
Three main increasing local maximum peaks of Von Mises stresses can be noticed during the simulation. They reached 2.7, 3.1 and 3.8 kPa respectively at the time steps 200, 350 and 468 ms (). The first peak stress value logically corresponds to the first velocity peak profile with a phase shift of + 27 ms. The second stress peak appears during a change direction and an increasing velocity in the caudo-cranial direction (from −4.4 cm/s to 0.7 cm/s). The last peak stress appears during the last phase of increasing velocity (from 0 cm/s to 1.65 cm/s), 132 ms before the last peak of velocity (). The first shift seems induced by the edge effect and the initial condition effect due to the short simulation duration (one cardiac cycle).
Figure 2. Von Mises stresses of the spinal cord over time (blue).
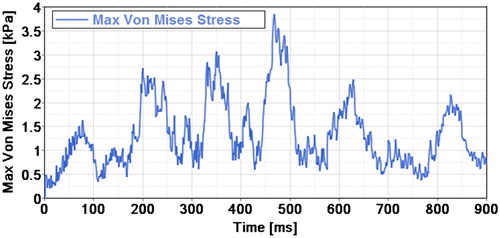
The maximum Von Mises value (3.8 kPa) are respectively 5, 33 and 86 times less than the ones in a contusion, a distraction and a dislocation at the C4/C5 functional unit (Khuyagbaatar et al. Citation2016).
The limitations are the following: the initial effects will be limited in taking into account in modeling the flow for several cardiac cycles, insuring a sufficient number however this FSI approach has a high computational cost (900 ms modelled for a 6-days simulation). Then, a longer tube will be modeled in order to limit the impact of edge effects on the CSF flow modeling, increasing also the computational time. A more representative geometry will be modeled thanks to a current morphometric study of the subarachnoid space. Inlet boundary condition could then be defined from a 2D-phase contrast MRI flow acquisition in order to be subject-specific.
4. Conclusion
A FSI model of the cerebrospinal flow and a simplified central nervous system was built to quantify the stresses generated by the physiological flow on the spinal cord. This simulation provides new data on the feasibility of this multi-physics approach and its interest to better understand physiological and biomechanical phenomenon into the central nervous system. To go further, a clinical application will be to model stenose in order to analyze the fluid flow changes and its impact on the spinal cord stresses and strains.
References
- Daners MS, Knobloch V, Soellinger M, Boesiger P, Seifert B, Guzzella L, Kurtcuoglu V. 2012. Age-specific characteristics and coupling of cerebral arterial inflow and cerebrospinal fluid dynamics. PLoS One. 7:1932–6203.
- Donea J, Huerta A, Ponthot J-P, Rodríguez Ferran A. 2004. Arbitrary Lagrangian–Eulerian methods. In: Encyclopedia of computational mechanics. Wiley.
- Fradet L, Arnoux P-J, Callot V, Petit Y. 2016. Geometrical variations in white and gray matter affect the biomechanics of spinal cord injuries more than the arachnoid space. Adv Mech Eng. 8(8):168781401666470–168781401668140.
- Khuyagbaatar B, Kim K, Man Park W, Hyuk Kim Y. 2016. Biomechanical behaviors in three types of spinal cord injury mechanisms. J Biomech Eng. 138: 81003–81007.