
1. Introduction
Experimental data enabling to validate musculoskeletal models are essential to ensure a physiological behaviour with an accurate prediction of muscle parameters like muscle trajectory. Some musculoskeletal models including shoulder muscles are validated by comparison to experimental results previously published (Sano et al. Citation2006) but in general validation is lacking (Zheng et al. Citation2017).
For ex vivo measurement-based studies, it is straight-forward to validate the models against specimen-based experimental data (Adams et al. Citation2007). However, since experiments are conducted ex vivo rather than in vivo, it cannot be used to assess the physiological behaviour of the muscle. On the other hand, in vivo validation is challenging due to the limitation of current measuring techniques. Especially when it comes to validate model including muscle activation, some data of external deformation and internal architectural changes are needed.
Architectural parameters, like muscle fibre pennation angle and muscle geometry, change markedly with contraction (Hodges et al. Citation2003). These changes should be quantified to validate musculoskeletal models integrating muscle activation. Ultra-sonography may be used as a non-invasive method to measure the changes in pennation angle during isometric contractions (Zhou et al. Citation2012). Concerning the change in external muscle geometry, it could be access using a structure sensor.
Our aim was to provide data for future shoulder model validation. We studied here muscle external deformation and pennation angles at different levels of maximum isometric contraction for the biceps, triceps and deltoid.
2. Methods
2.1. Testing
Participants (group 1: 8 males, 6 females, 25.2 ± 4.4 years old, 175 ± 8 cm, 70 ± 12 kg; group 2: 5 males, 7 females, 27.1 ± 3.5 years old, 174 ± 9 cm, 69 ± 12 kg) were installed on A CON-TREX®MJ isokinetic dynamometer (Physiomed, Schnaittach, Germany) set in isometric mode. First, we measured the maximal voluntary contractions (MVC) of the biceps, triceps and deltoids of each participant. Three trials of 4 s (with a 90 s rest in-between) were performed. The highest value was kept as reference for maximal joint torque. Then, participants were asked to contract their muscles at 0% (rest condition), 25% and 50% MVC, using a visual feedback, while external deformations (group 1) and pennation angles (group 2) were measured.
2.2. Positioning on the dynamometer
The set-up of the dynamometer differed according to the muscle of interest. For the right deltoid, the participant was lying on the left lateral side with the back turn to the engine. Measures were performed at an angle of 30° to the shoulder relative to the horizontal. For the triceps, the subject was standing. The height of the engine was adjusted so that its axis of rotation was aligned with the elbow. Measures were performed at an angle of 90° between the arm and the forearm. For the biceps, the participant was sitting. The engine axis of rotation was aligned with the articulation of the elbow. Measures were performed with the elbow bent at 90°.
2.3. Muscle deformation
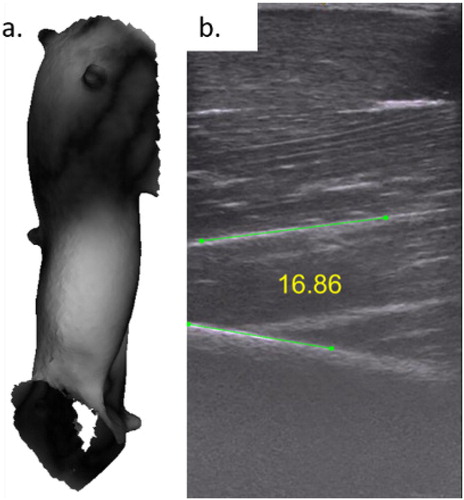
During each level of contraction, the evaluator acquired the external muscle deformation with an iPad equipped with a structure sensor. The acquired images were exported as point cloud and imported into Meshlab. Point clouds were superimposed with the help of four markers (). The Hausdorff distance and RMS values were calculated to evaluate the level of deformation between each contraction condition.
Figure 1. a. Greyscale-coded superimposition of the external surfaces of an arm with the biceps contracted at 50% relative to rest (difference of 2 cm in white, 2 mm in white). b. Pennation angle for the biceps at 50% MVC.
2.4. Muscle angle of pennation
A portable ultrasound system (LOGIQe GE Medical System) was used to measure the pennation angle during muscle contraction. Five trials were performed for each level of contraction, in a random order, with 60 s rest period in-between. Trials lasted up to 10 s, to take a sharp picture. The pennation angle was defined as the angle between the line representing the bone and the line representing the muscle fibres ().
2.5. Statistics
The same statistic test was used for the muscle deformation and for the pennation angle. A non-parametric analysis of variance (Friedman’s test) was used to test differences between 0%, 25% and 50% MVC. If significant, a post-hoc analysis (Wilcoxon signed-rank test) was applied to see if there are significant difference (p < 0.05) between pairs of different level of contraction.
3. Results and discussion
3.1. Muscle deformation
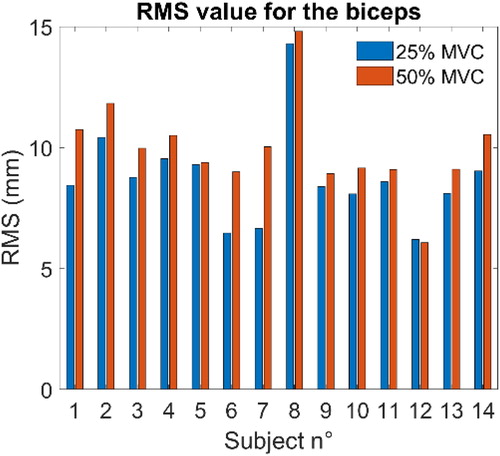
For the biceps, the mean deformation between no contraction and 25% MVC was 6 mm. Whereas there was only 2 mm difference in average for the triceps and deltoid. There was significant difference (p < 0.001) between 0% and 25% and between 0% and 50% but no significant difference between contraction at 25% and 50% ().
Figure 2. RMS values for the biceps, for each participant for 25% MVC and 50% MVC.
3.2. Pennation angles
Significant differences (p < 0.001) were only observed between 0% and the different level of contraction for the triceps and biceps. No significant differences were found for the deltoid.
3.3. Discussion
The two architectural parameters studied show that small changes in muscle activity are associated with significant change in muscle geometry and pennation angle. Indeed, most architectural changes take place between 0% and 25% MVC. No noticeable changes are observed at higher contractions. The results are in good agreement with an ultrasound study performed on the tibialis anterior, showing that all changes in muscle architecture occur gradually between 0% and 30% (Hodges et al. Citation2003). No significant changes can be observed after 30% MVC. This shows that the relation between architectural parameters (muscle geometry and pennation angle) and muscle contraction is nonlinear. It will help validating the behaviour of finite element model for muscle contraction under 25% of MCV.
There is some limitation in this study. Even with the four markers, superimposing the point clouds could generate errors up to 1 mm. Furthermore, measuring the pennation angle of the deltoid was challenging due to the curved shape of the bone underneath.
4. Conclusions
Change in muscle architecture for the biceps, triceps and deltoid during isometric contraction occurs mostly between 0 and 25% MVC. The main result of this study, such as average muscle deformation, could be used to validate finite element model of the shoulder integrating muscle contraction.
References
- Adams CR, Baldwin MA, Laz PJ, Rullkoetter PJ, Langenderfer JE. 2007. Effects of rotator cuff tears on muscle moment arms: a computational study. J Biomech. 40(15):3373–3380.
- Hodges P, Pengel L, Herbert R, Gandevia S. 2003. Measurement of muscle contraction with ultrasound imaging. Muscle Nerve. 27(6):682–692.
- Sano H, Wakabayashi I, Itoi E. 2006. Stress distribution in the supraspinatus tendon with partial-thickness tears: an analysis using two-dimensional finite element model. J. Shoulder Elbow Surg. 15(1):100–105.
- Zheng M, Zou Z, Bartolo PJDS, Peach C, Ren L. 2017. Finite element models of the human shoulder complex: a review of their clinical implications and modelling techniques. Int J Numer Methods Biomed Eng. 33(2):e02777.
- Zhou Y, Li JZ, Zhou G, Zheng YP. 2012. Dynamic measurement of pennation angle of gastrocnemius muscles during contractions based on ultrasound imaging. Biomed Eng Online. 11(1):63.