
1. Introduction
Athletes, and particularly team-sport athletes, are experiencing numerous high energy impacts caused by running, sprinting, side-cutting, landing, and others movements. Previous studies depicted that the different sport-related impacts lead to different shock characteristics, both in terms of acceleration amplitude and frequency (Fu et al. Citation2015; Trama et al. Citation2019), causing different mechanical stress to the musculoskeletal system. An excess of mechanical stress could lead to injuries (Hreljac Citation2004), and therefore, the quantification of such impacts may help to prevent these injuries. Wearable sensors, such as accelerometers, combined with a wavelet transform, allows the analyse of acceleration caused by the impact in the time-frequency domain. The recent development in artificial intelligence (i.e., neural networks) make it possible to classify various images with great precision.
Input characteristics are well characterized in running (Boyer and Nigg Citation2007), however, no study aimed to quantify and classify the impact for other sport movements. The purpose of this study was to determine if the wavelet transform of the accelerations measured at the heel, combined with a convolutional neural network, were powerful enough to classify accurately several sport-related movements.
2. Methods
2.1. Participants
A total of nine men and one woman, team sport athletes or runners, volunteered to participate in this study (age: 32.2 ± 8.9 years, height: 171.4 ± 7.0 cm, mass: 70.9 ± 10.1 kg). They were free from injury for six months prior to the experiment, and signed an informed consent document approved by the local university ethics committee.
2.2. Experimental procedure and data collection
Seven sport-related tasks were executed. The first task was a hop test; the second consisted in running in line at preferred velocity; the third task was a side-step; the fourth task was a front lunge; the fifth task was a sidecut at 45 ± 15°; the sixth and seventh tasks consisted in two landing tasks (22.5 and 45 cm). A tri-axial accelerometer (Mega Electronics, Kuopio, Finland, ±100 g, 1,000 Hz) was stuck and secured on the heel cup of the right shoe in order to record 3 D accelerations caused by the ground impacts. A total of 15 impacts for each movement was recorded with the accelerometer.
2.3. Wavelet transform
A filter bank of Morse (3,60) mother wavelets was used to performed the continuous wavelet transform (Lilly and Olhede Citation2012). The modulus of the map of coefficients given by the wavelet transform was computed for the three axis. Thereafter, an image of the three maps located side by side was saved in .jpeg format, with a dimension of 270*88 pixels, and a resolution of 96 dpi.
2.4. Convolution neural network
In this study, a convolution neural network, composed of 16 layers, was created to classify the different images representing the impacts. The network was composed by an input layer, followed by three times the succession of a convolution layer, normalisation layer, rectifier layer, and a pooling layer. The last layers were a fully connected layer, a softmax layer, and, a classification output layer. Adaptive Moment Estimation (Adam) optimisation algorithm was used with this network.
2.5. Training protocols
A total of 13 training protocols were tested, differing by three parameters: The first parameter was the presence or not of a pre-training (PRE) on the nontested participants (n = 10-1 = 9). The second was the type of specific training performed on the participant’s data: No training (NONE); a training with the data of the evaluated participant alone (ALONE); a training for which the data of the evaluated participant were mixed with the data of other participants (MIX); a training for which the data of the participant were oversampled by nine, then mixed with the data of other participants (EQ). The last parameter was the presence or not of validation process during the participant specific training (VAL). When PRE or VAL was performed, the training was performed on 70% of the data, while 30% were kept for the validation process. Trainings were performed with Matlab software, through a GPU with a compute capability of 6.1.
2.6. Test and outcomes
As the data were not numerous enough to have a sample for training, validation, and test, leave one out cross validation method was used. The average accuracy of the training, as well as the computing time needed to performed the training were computed. The confusion matrixes, depicting the sensitivity and the specificity of the network, were also computed.
2.7. Statistics
Linear mixed models and post-hoc tests were performed to compared the effect of the different trainings protocol on the accuracy and the computing time. This analysis was performed with R software.
3. Results and discussion
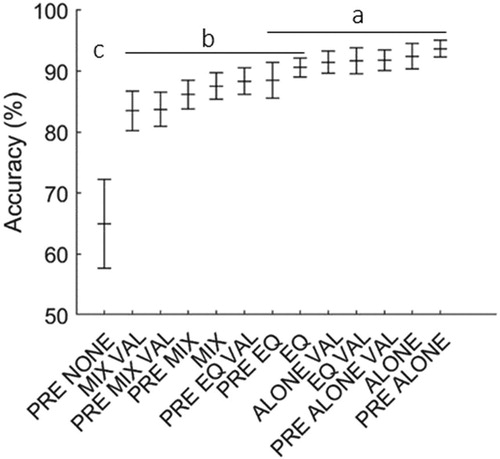
Our results depicted that the combination of PRE and VAL shortened the computing time only for MIX and EQ, with no effect on the accuracy. Confusion matrixes showed that the hoptest and running tasks were the only movements that any network can recognise with at least 90% of accuracy. Thus, it is possible that these impacts were similar between subjects, while impacts characteristics from other tasks were subject specific. ALONE were always part of the most accurate trainings (hoptest, running, and landings at 45 cm (97% of accuracy); landing 22.5 cm (94% of accuracy), side-step and side-cut (92% of accuracy), front lunge (88% of accuracy)) and of the fastest group of training (less than 6 seconds) ().
Figure 1. Accuracy (95% CI) for each training protocol. Trainings that do not share the same letter are different.
Therefore, we recommend to perform one measurement session with the aim to train a neural network on the different movements executed by the athlete in its practice. This is a first step to quantify with accuracy the athlete’s activity (i.e., number of movements executed, intensity of each impact) and estimate the associated mechanical stress underwent by the athlete, even without prior database.
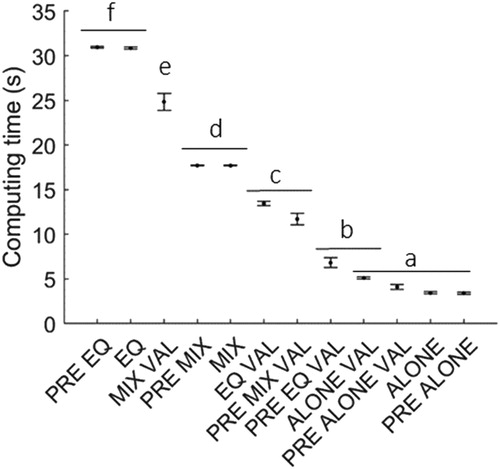
However, some limitations remain. The movements tested were standardised, and the accuracy might decrease with other movements. Additionally, the athlete’s fatigue caused by the session might modify the impact characteristics, and possibly, decrease the accuracy of the network ().
Figure 2. Computing time (95% CI) for each training protocol. Trainings that do not share the same letter are different.
4. Conclusions
The main outcome of this study was that the analysis of the impact through a wavelet analysis, combined with convolutional network, enabled a classification with accuracy of different types of impacts. Our results depicted that the ALONE trainings were the fastest and most accurate.
References
- Boyer KA, Nigg BM. 2007. Quantification of the input signal for soft tissue vibration during running. J Biomech. 40(8):1877–1880.
- Fu W, Wang X, Liu Y. 2015. Impact-induced softtissue vibrations associate with muscle activation in human landing movements: an accelerometry and EMG evaluation. Technol Health Care. 23(s2):S179–S187.
- Hreljac A. 2004. Impact and overuse injuries in runners. Med Sci Sports Exerc. 36(5):845–849.
- Lilly JM, Olhede SC. 2012. Generalized morse wavelets as a superfamily of analytic wavelets. Ieee Trans Signal Process. 60(11):6036–6041.
- Trama R, Blache Y, Hautier C. 2019. Effect of rocker shoes and running speed on lower limb mechanics and soft tissue vibrations. J Biomech. 82:171–177.